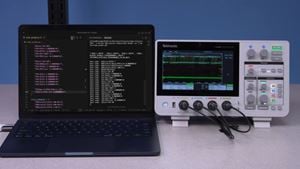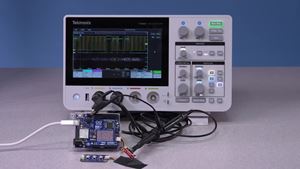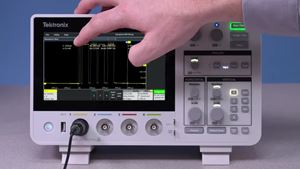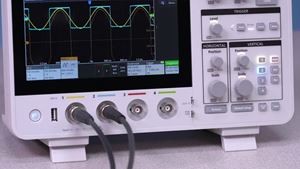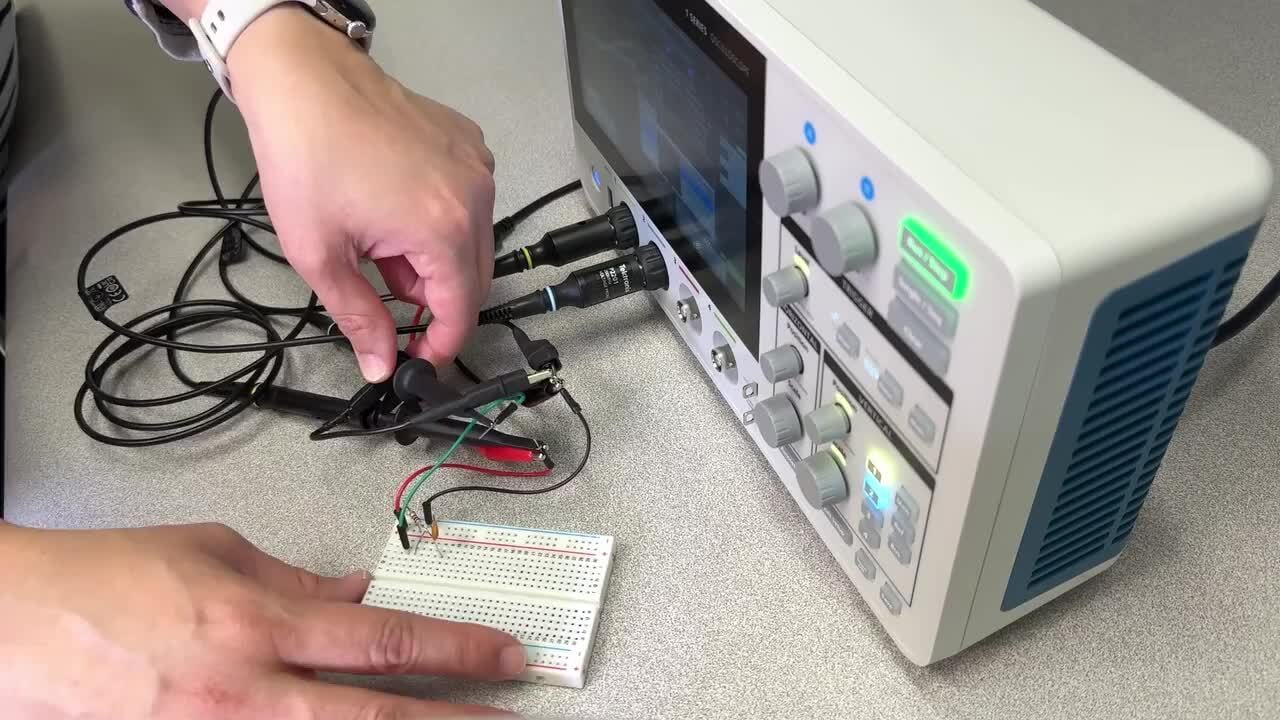
Bode plots show a device’s frequency response. The measurement is called Frequency Response Analysis (FRA). The AFG output is connected to the circuit input, with Channel 1 monitoring Vin and Channel 2 monitoring Vout. A sweep range is needed to generate the Bode plot. This example shows a sweep from 100 Hz to 5 MHz. Once completed, cursors can then be used to measure gain and phase values on the graph.
Duration 2m 7s