Download

Download Manuals, Datasheets, Software and more:

DOWNLOAD TYPE
MODEL or KEYWORD

Feedback

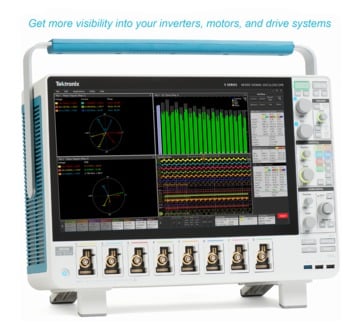
3-Phase Inverter Motor Drive Analysis

5 Series/5 Series B/6 Series B MSO Option 5-IMDA/6-IMDA Application Datasheet

5 Series/5 Series B/6 Series B MSO Option 5-IMDA/6-IMDA Application Datasheet

Measurements and analysis on three-phase power systems are inherently more complex than on single-phase systems. Although oscilloscopes can capture voltage and current waveforms with high sample rates, further calculations are required to produce key power measurements from the data. The oscilloscope based three-phase solution allows to capture three-phase voltage and current waveforms with higher sample rates, longer record lengths using the HiRes acquisition mode that goes up to 16-bits and with the support of automated measurements produce key power test results. The Power converters based on Pulse Width Modulation (PWM), such as variable-frequency motor drives can complicate measurements since it is very important to extract precise zero crossings for the PWM signals, thus making an oscilloscope a recommended test tool for validation and troubleshooting for motor designers. Special software, designed to automate power analysis on inverters, motors, and drives, greatly simplifies important three-phase power measurements on PWM systems and can help engineers get faster insights into their designs. The Inverter Motor Drive Analysis (IMDA) solution from Tektronix helps engineers design better and more efficient three-phase motor drive systems, taking full advantage of the advanced user interface, six or eight analog input channels, and ‘High Res’ mode (16 bits) on the 5 Series/5 Series B/6 Series B MSO. The IMDA solution provides fast, accurate, and repeatable results for electrical measurements on industrial motors and drive systems for AC induction motors, permanent magnet synchronous motors (PMSM), and brushless DC (BLDC) motors. It can be configured to measure DC to three-phase AC converters, such as those used in the electric vehicles.

Key features and specifications

  • Accurately analyze three-phase PWM signals used to drive AC induction, BLDC, and PMSM motors.
  • Unique oscilloscope based phasor diagrams indicate VRMS, IRMS, VMAG, IMAG, and phase relationships at a glance for the configured wiring pairs.
  • Debug motor drive designs by viewing the drive input/output voltage and current signals in the time domain simultaneously with the phasor diagram.
  • Three-phase Autoset feature configures the oscilloscope for optimal horizontal, vertical, trigger, and acquisition parameters for acquiring three-phase signals.
  • Measures three-phase harmonics per the IEC-61000-3-2, IEEE519-2014, and IEEE519-2022, or custom limits.
  • Measures the system efficiency based on the selected wiring configurations.
  • Quickly add and configure measurements through the intuitive drag and drop interface on the 5 Series/5 Series B/6 Series B MSO.
  • Analyze Inverter and Automotive three-phase designs for DC input and AC output wiring configuration.
  • Displays the PWM filtered edge qualifier waveform during analysis.
  • Displays the test results per Record, or per Cycle mode during analysis for specific measurements.
  • Supports Time trend and Acquisition trend plots for specific measurements.
  • Supports mathematical conversion of Line-Line to Line-Neutral for specific wiring.
  • Supports DQ0 measurements with the phasor plot and resultant vector navigation using oscilloscope cursors.
  • Supports Angle measurement offset configuration for DQ0 measurement.
  • Supports mechanical measurements and DQ0 using Resolvers, Hall sensors, and QEI (Quadrature Encoder Interface) signals with and without the Index pulse.
  • Supports Torque measurement.
  • Supports harmonic gating of all measurements by fundamental frequency and full spectrum.
  • Computes the Mechanical power and System efficiency.

Measurement overview

Three-phase power converters such as variable frequency drives require a range of measurements during the design process. The Inverters, Motors, and Drives Analysis package for the 5 Series/5 Series B/6 Series B MSO automates key electrical measurements which are grouped into the Electrical Analysis group. The measurements can be configured to measure the Input or Output wiring configuration.

IMDA EN US 48W 61649 7
IMDA measurements under Electrical Analysis group

The measurements can be set to measure 1V1I (1-Phase-2-Wire), 2V2I (1-Phase-3-Wire), 2V2I (3-Phase-3-Wire), 1V1I (1-Phase 2-Wire DC) or 3V3I (3-Phase-3-Wire), and 3P4W (3-Phase-4-Wire) to support various supply and motor configurations. Measurements can be performed line-to-line or line-to-neutral, to support delta and wye or star configurations.

IMDA EN US 48W 61649 7
Configuring the measurement for Input wiring configuration

Harmonics

Power waveforms are rarely textbook sinusoids. Harmonics measurements break down non-sinusoidal voltage or current waveforms into their sinusoidal components, indicating the frequency and amplitude for each component.

Harmonics analysis can be performed up to 200th harmonic order. The maximum harmonic order can be set to suit your needs by specifying the range in the measurement configuration. THD-F, THD-R, TDD and fundamental values are measured for each phase. Measurements can be evaluated against the IEEE 519-2014, IEEE 519-2022, or IEC 61000-3-2 standard, or custom limits. Test results can be recorded in a detailed report indicating pass/fail status.

IMDA EN US 48W 61649 7
Compare harmonics measurements against industry standards or custom limits

IMDA EN US 48W 61649 7
A sample harmonics plot indicates passing harmonics test results. Each set of bars contains results for Phase A, B, and C for easy correlation.

The Harmonics plot shows the test results for all three phases grouped together so user can correlate the test results between the phases. The plot also shows the test results visually. The harmonics bars are highlighted in green color during a pass condition, and highlight to red color when it exceeds the test limits. This gives a quick insight when debugging for harmonics design.

Power Quality

This measurement provides critical three-phase power sub-measurements including: frequency and RMS magnitudes of voltage and current, crest factors of voltage and current, PWM frequency, and phase angle for each phase. It also displays the sum of true power, sum of reactive power, sum of apparent power components.

Additionally, in the Line-Neutral configuration, this measurement displays True Power, Reactive Power, and Apparent Power components of all the three-phases.

Voltage and current vectors can be displayed on a phasor diagram so you can quickly judge phase shift for each phase and the balance among phases. Each vector is represented by an RMS value and phase is computed using the Discrete Fourier Transform (DFT) method.

IMDA EN US 48W 61649 7
Easily configure the settings to get insight into the Power Quality
IMDA EN US 48W 61649 7
Method to compute Power Quality

The Power quality measurement can be configured to provide critical three-phase power measurements on the output side, including: frequency and RMS magnitudes of voltage and current, crest factors of voltage and current, PWM frequency, true power, reactive power, apparent power, power factor, and phase angle for each phase.

IMDA EN US 48W 61649 7
Easily configure the voltage and current inputs on the Power Quality measurement to display phasor diagrams

IMDA EN US 48W 61649 7
Unique oscilloscope based phasor diagram feature provides the relation between the voltage and current vectors

Efficiency

Efficiency measures the ratio of the output power to input power. The IMDA solution supports efficiency of three-phase AC and Inverter configurations. By using the 2V2I method, three-phase efficiency can be measured using eight oscilloscope channels (2 voltage and 2 current sources on the input side and 2 voltage and 2 current sources on the output side). The solution calculates efficiency at each phase (for 3V3I configuration) and the total (average) efficiency of the system based on the different input and output wiring combinations.

IMDA EN US 48W 61649 7
Configure wiring and filters to perform efficiency measurements for an Industrial motor
IMDA EN US 48W 61649 7
Configure wiring and filters to perform efficiency measurements for a DC-AC topology most suitable for inverter testing

IMDA EN US 48W 61649 7
Get complete insight into the overall system efficiency

Ripple analysis

Ripple is defined as the residual or unwanted AC voltage on a constant DC component. It is typically measured on the DC bus. This measurement helps to understand how efficiently the signal is getting converted from AC-DC on the input side, and the impact of unwanted components on the PWM signal on the output side.

IMDA EN US 48W 61649 7
Ripple analysis configuration can be set to look into line and switching ripple
IMDA EN US 48W 61649 7
Ripple measurement being carried out on the DC-input signals when testing an Inverter

Direct Quadrature Zero (DQ0) analysis

The behavior of three-phase AC machines can be described by rotating voltage and current equations as below.

IMDA EN US 48W 61649 7

Where,

A, B, and C are three phase AC signals.

Vg is the corresponding gain.

w(t) is the 2pi×f×t.

The voltages (V) and currents (I) at the AC interface are usually separated, typically 120 degrees out of phase. These V and I components are time-varying, which means there is no representation of a steady-state operation point.

Generally, AC signals are real-world signals, but converting them to DC helps get an abstract representation of the direct quadrature transform. The DQ0 assists in emulating the controller. This information helps to understand more about what the controller is doing and allows to tune the controller design.

The DQ0 transformations typically rotate the reference frames of AC waveforms to convert them to DC signals. This allows simplified calculations on the DC signals before performing the inverse transform to recover the actual three-phase AC results.

To measure and monitor the control system’s output, the designers depend on FPGA’s and ASIC-based hardware to handle sensor data to get the DQ0 information and then check the control information through multiple iterations. This solution involves a complex and time taking process.

It is practically challenging to measure or probe the D-Q-0 signals. A typical solution provides an external stimulus to the controller to replicate the controller input signals and the Analog-Digital Controller (ADC) outputs as the DQ0 signals.

To address this challenge, users depend on the software application DQ0 solution to understand the complex dynamic phenomena in power control systems.

The IMDA solution features DQ0 transformation, which rotates the reference frames of the three phase waveforms, so they become DC signals. Calculations can be simplified on these DC quantities before inverting them and getting to the actual three-phase AC results. A basic control scheme is shown in the following figure.

IMDA EN US 48W 61649 7
Typical connection setup and probing points for doing DQ0 measurements

Tektronix offers a patented measurement called DQ0 under the electrical analysis measurement category as an added option using Clarke’s and Park’s transformation matrix. The DQ0 feature is available as an option 5-IMDA-DQ0/6-IMDA-DQ0 on the 5 Series, 5 Series B, and 6 Series B MSO.

The DQ0 method calculates the angle (θ) as 2*pi*f*t and extrapolates the reference frame based on where we expect time-varying signals to be. The DQ0 frame (phasor diagram) rotates with the right speed and frequency and not necessarily in phase with the rotor, which helps to understand the instantaneous state of the motor.

This measurement is supported in the 3V3I configuration, takes the three-phase voltage or current signals from the motor as inputs, and converts them into D-Q-0 coefficients acting as a powerful debugging tool for the motor designers to tune their PWM controller circuit designs.

The measurement computes real-time DQ0 transformation by converting the 3-phase drive output voltage or current waveforms. The transform matrix converts time-varying AC signals into time-invariant DC components. This helps to reproduce the control system's understanding of instantaneous motor torque and speed. The use of the DQ0 transformation allows motor designers to correlate the performance of the 3Phase power section to control system of the hardware algorithms and design. The overlapped DQ0 and 3-phase ABC vectors act as a good debug feature for designers to observe simultaneously both vector axis on the same plot.

There are different outputs of this measurement such as scalar values with the magnitude of D and Q, RMS values with statistics, derived math waveforms, and a phasor diagram. Math waveform provides the DC transformed waveform. This provides the different views of the control system outputs in a single view.

By observing the DQ0 results, some important inferences can be drawn, such as variations indicating to RMS ripple, peak to peak values, and higher-order harmonics. These parameters directly relate to understanding the operation of the algorithms in the control systems. Without this information, it would be difficult to understand the performance of the motor control systems.

IMDA EN US 48W 61649 7
DQ0 with QEI configuration
IMDA EN US 48W 61649 7
DQ0 offset configuration

Configure the offset (electrical) angle:

  • To adjust if there is any position misalignment of the mounted encoder/sensors.
  • If there is any low pass filter delay after applying the filter on the electrical signals.

This is also supported with and without sensors configuration. If analog sources are configured for electrical measurement and digital sources for mechanical measurement then enter the low pass filter phase delay and position misalignment combined as an offset angle.

IMDA EN US 48W 61649 7
DQ0 measurement running on the 5 Series MSO. They are represented on the phasor diagram as Q (green), D(orange), and Z (white) vectors and their scalar values are available in the results badge on the right. The DQ0 waveforms are shown as Math M1, Direct (purple), Quadrature (red), and Zero (green).

The enhanced DQ0 algorithm computes the resultant vector from the D and Q components and displays a resultant vector as an overlapped motor rotations, and integrated with instantaneous motor angle (theta).

IMDA EN US 48W 61649 7
The DQ0 plot displays the resultant as rotating persistence plot.

Dynamic measurements using trend analysis

A common requirement in motor drive analysis is an ability to look at the motor response over longer test times, records, and an extended number of acquisitions to monitor the DUT behavior over varying load conditions. This dynamic measurement helps to understand optimal designs and interdependency between different parameters like voltage, current, power, frequency, and their variance based on the load conditions. You can manually zoom and get the specific region of interest to look at test results at the particular region of the waveform.

IMDA solution offers two unique trend plots on the power quality measurement to support such requirements:

  • Time trend plot
  • Acq trend plot

Each plot has its advantages and can be used to plot the supported sub-measurements under power quality measurement. The time trend plot shows the measured value per cycle, or for an acquired waveform (a record), while the acq trend plot shows a mean of the measured value per record, over each of the acquisitions. The acquisition count can be set during the test configuration. This allows you to capture long records of data to perform deep record analysis and understand the dynamic behaviors of the motor response. The plots can be saved as a CSV file for post-processing.

IMDA EN US 48W 61649 7
Time trends enable you to graphically analyze power measurements within one acquisition record. Acquisition trends can plot power measurements over many acquisitions for longer-term testing.

IMDA EN US 48W 61649 7
This example shows acquisition trend plots of mean power measurements for 100 acquisitions, including - Vrms, Irms, phase difference, sum of true power, apparent power, and reactive power.

IMDA EN US 48W 61649 7
Add and configure the Time Trend plot on different sub-measurements of Power Quality measurement. The image shows two time-tend plots monitoring Vrms and Frequency parameters.

Mechanical analysis

The IMDA mechanical analysis group (Option IMDA-MECH) supports Hall sensor, Resolver, and QEI output signals to calculate speed, acceleration, and direction information. In addition to these measurements, the QEI method also supports the angle measurement and displays them in degrees or radians. The acceleration results are reported as part of the speed measurement. The measurement requires the number of pole pairs and corresponding gear ratio to measure key motor parameters. The direction measurement expects a sequence of hall sensor rising edges to be configured before operation and validates them during the operation. For the QEI method, the measurement requires the information on QEI outputs - Phase-A, Phase-B, the optional Z-index pulse, and Pulses per Rotation (PPR).

The TPP1000 passive probes or high voltage differential THDP0200/100 probes can be used to capture the sensor outputs depending on the motor output power and noise levels. Digital channels with TLP logic probes are recommended for use instead of analog because of lesser noise and can help to conserve analog channels for other tests operations and use single flex channel for the measurement.

IMDA EN US 48W 61649 7
IMDA mechanical analysis supports speed (with acceleration) and direction measurements

Speed measurement

Hall sensor signal transition as shown in the following figure.

IMDA EN US 48W 61649 7
Speed measurement computation using three hall sensor transitions

Speed is defined by the following equation,

IMDA EN US 48W 61649 7

Where,

Difference between TSP and TST is defined by the number of pole pairs.

TST is the start if the electrical pulse

TSP is the stop if the electrical pulse

60 is the RPM (revolutions per minute)

G is the gear ratio.

Speed measurement can be calculated either once per rotation or for every QEI sensor signal cycle.

Acceleration measurement

Acceleration is rate of change of speed per unit time. It is defined as

IMDA EN US 48W 61649 7

Speed and direction support following plots:

  • Histogram
  • Time Trend
  • ACQ Trend
IMDA EN US 48W 61649 7
Measuring motor speed and direction using QEI method. The QEI signals (Phase A, B, and Z index) are shown for reference by connecting both Analog (TPP1000) and Digital (TLP058) probes.

Importance of speed ACQ trend plots

The ACQ trend along with the histogram plot shows jitter on motor speed, which otherwise requires dedicated instrument like a flutter meter to measure. This jitter information (variations in edge timing) measures the motor-speed consistency.

IMDA EN US 48W 61649 7
ACQ trend plot displaying Jitter on the motor speed (left) along with a histogram plot (right) that indicates the speed distribution

Motor start-up profile

Motor designers are interested to investigate the motor startup profile during the design stage. The time trend gives the instantaneous speed information of a motor which otherwise is hard to measure.

In the following Time trend plot showing startup sequence of a motor image, where the start-up time taken by the motor is 2.3s from OFF to a ON state. Similarly, one can perform ON to OFF state and gain insights into the de-acceleration process as shown in the figure Time trend plot showing deceleration of a motor into a stop state image.

IMDA EN US 48W 61649 7
Time trend plot displaying start-up sequence of a motor
IMDA EN US 48W 61649 7
Time trend plot displaying deceleration of a motor into a stop state

Direction measurement

Some applications like drills, washing machines, and electric pumps require motor to operate and change directions rapidly. The direction measurement helps with this analysis. The order of rising edges or falling edges of hall sensor output determines the direction of rotation. The direction measurement needs all three hall signals. They are available as configurable parameters for the direction measurement and are validated during the motor operation. Generally, a A-B-C sequence is interpreted as clockwise (CW) and a A-C-B sequence is interpreted as counter-clockwise (CCW).

For example, if the first rising edge is from HALL A and a rising edge of HALL B exists at 120 degrees, then the rotor rotation sequence is A-B-C. Else, if the second rising edge of HALL C occurs at 120 degrees, then the sequence is A-C-B.

IMDA EN US 48W 61649 7
Direction information interpreted from the Hall sensor outputs
IMDA EN US 48W 61649 7
Direction information captured on the scope shows a HALL A,B,C rising edge sequence (clockwise rotation)

Here is the formula used to compute the direction information.

Order (Clockwise) = (A-B-C)

Order (Counter-clockwise) = (A-C-B)

Where Order function checks for the sequence of rising edges on all three hall sensor signals.

Direction can be displayed as an ACQ trend plot to give a visual indication on an exact timestamp when the motor reversed the direction helping during the debug. This is shown as a sample plot in the following figure.

IMDA EN US 48W 61649 7
The ACQ trend plot shows +1 and -1 based on CW and CCW motor rotation.

Resolvers

Resolver is a sensor that is mounted on a motor to determine the angular position of the rotor.

A resolver produces three signal outputs, Excitation - used as a reference, Sine, and Cosine used for analysis. The Sine and Cosine signals are orthogonal to each other and are modulated with the reference signal. The Sine and Cosine envelopes are extracted before measuring the various parameters.

Following measurements are available with resolver support:

  • The instantaneous angle is measured by:

    Angle = arctan(sin value/cos value)

  • The formula for computing Speed is

    Speed = [Frequency(envelope signal) / Pole pairs] Hz

    Where envelope signal is the output of the envelope extraction.

IMDA EN US 48W 61649 7

Torque measurement

The torque of a motor is the rotary force produced on its output shaft, it is a twisting force that is measured in Newton-meters (Nm).

IMDA supports two methods for torque measurements:

  1. Sensor method:

    This is the most common torque measurement that uses the torque sensor or the Load cell output. Measuring the torque generated by motors can be done by coupling a rotary torque sensor in line with the motor shaft. Users can capture Torque waveform using a passive voltage probe. The voltage waveform is proportional to a measured torque value.

    The user must configure high and low values of the Torque sensor and corresponding high and low values of the output voltage. The measurement rescales the acquired voltage waveform to the Torque values.

    The Load cell provides the Force. The Torque value is computed as a product of force and the arm length (distance).

    IMDA EN US 48W 61649 7

  2. Current method:

    Many motors have data specifications by which torque can be inferred as proportional to applied RMS current by using the Torque constant. This is an estimation of the torque value.

    Generally, the torque developed in any dc motor is proportional to the torque constant times the armature current. In a series motor, the field current is proportional to the armature current.

    The torque produced by the rotor is estimated to be directly proportional to the armature current. The user must configure the Torque constant of the motor.

    Torque = Torque constant x Irms

The torque measurement supports the following plots:

  • Histogram
  • Time Trend
  • ACQ trend.

Following torque units are part of the configuration:

  • Newton Meters (N·m)
  • Foot pounds (ft·lb)
  • Inch ounces (in·oz)
  • Inch pounds (in·lb).

IMDA EN US 48W 61649 7
Torque measurement setup using the torque sensor method
IMDA EN US 48W 61649 7
Torque measurement setup using the armature current method
IMDA EN US 48W 61649 7
The image shows torque results as an ACQ trend plot using a Load cell output.
IMDA EN US 48W 61649 7
The image shows torque results as a histogram plot using a torque constant and armature current output

Mechanical Power measurement

The Mechanical Power of a rotating shaft is determined by its speed of rotation and the torque that it provides. This measurement supports Hall Sensors and QEI encoder to compute Speed and Torque.

The Mechanical Power measurement computes torque using either a torque sensor or an armature current input, and speed using hall or QEI sensor inputs. The computed Mechanical power using these inputs are directly proportional to the product of speed and torque of the shaft.

IMDA supports different sensor types to measure torque, speed, and angular position of the motor.

Mechanical Power = (Torque × Multiplier) × Speed

Where the Multiplier is based on the torque unit and it can be 104.7252 nm, 0.739522 oz-inch, 141.9883 ft-lb, or 11.83235897 inch-lb.

Speed is in RPM.

Mechanical Power is in Watt.

IMDA EN US 48W 61649 7
Typical motor setup for computing System Efficiency and Mechanical Power

IMDA EN US 48W 61649 7
Configuration options for Mechanical Power measurement

System Efficiency measurement

System Efficiency is the measure of the effectiveness with which electrical energy is converted to mechanical energy. This measurement is often performed at different speeds under different loads and is commonly displayed as a speed torque curve.

Power efficiency is a measure by which all the electrical equipment is rated, so it is important to measure it dynamically to check whether the motor is operating in the desired region.

The IMDA System Efficiency measurement takes in electrical voltage and current inputs to compute the input power and torque and speed sensors signal to compute the output mechanical power. Based on these parameters, system efficiency is computed. The electrical power can be computed using 2V2I or 3V3I wiring based on the oscilloscope channels available.

For an electrically driven motor, the output power is mechanical while the input power is electrical, so the efficiency equation is computed by

System Efficiency = ((Output mechanical power)/(Input electrical power)) × 100%

IMDA EN US 48W 61649 7
Configuration options for computing System Efficiency using Hall sensors method

IMDA EN US 48W 61649 7
Configuration options for computing System Efficiency using QEI method

IMDA EN US 48W 61649 7
The image shows IMDA application running System Efficiency, Mechanical Power, and Torque measurements using the QEI method

Report generation

The IMDA software simplifies data collection, archiving, documentation of your design, and development process. It supports the report generation in MHT or PDF formats with pass/fail results for easy analysis.

IMDA EN US 48W 61649 7
A sample IMDA test report file with summary, details, and corresponding images

Specifications

Wiring configuration
1V1I (1-Phase-2Wire), 2V2I (1 Phase-3-Wire), 2V2I (3-Phase-3-Wire), 2V2I (DC In-AC Out), 3V3I (DC In-AC Out) or 3V3I (3-Phase-3Wire), and 3P4W (3-Phase-4Wire)
L-L to L-N conversion
Applicable for 3 Phase-3 Wire (3V3I)1
Electrical analysis
Power quality, Harmonics2, Ripple, DQ03, Efficiency4
Sensors supported
Hall sensors, Resolvers, QEI (Quadrature Encoder Interface)
Mechanical analysis
Speed, Acceleration, Angle (QEI method), Direction, Torque, Mechanical Power, and System Efficiency
Harmonic gating
Fundamental and full spectrum
Three-phase autoset
For all measurements
Plots
Time Trend plot, ACQ trend plot, Phasor diagram, harmonics bar graph 5, DQ0 plot, and Histogram plot (speed distribution)
Report
MHT and PDF format, Data export to CSV format
Degauss/Deskew (static)
Automatic detection of probes, Auto Zero. User can deskew voltage and current probes, degauss the current probe from the menus for each channel
Source support
Live analog signals, reference waveforms, and math waveforms

Ordering information

Models

ProductOptions6Supported instruments Bandwidth available
New instrument order option 5-IMDA

5 Series MSO (MSO56, MSO58)

5 Series B MSO (MSO56B, MSO58B)

MSO58LP

  • 350 MHz

  • 500 MHz

  • 1 GHz

  • 2 GHz

Product upgrade option SUP5-IMDA
Floating license SUP5-IMDA-FL
New instrument order option 5-IMDA-DQ0
Product upgrade option SUP5-IMDA-DQ0
Floating license SUP5-IMDA-DQ0-FL
New instrument order option 5-IMDA-MECH
Product upgrade option SUP5-IMDA-MECH
Floating license SUP5-IMDA-MECH-FL
New instrument order option 6-IMDA 6 Series B MSO (MSO66B, MSO68B)
  • 1 GHz
  • 2.5 GHz
  • 4 GHz
  • 6 GHz
  • 8 GHz
  • 10 GHz
Product upgrade option SUP6B-IMDA
Floating license SUP6B-IMDA-FL
New instrument order option 6-IMDA-DQ0
Product upgrade option SUP6B-IMDA-DQ0
Floating license SUP6B-IMDA-DQ0-FL
New instrument order option 6-IMDA-MECH
Product upgrade option SUP6B-IMDA-MECH
Floating license SUP6B-IMDA-MECH-FL

Software bundles

Supported instrumentsBundle optionsDescription

5 Series/5 Series B MSO

5-PRO-POWER-1Y1 Year License Pro Power Bundle
5-PRO-POWER-PERPerpetual License Pro Power Bundle
5-ULTIMATE-1Y1 Year License Ultimate Bundle
5-ULTIMATE-PERPerpetual License Ultimate Bundle
5-PRO-AUTO-1Y1 Year License Pro Automotive Bundle
5-PRO-AUTO-PERPerpetual License Pro Automotive Bundle
6 Series B MSO6-PRO-POWER-1Y1 Year License Pro Power Bundle
6-PRO-POWER-PERPerpetual License Pro Power Bundle
6-ULTIMATE-1Y1 Year License Ultimate Bundle
6-ULTIMATE-PERPerpetual License Ultimate Bundle
6-PRO-AUTO-1Y1 Year License Pro Automotive Bundle
6-PRO-AUTO-PERPerpetual License Pro Automotive Bundle

Recommended probes

Probe model Description Quantity
TCP0030A or TCP0150 Current Probes 3 for 3V3I wiring7
THDP0200 or TMDP0200 High Voltage Differential Probes 3 for 3V3I wiring7