

Contact us
Live Chat with Tek representatives. Available 6:00 AM - 4:30 PM
Call us at
Available 6:00 AM – 5:00 PM (PST) Business Days
Download
Download Manuals, Datasheets, Software and more:
Feedback
7 Series DPO
Digital Phosphor Oscilloscope Datasheet
More Information
- Máy hiện sóng lân quang số DPO 7 Series
- Product Support
- Explore more Máy hiện sóng | So sánh các mẫu Tektronix hiệu suất cao models
Read Online:

Performance oscilloscope with low noise and high fidelity signal acquisition
With up to 25 GHz analog bandwidth, the 7 Series DPO provides the most accurate real time performance in its class:
First 8 channel 25 GHz performance oscilloscope
Low vertical (random) noise with high ENOB
Fast throughput with 10 Gb Ethernet LAN SFP+ port with TekHSI
TM technologyDelightful, yet familiar built-for-touch UI and TekScope
TM software, available with either embedded (Linux) or Windows OS
The 7 Series’ low noise, high fidelity signal acquisition is critical for high bandwidth applications such as:
Advanced research & investigation of transient phenomena
Digital design & validation including signal integrity, jitter, and timing analysis
Memory bus analysis and debug
Compliance testing and debug of high speed serial interfaces for industry standards
Analysis of signal integrity and power integrity in artificial intelligence data center development
Spectral analysis of transient or wide-bandwidth RF
Key performance specifications
Input channels
4 TekConnect
® each with TCA292D 50 Ω 2.92 mm input adapter (all models); four 50W 2.92 mm input channels (DPO718AX only)1 Aux In (TekConnect) with TCA292D 50 Ω 2.92 mm input adapter
Bandwidth (all analog channels)
8 GHz, 10 GHz, 13 GHz, 16 GHz, 20 GHz, 25 GHz (upgradable)
Sample rate (all analog channels)
Real-time: 125 GS/s on 4 channels or 62.5 GS/s on 8 channels
Interpolated: 12.5 TS/s
500 Mpoints standard with 1 or 2 Gpoints optional
ADC resolution
12-bit ADC with high ENOB
Noise Reduction
QuietChannel
™ technology with Active CTLE (Continuous Time Linear Equalization) with 7 boost settings and one-button optimization routine which selects the optimal setting for the input signal to compensate for high-frequency signal channel loss.
Horizontal
Precision timebase with low intrinsic jitter
Pinpoint
Allows selection of virtually all trigger types on both A and B trigger events delivering the full suite of advanced trigger types for finding sequential trigger events
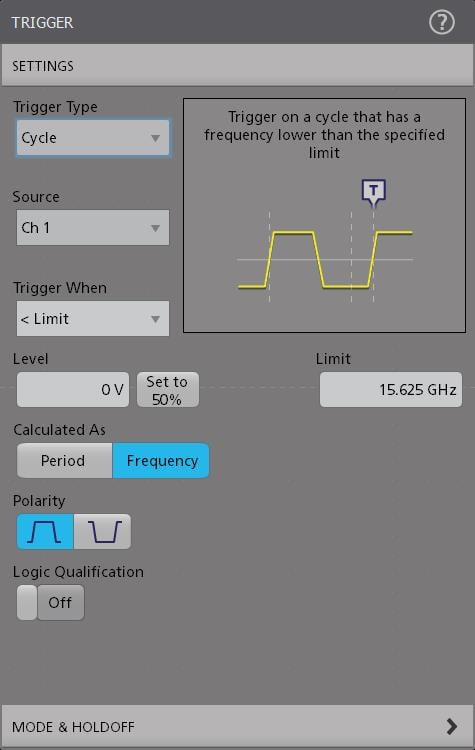
Edge, Pulse width, Timeout, Runt, Window, Cycle, Rise/Fall Time, Visual Trigger
26.6 Gbps Bit Error Detector
Supports 1 Gbps to 26.6 Gbps NRZ data rates
Utilizes digital trigger system to detect and trigger on bit errors in PRBS7-9-11-13-15-16-20-21-23-31 and custom patterns
Combine with any protocol decoder option to facilitate debug and diagnosis of errors. See
Ordering information Step 6 for more information about these options.
Waveform Capture Rate
FastAcq™ - up to 150,000 waveforms/sec
FastFrame™ - maximum trigger rate >30,000,000 waveforms/sec
Low-latency Aux In analog triggering
<20 ns from trigger in on Aux In and Ch1 to Aux Out BNC on rear panel
Probing
P7700 & P7600 TriMode
™ probing system – perfectly matched signal connectivity, with calibration to the probe tipTCA292D TekConnect
™ AdapterFor other probe types, see
Ordering Information Step 7
Standard analysis
Cursors: Waveform, V Bars, H Bars, V&H Bars
Measurements: 36
FastFrame™: Segmented memory acquisition mode with maximum trigger rate >30,000,000 waveforms per second
Plots: Time Trend, Histogram, Spectrum, and Phase Noise
Math: Basic waveform arithmetic, FFT, and advanced equation editor
Search: Search on any trigger criteria
Jitter: TIE and Phase Noise
Optional analysis
Advanced Jitter and Eye Diagram Analysis (Opt 7-DJA)
Signal Integrity Modeling for Embedding/De-embedding and Equalization (Opt 7-SIM, Opt 7-SIMA)
User-defined filtering (Opt 7-UDFLT)
Mask/Limit Testing (Opt 7-MTM)
Time Domain Reflectometry (Opt 7-TDR)
Advanced Vector Signal Analysis (SignalVu-PC)
Optional compliance, protocol trigger, decode, and search
PCIe, USB, DisplayPort, HDMI, DDR, MIPI and many other supports – refer to
Ordering Information Step 5 for complete list of supports
Arbitrary Function Generator (Opt 7-AFG)
100 MHz waveform generation
Waveform Types: Arbitrary, Sine, Square, Pulse, Ramp, Triangle, DC Level, Gaussian, Lorentz, Exponential Rise/Decay, Sin(x)/x, Random Noise, Haversine, Cardiac
Trigger frequency counter (free with product registration)
11-digit
Display
15.6 inch (396 mm) TFT color
High Definition (1,920 x 1,080) resolution
Capacitive (multi-touch) touchscreen
Compute and storage
12-core processor, 96 GB System RAM
≥ 1.6 TB removable NVMe SSD (solid state drive)
Std SSD: Closed Embedded OS, Opt SSD: Windows 10
Connectivity
LAN (10G Ethernet on SFP+ and 10/100/1000 Base-T Ethernet on RJ-45)
USB 3.0 Host (3 front & 4 rear), USB 3.0 Device (1 port rear)
DisplayPort, HDMI
Sample Clock In/Out, Ext Ref In, Ref Clock Out, Sync In/Out, Aux Out
e*Scope
Remotely view and control the oscilloscope over a network connection through a standard web browser
Dimensions
12.9 in (327 mm) x 22.1 in (560 mm) x 24.4 in (620 mm) (HxWxD with handles)
12.9 in (327 mm) x 17.9 in (454 mm) x 24.4 in (620 mm) (HxWxD without handles)
Weight
DPO714AX and DPO718AX: 84 lbs. (38.1 kg)
Warranty
1 year standard
7 Series Investment Protection Program (IPP)
As signals get faster and new standards are developed, your investment in a 7 Series oscilloscope can evolve with your needs. You can upgrade the bandwidth of the oscilloscope you own today. You can take advantage of 7 Series performance improvements by upgrading your existing MSO/DPO70000DX or DPO70000SX oscilloscope to a new 7 Series oscilloscope. Contact your local Tektronix representative to discuss the full range of options available with the 7 Series Investment Protection Program (IPP) to ensure you have the best tools you need for your next project.
First 8 channel 25 GHz performance oscilloscope
The DPO718AX is the first 8 channel oscilloscope with 25 GHz bandwidth in a single instrument which offers unparalleled flexibility especially for rackmount applications where both channel density with highest signal fidelity are paramount. The DPO718AX is based upon the DPO714AX with the addition of 4 additional channels using the 2.92 mm Planar Crown® connector system.
Users now have the choice of selecting either:
125 GS/s on just the 4 TekConnect™ channels, which support both P7000 Series probes and 50 Ω connections using TCA292D TekConnect™ adapters
62.5 GS/s on all 8 channels using both the 4 TekConnect™ channels and the 4 2.92 mm Planar Crown® 50 Ω only channels

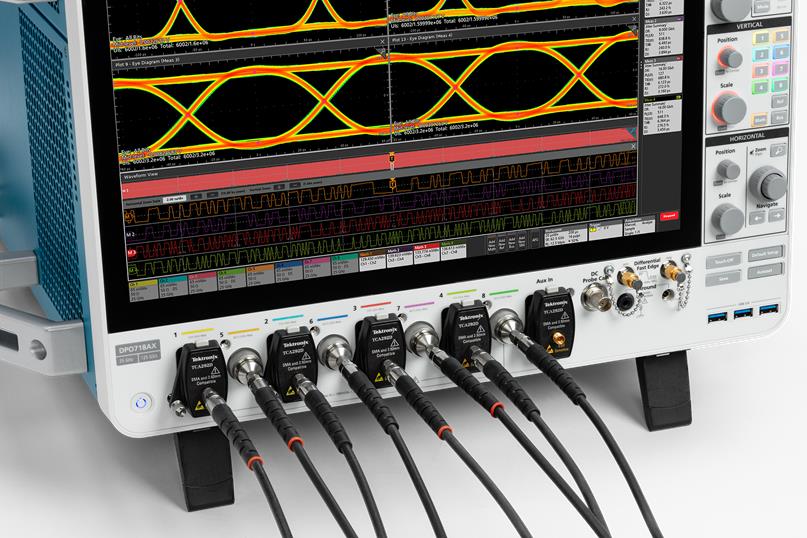
Similar to the quick connect/disconnect capability of the TekConnect™ probe interface, the Planar Crown® connector system offers a quick connect/disconnect capability without the use of a torque wrench. It also offers reduced downtime the ability to quickly replace damaged connectors without any tools and without having to send the instrument back for service.
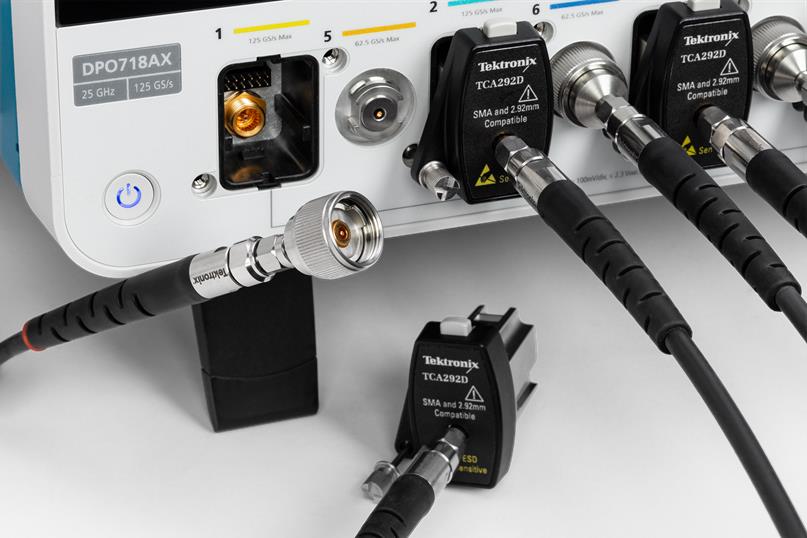
TekConnect™ Probe Interface
The TekConnect probe interface sets the standard for ease of use in probing. In addition to the secure, reliable connection that the interface provides, many TekConnect probes feature status indicators and controls, as well as a probe menu button right on the comp box itself. This button brings up a probe menu on the oscilloscope display with all relevant settings and controls for the probe. The TekConnect interface enables direct attachment of current probes without requiring a separate power supply. TekConnect probes can be controlled remotely through USB or LAN, enabling more versatile solutions in ATE environments. The 7 Series DPO provides plenty of power to the front panel connectors, sufficient to power all connected TekConnect probes without the need for an additional probe power supply.
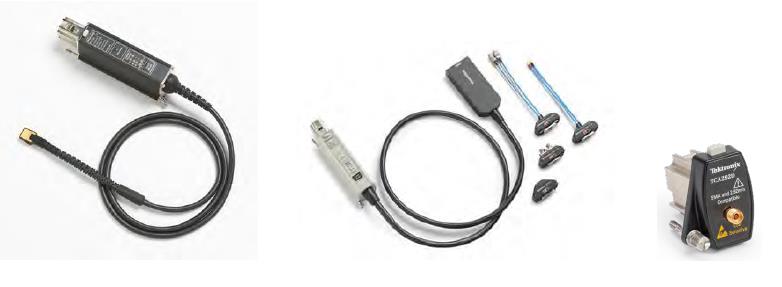
The P7700 and P7600 TriMode probes allow you to switch among differential, single ended, and common-mode measurements without moving the probe from its connection points. The P7700 Series TriMode probes with low noise provide connectivity innovations such as solder down tips with the probe’s input buffer mounted only a few millimeters from the end of the tip. The P7600 Series combines low noise, 33 GHz bandwidth in a remote head form factor with the convenience of Trimode probing.
The TCA292D allows you to use ≥ 25 GHz 2.92 mm coax cables and connectors.
For other probe types, see
Low Noise, High ENOB - Unmatched Measurement Results
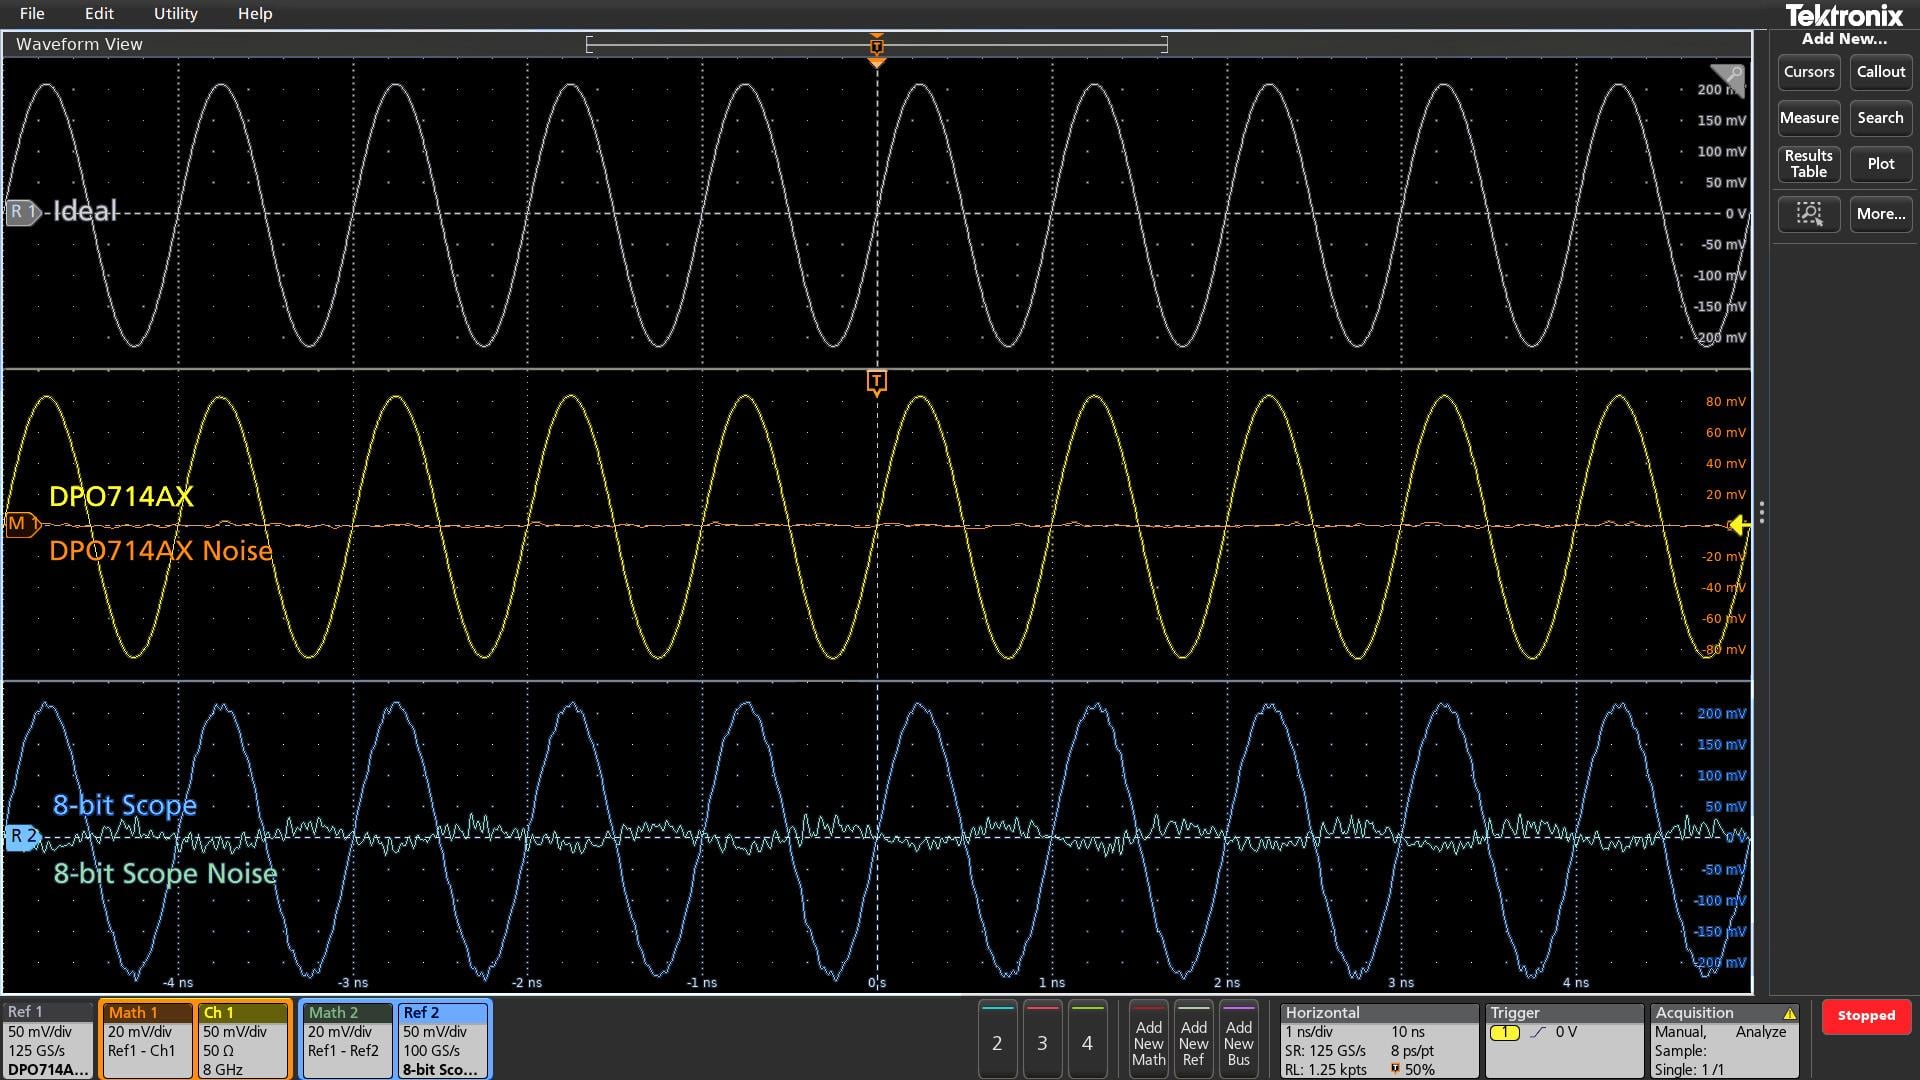
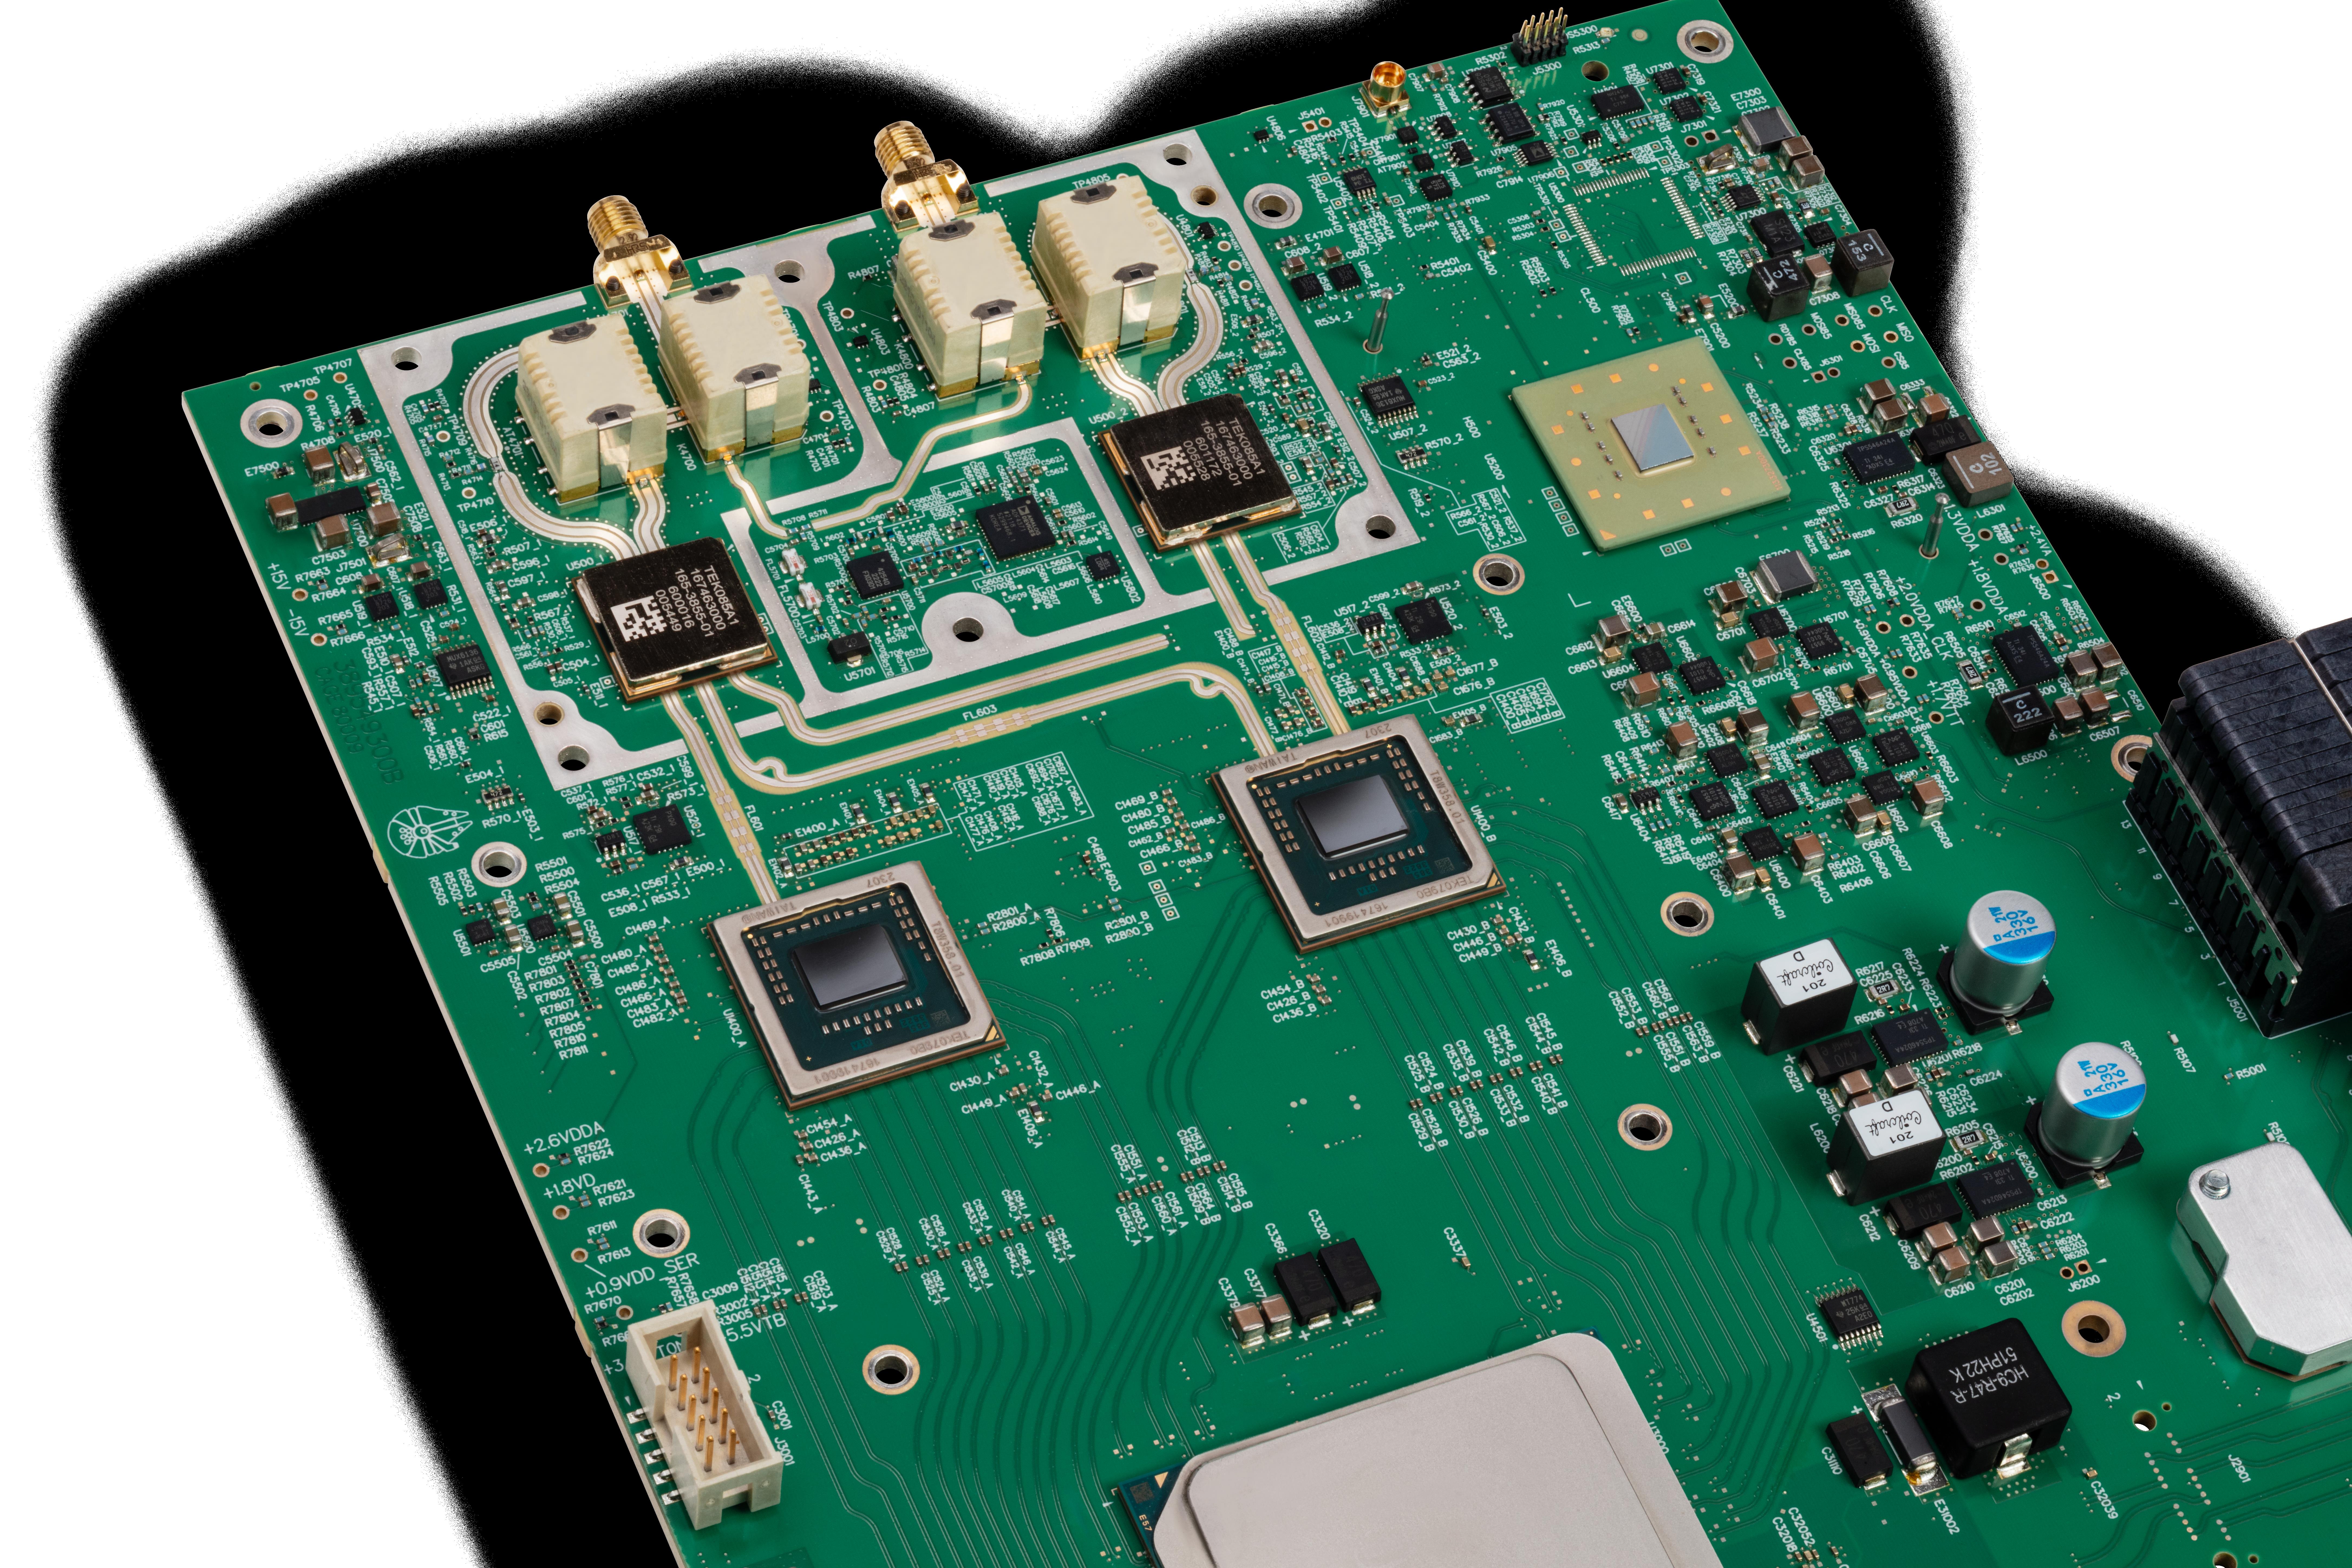
Maximize test margins with the low noise and high effective number of bits (ENOB) of the 7 Series DPO. Superior measurement accuracy, sensitivity and precision are enabled with our proprietary Tek85 low noise preamp, Tek79 12-bit ADC and advanced DSP algorithms providing more accurate capture and measurement of the signals of interest.
A practical way to demonstrate the innovation of the 7 Series DPO, especially in the effective number of bits (ENOB) and resultant signal-to-noise ratio (SNR), is to visually show the performance of the new signal path. In this image, the Gray Ref 1 waveform or “Ideal” signal at the top of the display is a sine wave that has been averaged 10,000 times to remove most of the random noise. The blue Ref 2 sine wave shown on the bottom of the display is a single-shot acquisition using a 25 GHz, 8-bit oscilloscope that was previously captured and imported into the 7 Series DPO as a reference waveform. Next, Math 2 was defined to be the Ideal or Ref 1 minus Ref 2 resulting in a residual or difference waveform from the 8-bit scope, indicated by the green Math 2 waveform on the bottom of the display. In a perfectly noiseless system, this would be a flat line. Then we acquire a single shot on Channel 1 of the 7 Series DPO. Performing the same calculation as before on Ref 1 – Ch 1 results in a residual or difference waveform from the 7 Series DPO, shown here as the orange Math 1 waveform in the middle of the display. It is very easy to see that this results in a substantially smaller deviation from the ideal waveform compared to the 8-bit oscilloscope, showing the superior performance of the new front-end design of the 7 Series DPO.
Highlights
Resolve and measure low amplitude signals with low noise
High Effective Number Of Bits (ENOB) enables high resolution signal digitization
QuietChannel
™ Technology further minimizes the noise from the oscilloscope signal pathFully automatic, built-in Signal Path Compensation (SPC) requires no user intervention to ensure optimal measurement accuracy by adjusting internal gain, offset, and frequency response to ensure precise signal capture and high effective number of bits (ENOB)
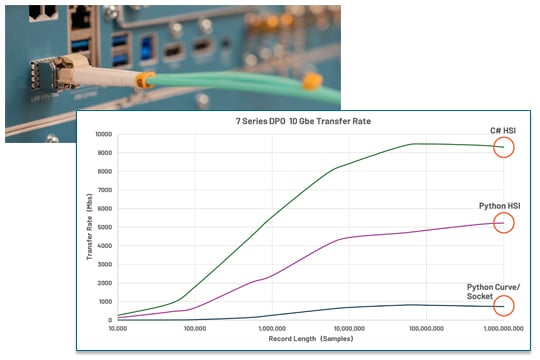
Minimize test times with 11x throughput
With the built-in 10G SFP+ port and the TekHSI
Highlights
TekHSI technology is based on gRPC low latency framework to enable fetch and streaming data transfer almost as fast as the physical bandwidth of the link; use with available C# and Python libraries
10G SFP+ port accepts choice of RJ-45 electrical, fiber optic, or direct attach transceiver modules
TekScope
™ PC natively supports the high-speed interface along with offline and remote oscilloscope-like analysis capabilities
Get to results faster with award-winning, intuitive User Interface
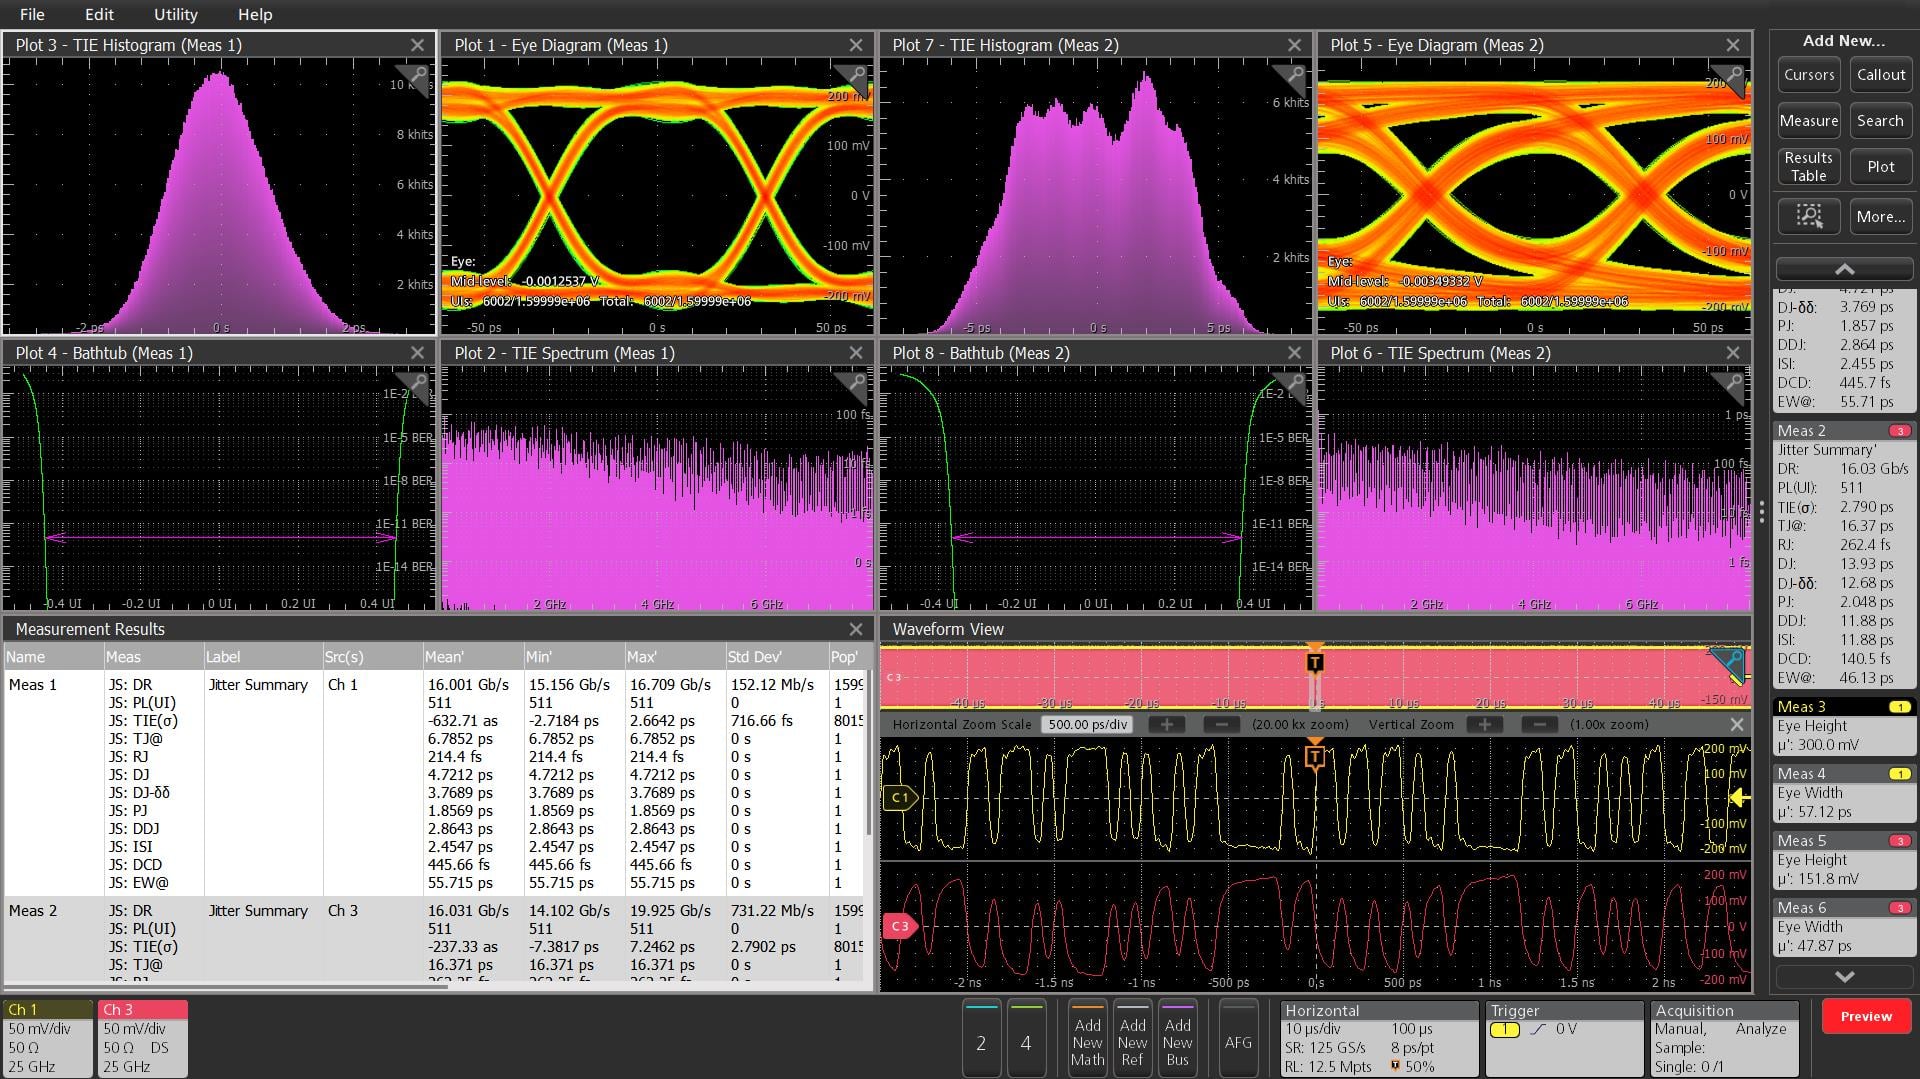
A 15.6-inch display, with full 1080p resolution, and an award-winning, intuitive user interface that works the way you expect and gets you to test results faster.
Highlights
Delightful user experience with the built for touch UI, and the same TekScope™ user interface found on the 2, 3, 4, 5 and 6 Series MSOs delivers quick insights
Streamlines complex tasks with well-organized menu structure with minimal layers to quickly navigate settings, setup the instrument, configure measurements, and effortlessly move through acquired data
Responsive touchscreen, optimized for multi-touch gestures, allows precise control over waveform analysis - quickly zoom into picosecond glitches or adjust measurement parameters for eye diagram analysis, ensuring accurate results
Easy one button Jitter Measurement Summary provides comprehensive data including key plots, diagrams and measurements quickly on one channel or multiple channels at the same time
Available with either embedded (Linux) or Windows OS
Advanced Research Applications
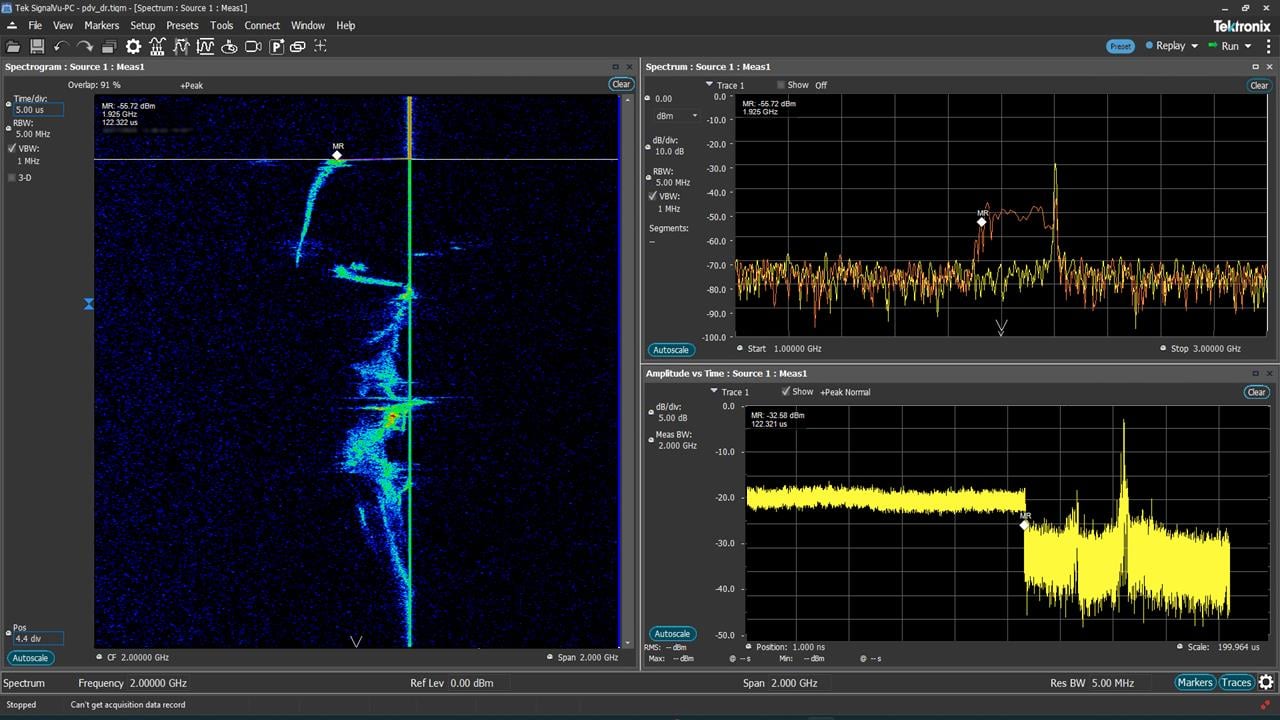
The ideal companion tool for high energy physics, particle accelerators, beam diagnostic instrumentation, astrophysics radio detection, plasma/fusion research, and more.
Highlights
125 GS/s sampling rates with low noise and high ENOB to ensure capture of fast transient events with high signal fidelity combined with deep record lengths up to 2G for long-duration signal capture
Precise channel-to-channel timing stability to ensure accurate multi-channel measurements
Transfer data up to 10x faster to an external computer using the high-speed interface and 10 Gbps SFP+ port. Data is immediately pushed to connected clients ensuring data is off-loaded as quickly as possible
Tightly synchronize the 7 Series DPO with other equipment using the oscilloscope’s low-latency (<20 ns) trigger in-to-out capability
SignalVu-PC's spectrograms, spectra and amplitude quickly provide other views of critical experiment data for specific applications such as PDV and others
High Speed Serial Compliance Testing and Debug
Test to current and emerging standards and reduce your time to market.
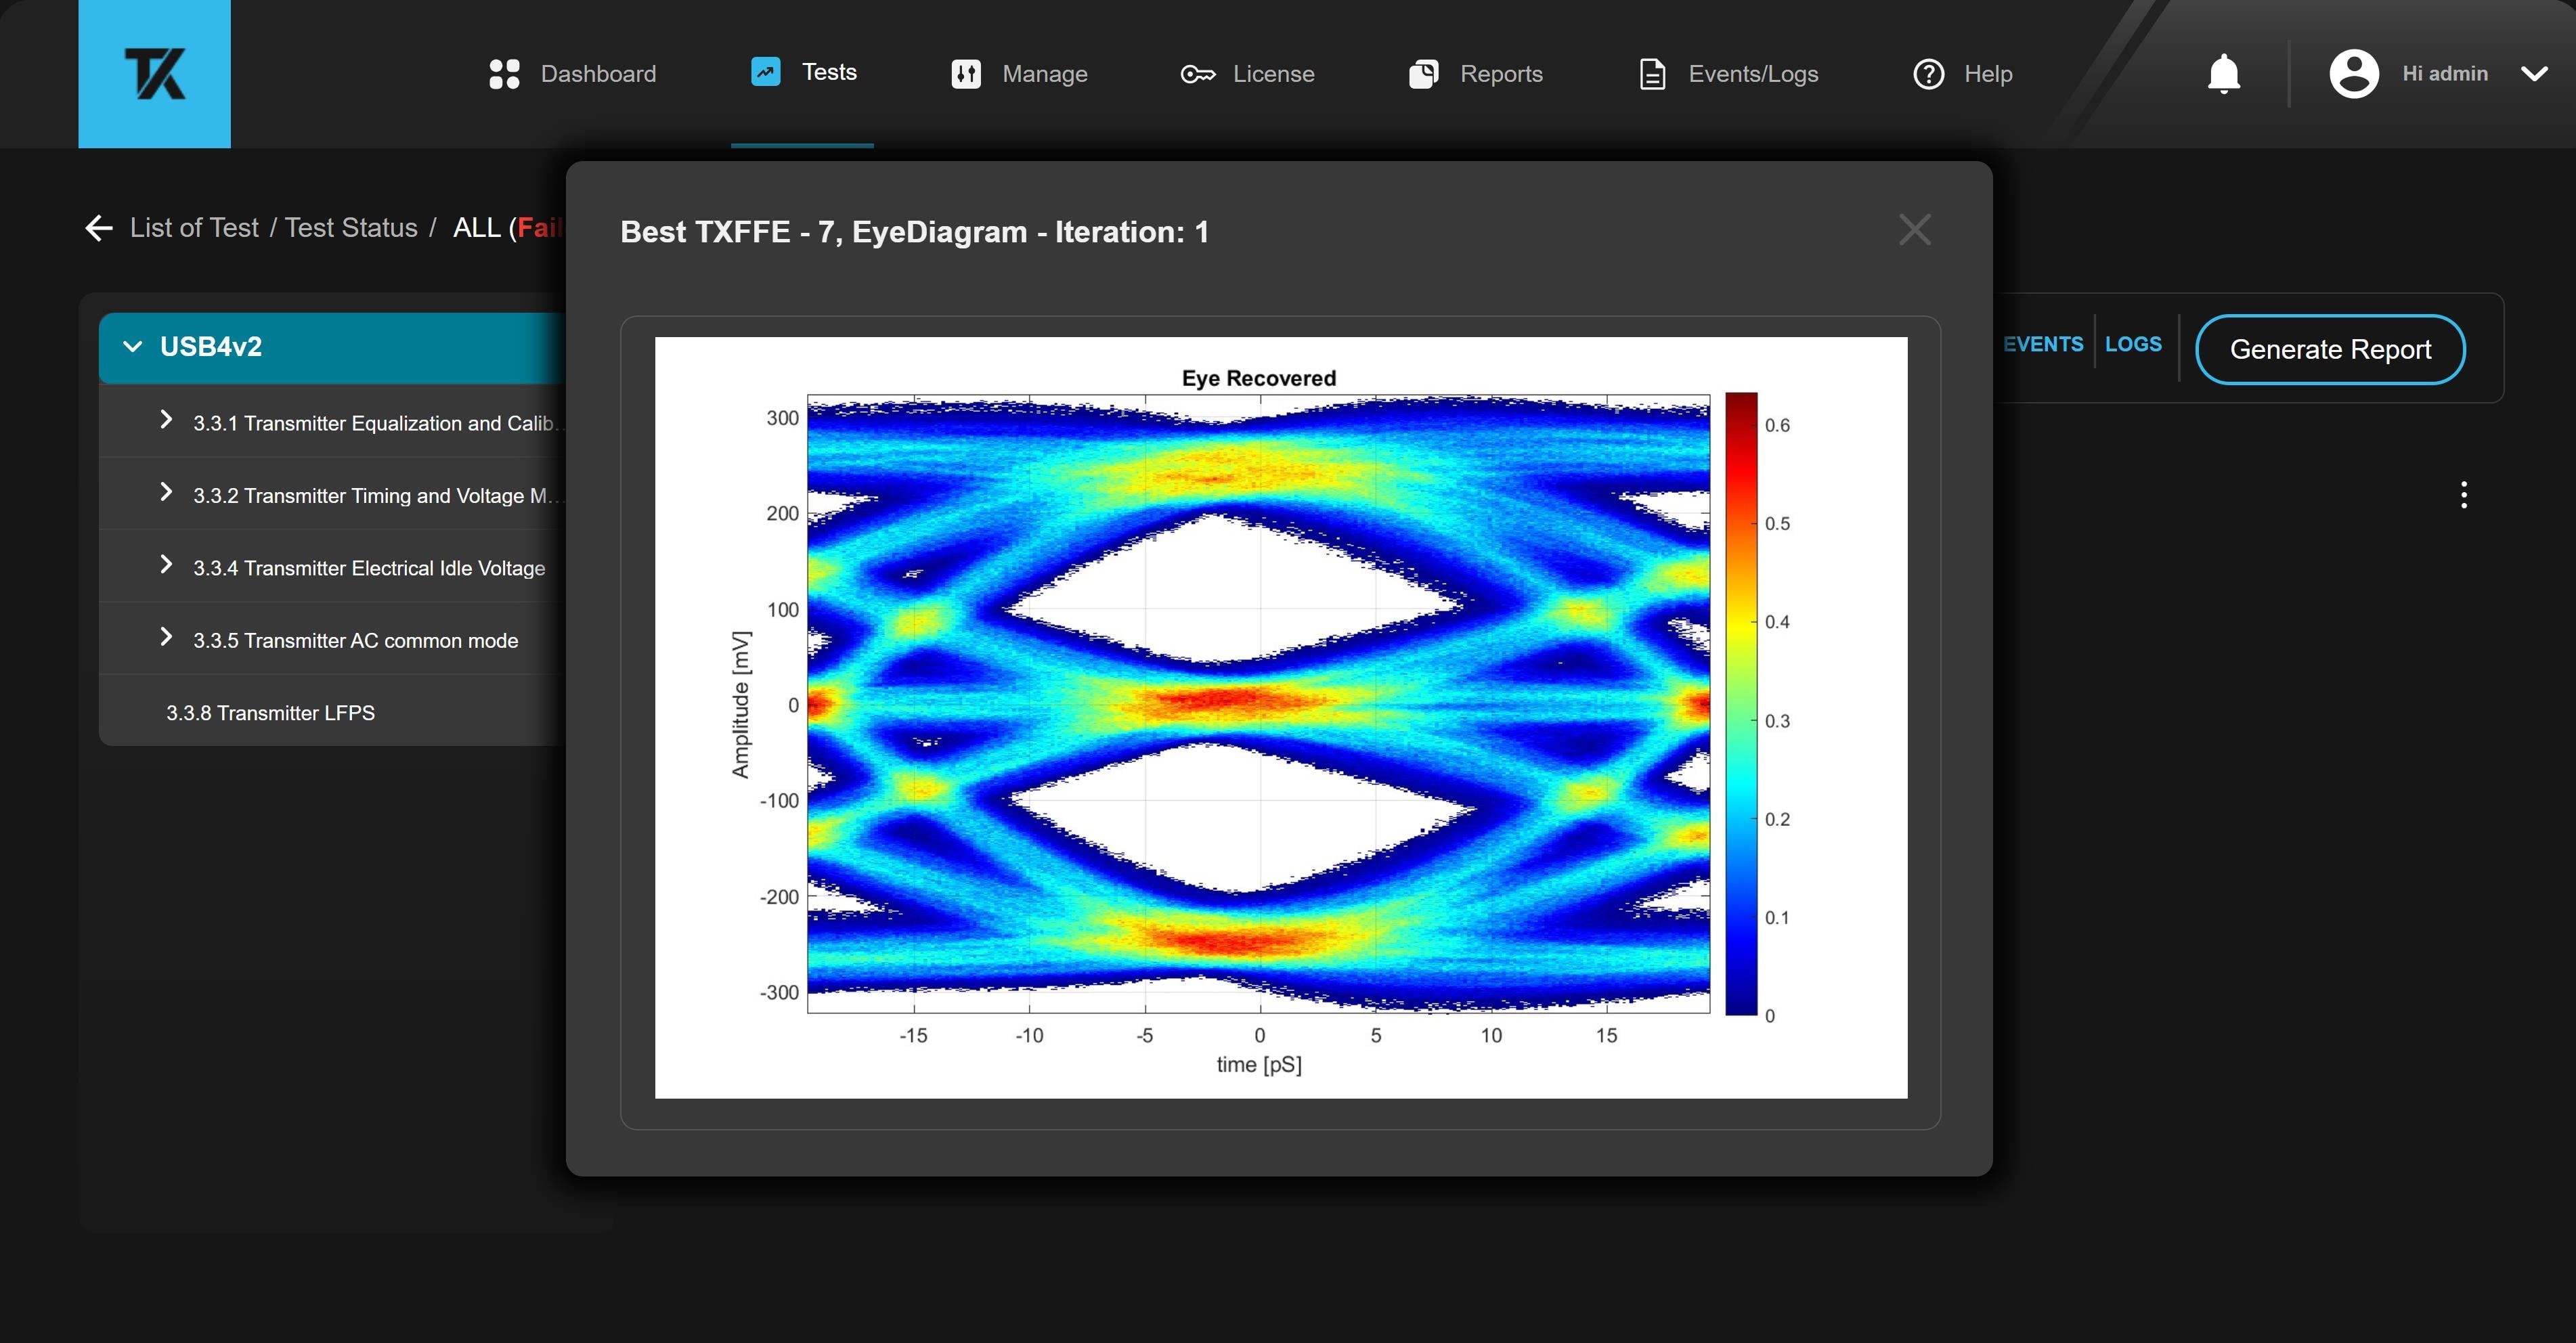
Automated compliance testing software manages the whole testing process – set-up, making measurements, checking against limits, and generating detailed reports.
Highlights
Save time with fast automated compliance testing software (various options) for PCIe, USB, DisplayPort, HDMI, DDR, LPDDR and MIPI
Gain enhanced insight with comprehensive Jitter and Eye-Diagram Analysis (option DJA) featuring detailed jitter breakdown, unmatched flexibility, and visualization
Maximize test margins with the low noise and low intrinsic jitter
Reveal true DUT behavior with de-embedding, embedding, and equalization using Signal Integrity Modeling software (option SIM)
Wideband Radio Frequency Systems
With its low noise and flat frequency response, the 7 Series DPO can perform the measurement and analysis of wideband RF signals in electronic warfare, spectrum monitoring, SIGINT, 5G networks, mmWave RF bands, and Ultra-wideband (UWB) communications applications and more. Gather data faster for wideband RF research with ultra-wide bandwidths, easier signal connectivity and the flexibility to perform online and offline analysis of RF signal behavior.
Highlights
A 4 channel, 25 GHz bandwidth multi-channel, multi-domain Vector Signal Analysis (VSA) solution when paired with SignalVu-PC software
Enables in-depth transient RF signal analysis, detailed RF pulse characterization, and comprehensive analog and digital RF modulation analysis
Simultaneously acquire, independently configure settings on each channel and analyze signals on all channels
Time-correlated measurements between channels can be made across the frequency, phase, amplitude, and modulation domains
Experience the performance difference
With up to 25 GHz analog bandwidth, 125 GS/s sample rates, standard 500 Mpts record length and a low-noise, 12-bit analog to digital converter (ADC) signal path, the 7 Series DPO has the performance you need to capture waveforms with the best possible signal fidelity and resolution for seeing small waveform details.
Industry leading vertical resolution and low noise
The 7 Series DPO provides the performance to capture the signals of interest while minimizing the effects of unwanted noise when you need to capture high-amplitude signals while seeing smaller signal details. At the heart of the instrument are precision 12-bit analog-to-digital converters (ADCs) that provide 16 times the vertical resolution of traditional 8-bit ADCs.
QuietChannel™ technology
Active devices in oscilloscopes add noise to the measured signal. The added noise is amplified by compensation for loss in the scope and DUT:
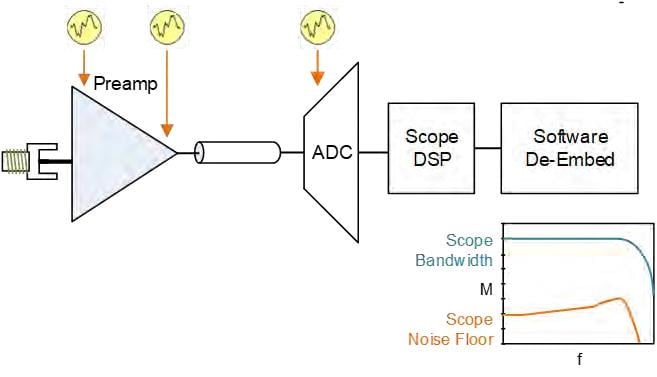
QuietChannel
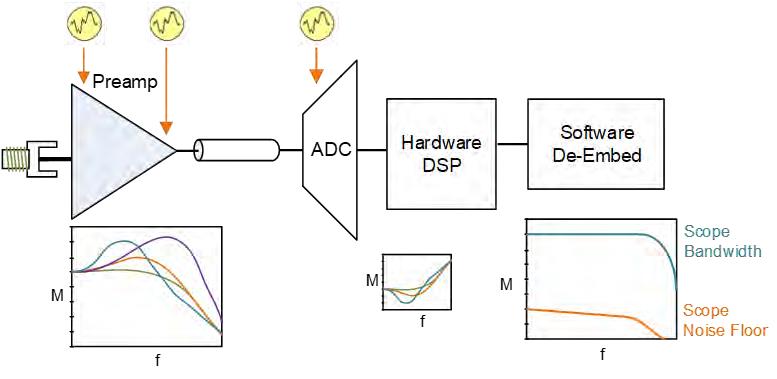
The 7 Series DPO has seven QuietChannel
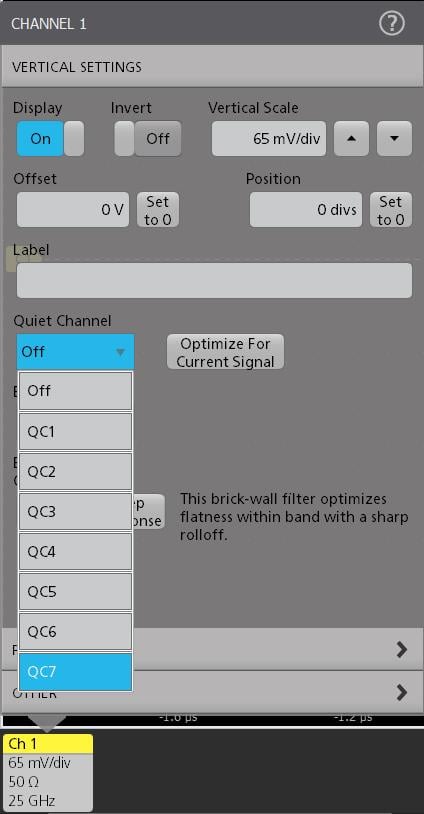
Using QuietChannel
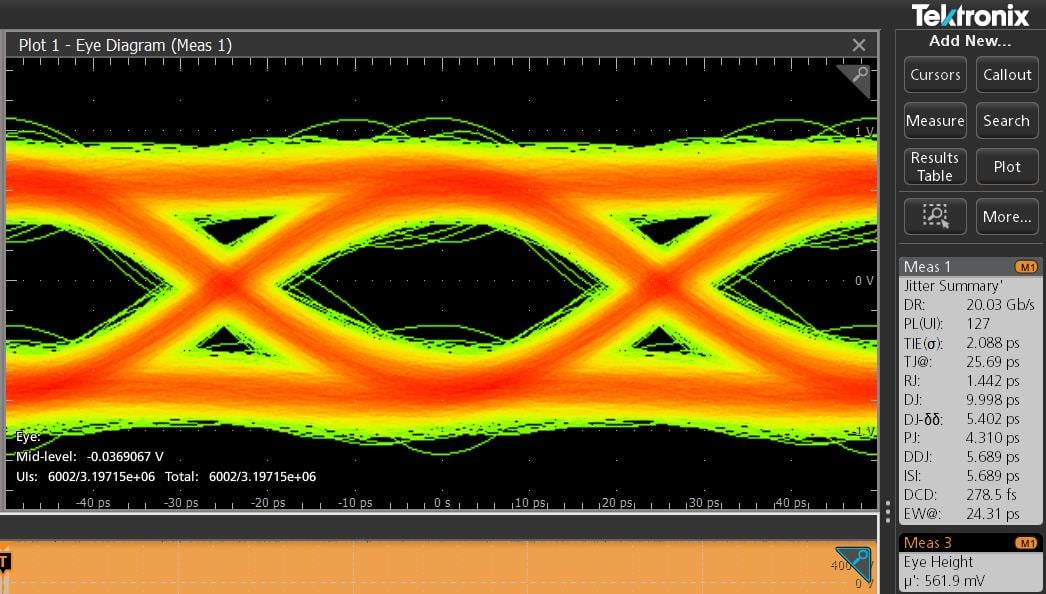
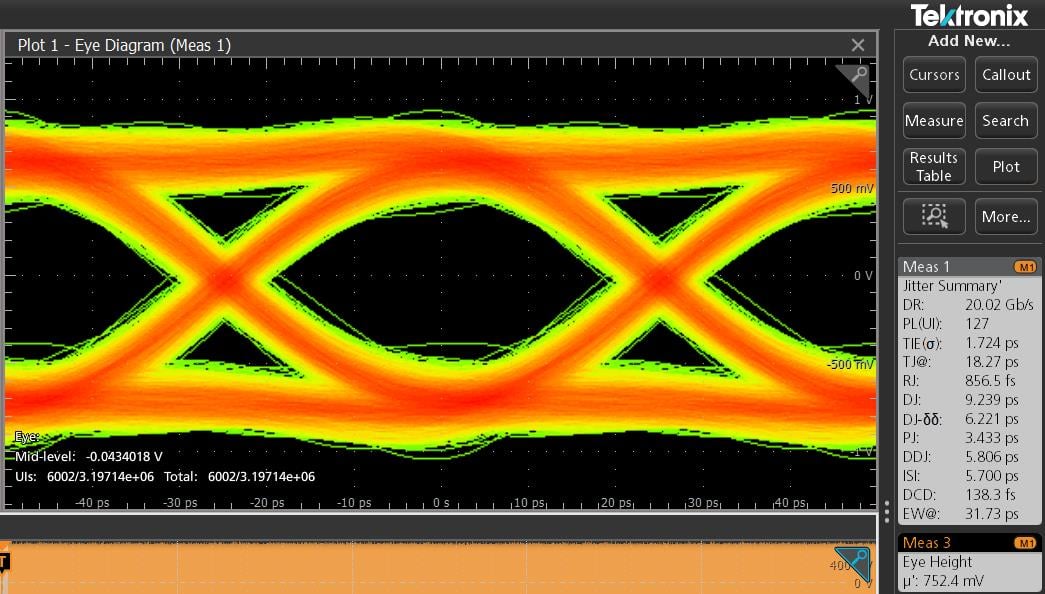
Pinpoint® digital triggering to full bandwidth - Ultimate flexibility with Sequential AB Triggering
Whether you're trying to find a problem signal or need to isolate a section of a complex signal for further analysis, Tektronix Pinpoint® digital triggering to the full bandwidth of the instrument provides the solution.
Discovering a device fault is only the first step. Next, you must capture the event of interest to identify root cause. The 7 Series DPO provides a complete set of advanced triggers, including:
Edge
Pulse width
Timeout
Runt
Window
Cycle
Rise / Fall Time
Visual Trigger
With up to a 2 Gpoint record length and up to 25 GHz trigger bandwidth on all trigger types, not just edge triggers, you can capture many events of interest, even thousands of serial packets in a single acquisition, providing high-resolution to zoom in on fine signal details and record reliable measurements.
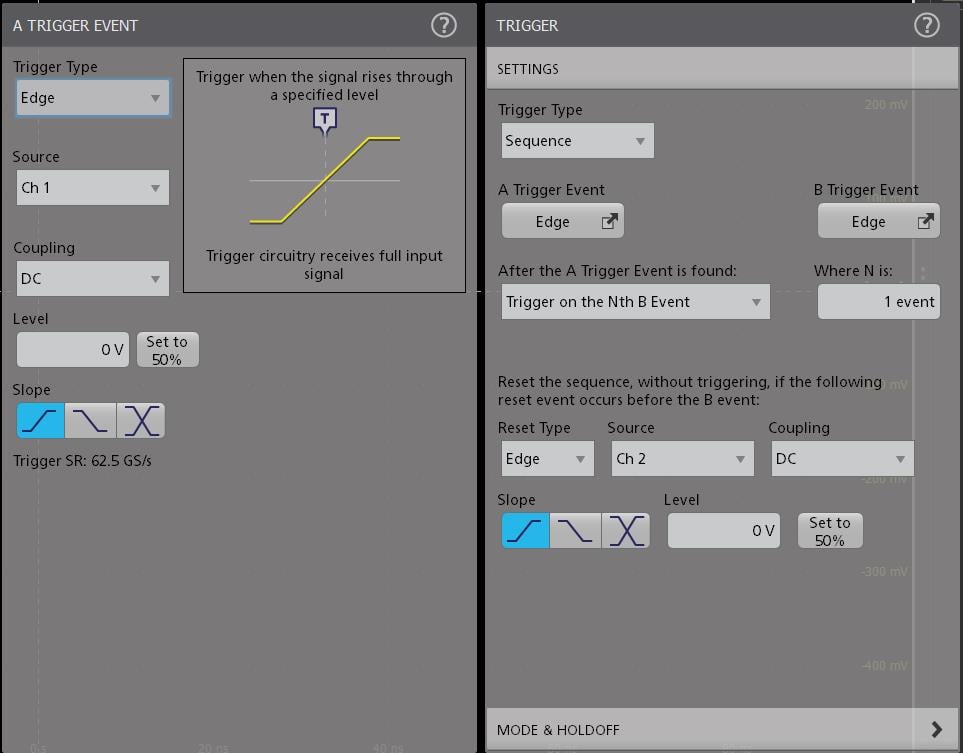
Pinpoint
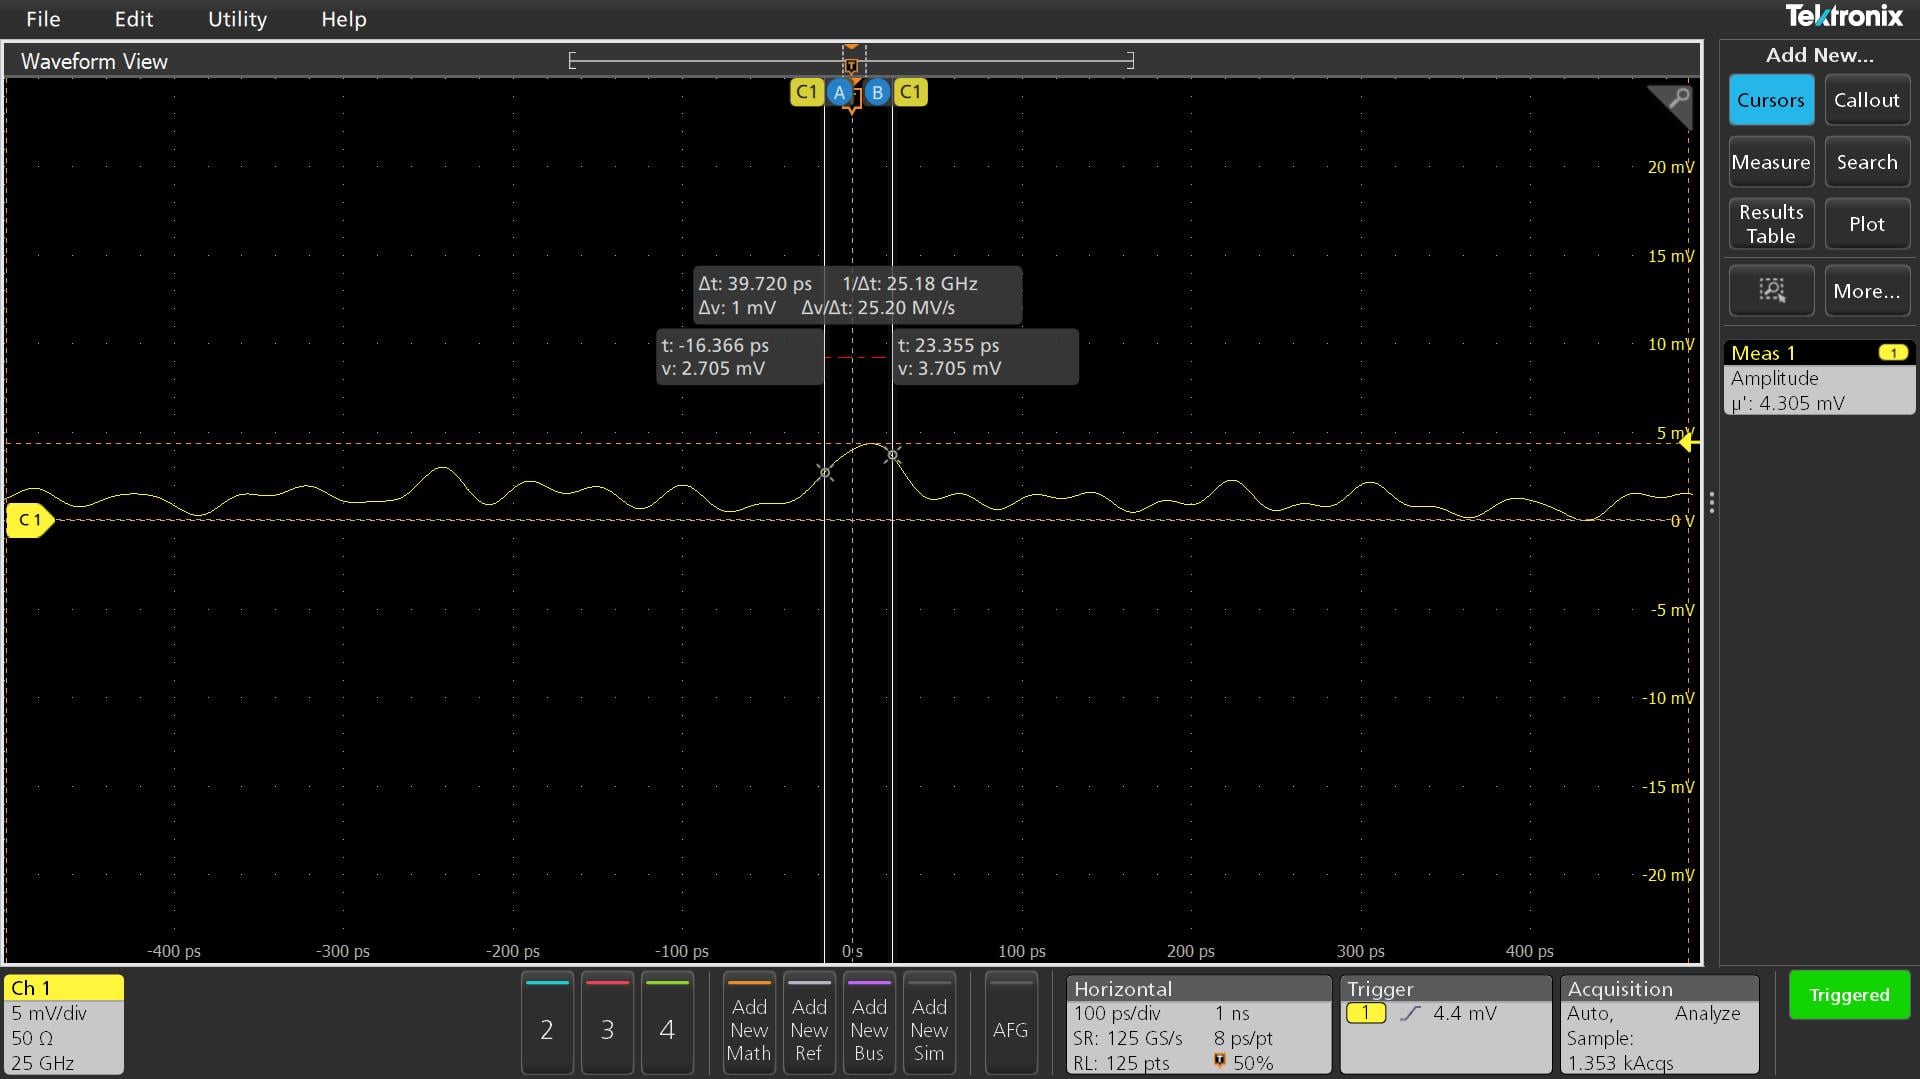
With the 7 Series DPO’s enhanced triggering capability, trigger jitter is reduced to <10 fs. With this stability at the trigger point, the trigger point can be used as a measurement reference.
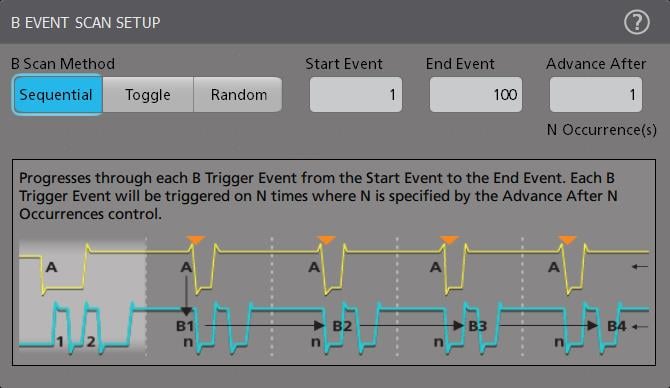
B scan event trigger
Users who wish to create eye diagrams from data bursts synchronized or initiated by an A event will find the B Event Scan trigger function especially useful. B Event Scan is an A to B trigger sequence that will trigger and capture burst event data of interest defined by the B Event setup menu. Captured bits can be scanned in a sequential or randomized fashion, alternatively the trigger can toggle between two successive B trigger events.
Low-latency trigger mode
While there are many advantages to these advanced or digital triggers that operate at the full acquisition analog bandwidth, one drawback is the latency or time it takes for an event to propagate from the input channel and/or Aux In on the front of the oscilloscope to the Aux Out connector on the rear of the oscilloscope. This latency can often exceed 1 μS. For many applications, this is not an issue, but for certain applications where cross-triggering other instrumentation within tens of nanoseconds of the event appearing at the input channel and/or Aux In on the front is a requirement which digital triggers cannot satisfy. Fortunately, the 7 Series DPO contains a low-latency trigger mode for Channel 1 and/or Aux In which has a delay of < 20 ns.
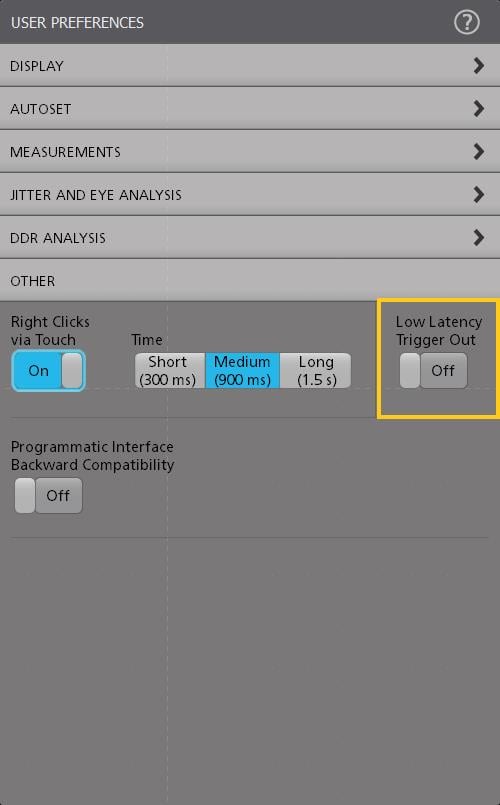
The low-latency trigger mode for Channel 1 and/or Aux In is available in the User Preferences menu with a message in the trigger menu that it is active.
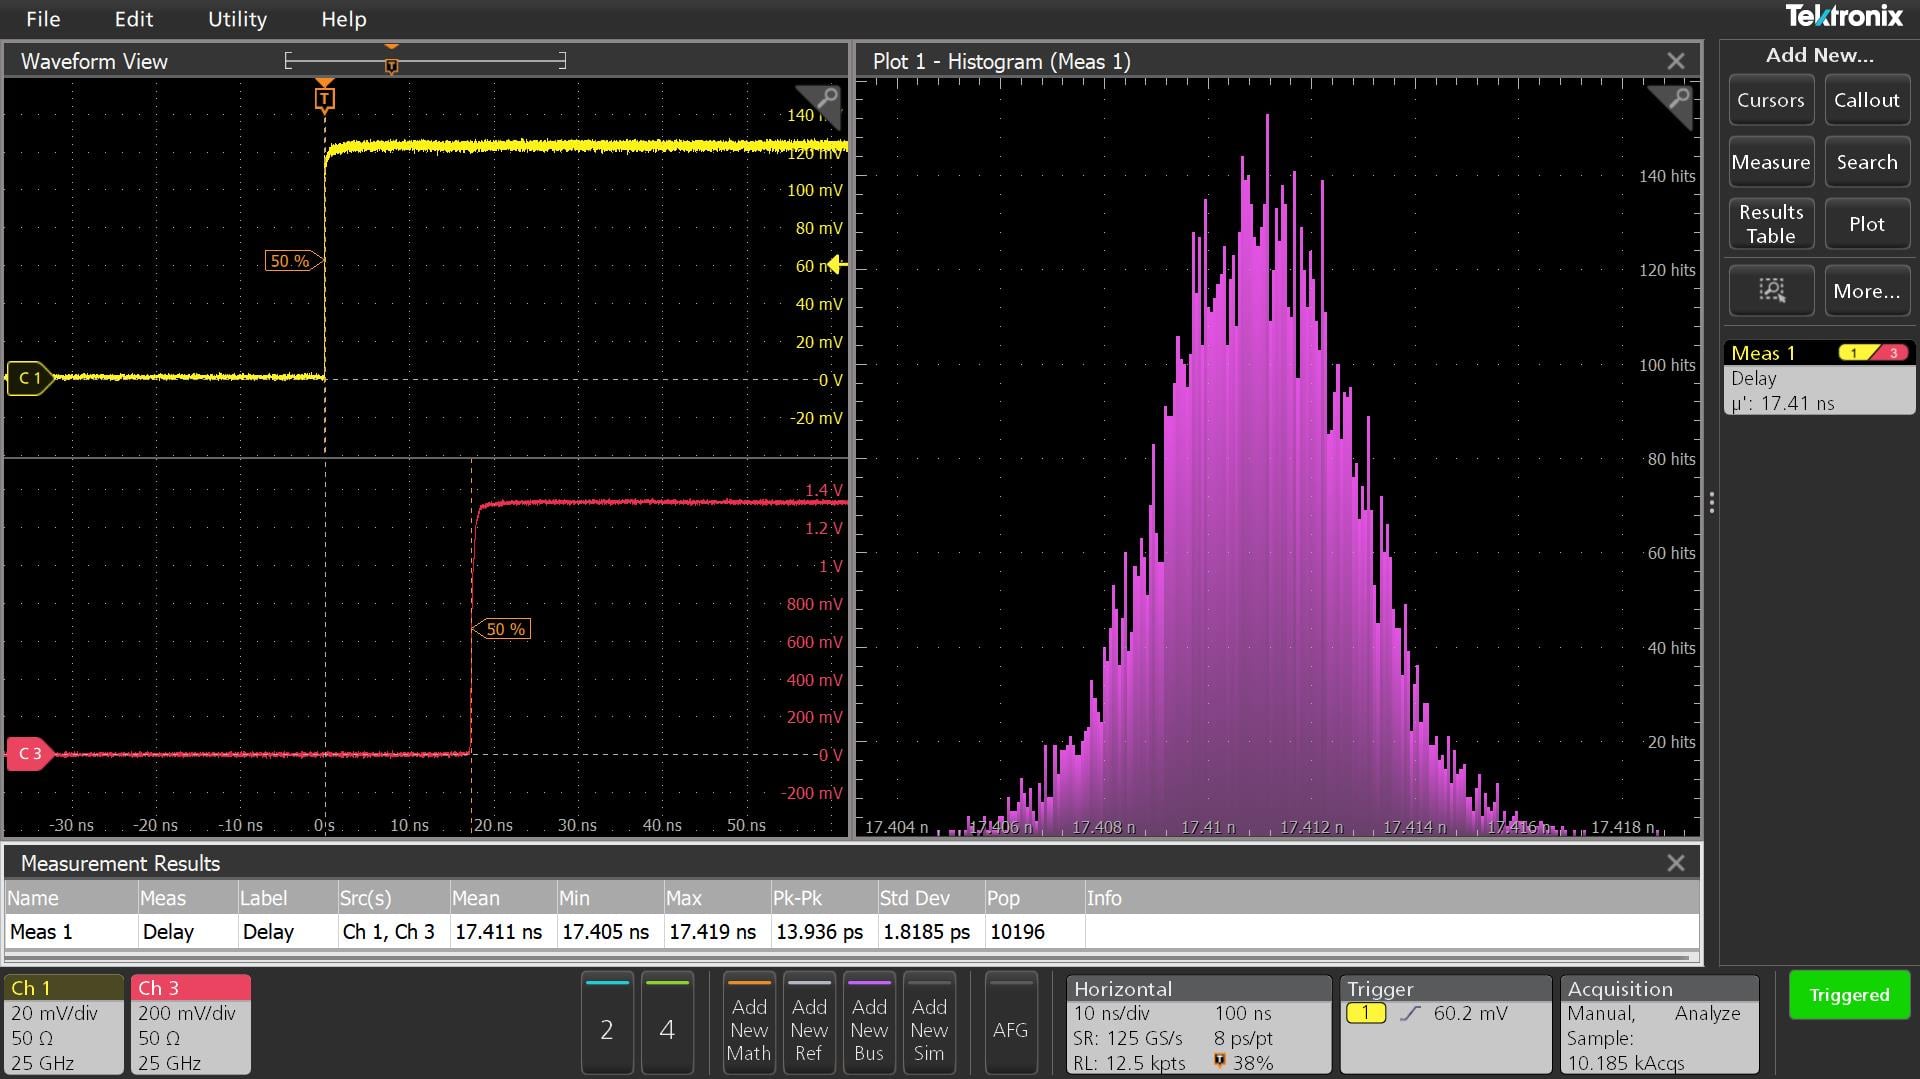
Visual trigger - Finding the signal of interest quickly
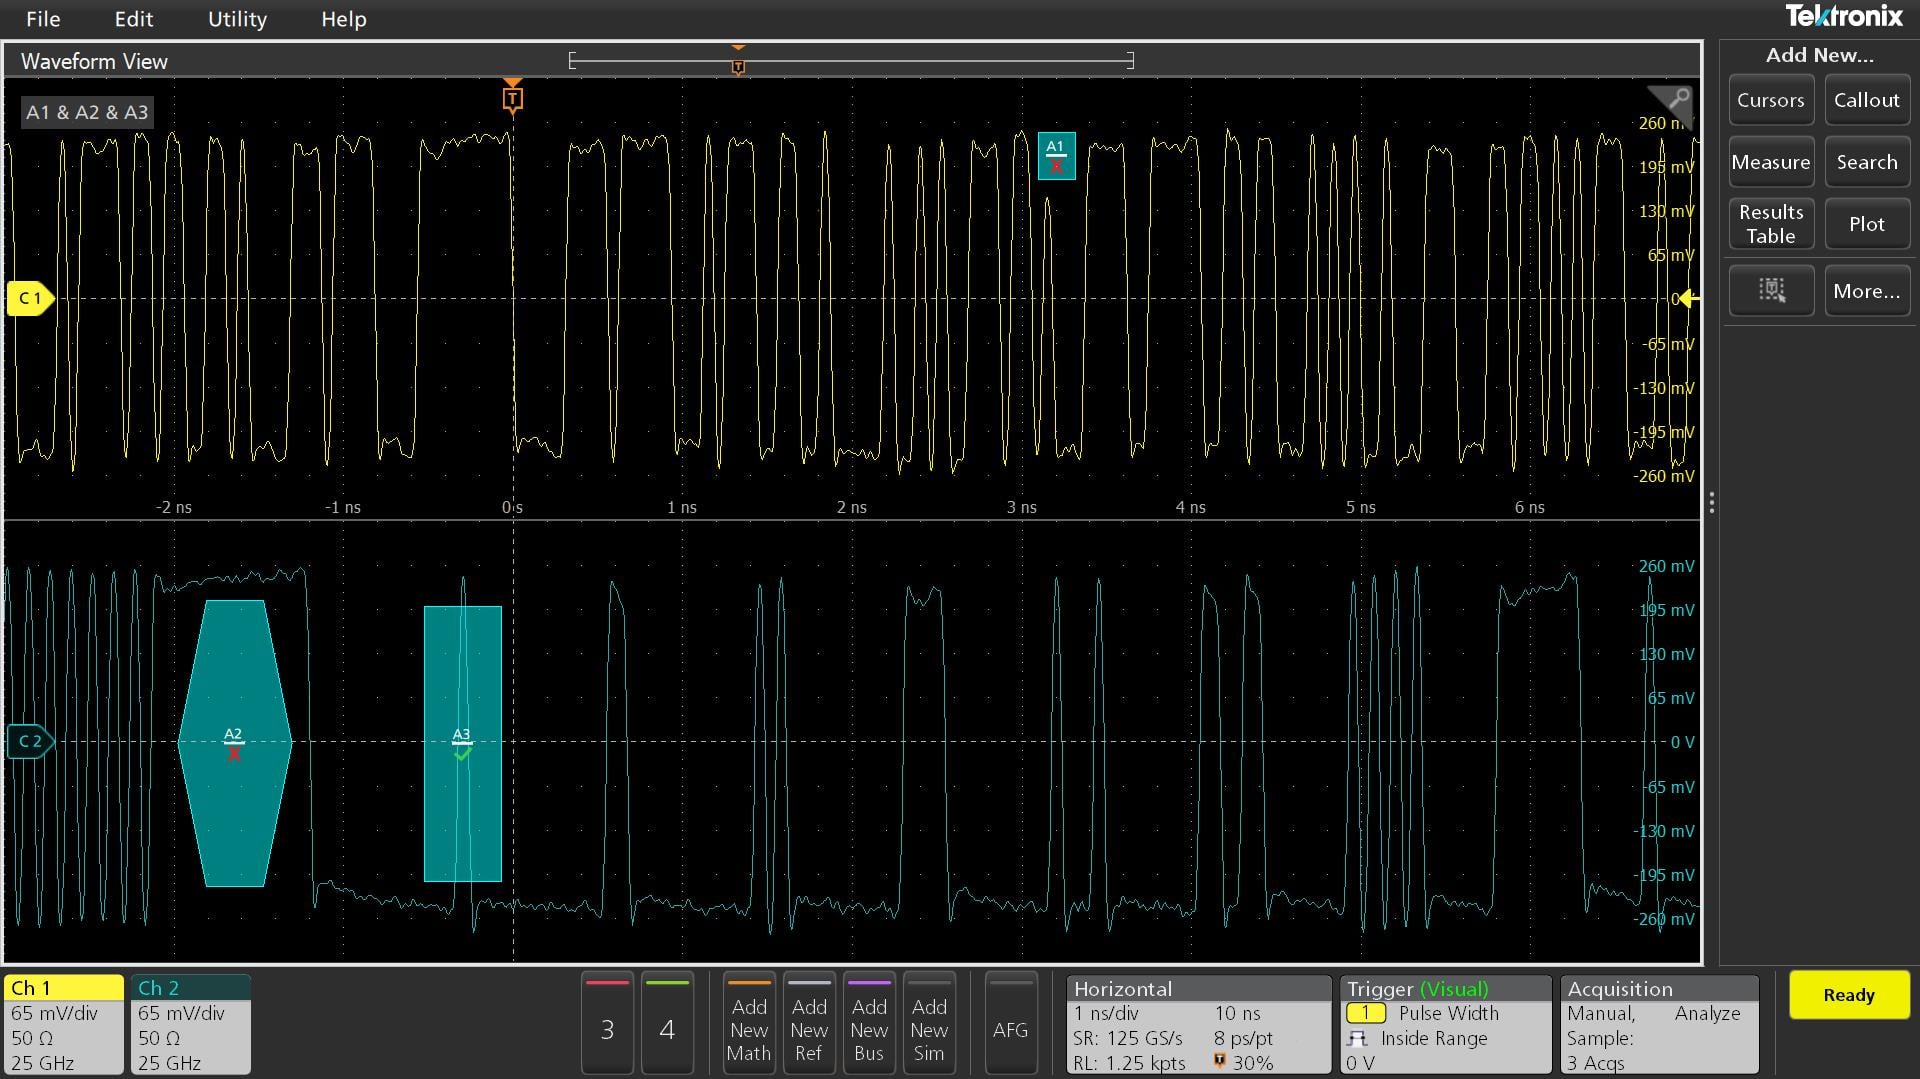
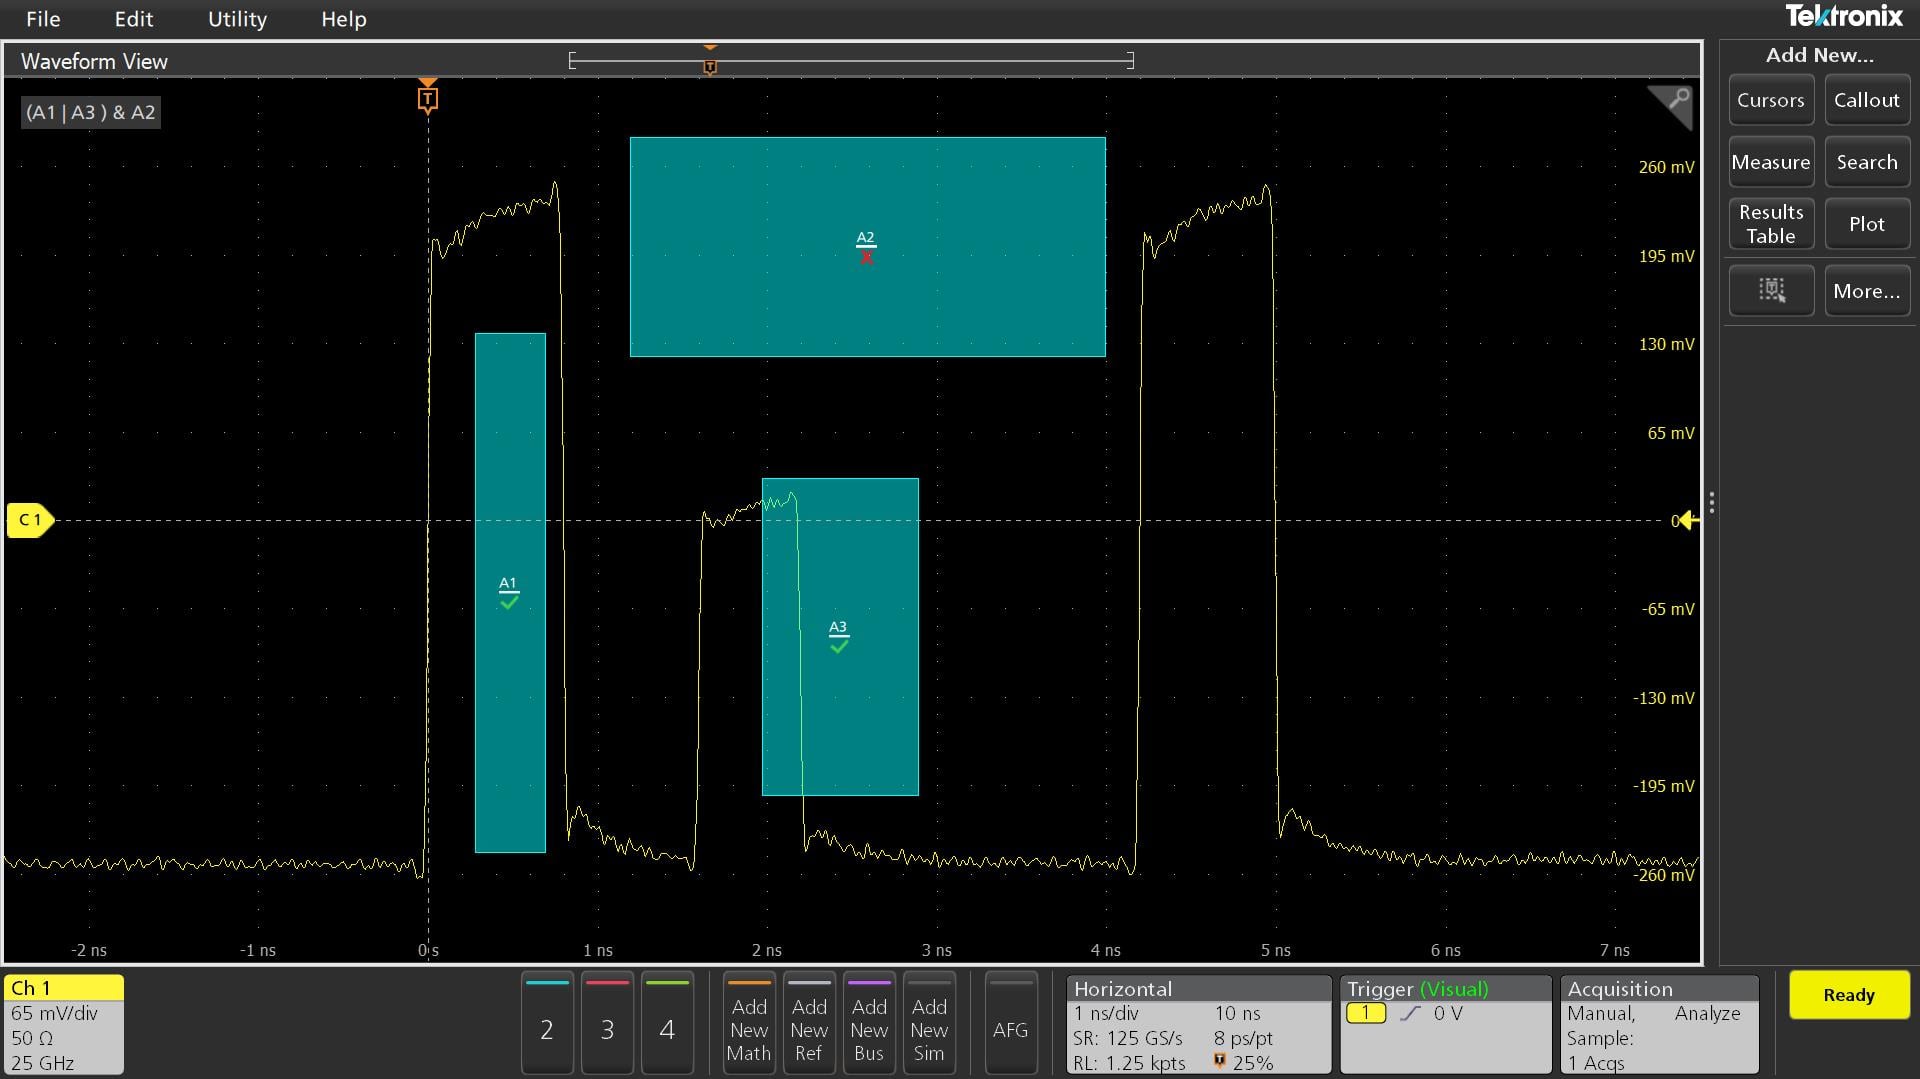
Finding the right cycle of a complex bus can require hours of collecting and sorting through thousands of acquisitions for an event of interest. Defining a trigger that isolates the desired event speeds up debug and analysis efforts.
Visual Trigger extends the 7 Series Pinpoint
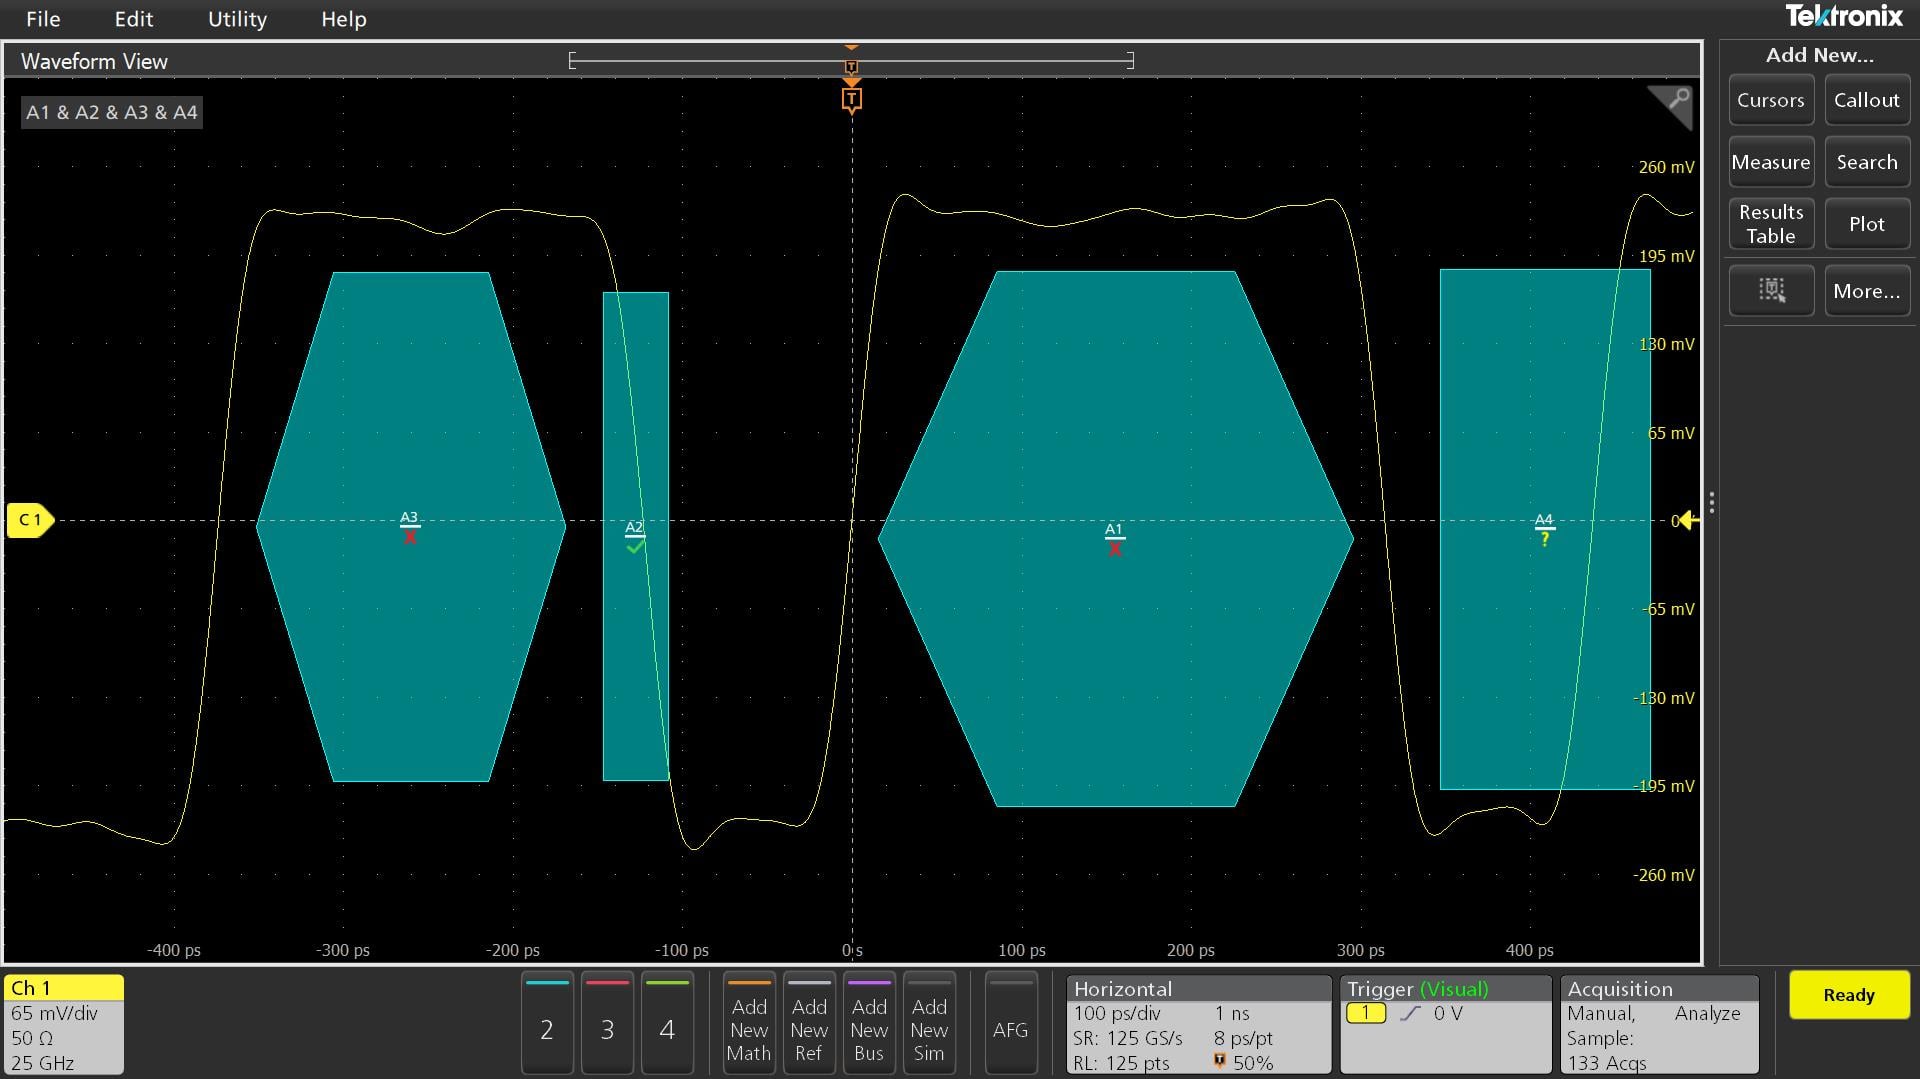
By triggering only on the most important signal events, Visual Trigger can save hours of capturing and manually searching through acquisitions. In seconds or minutes, you can find the critical events and complete your debug and analysis efforts. Visual Trigger even works across multiple channels, extending its usefulness to complex system troubleshooting and debug tasks.
26.6 Gbps Error Detector for Bit Error Rate (BER) Testing
Bit Error Rate (BER) testing is a technique used to evaluate the reliability of a digital communication link by measuring how many bits are received incorrectly compared to the total number of bits transmitted.
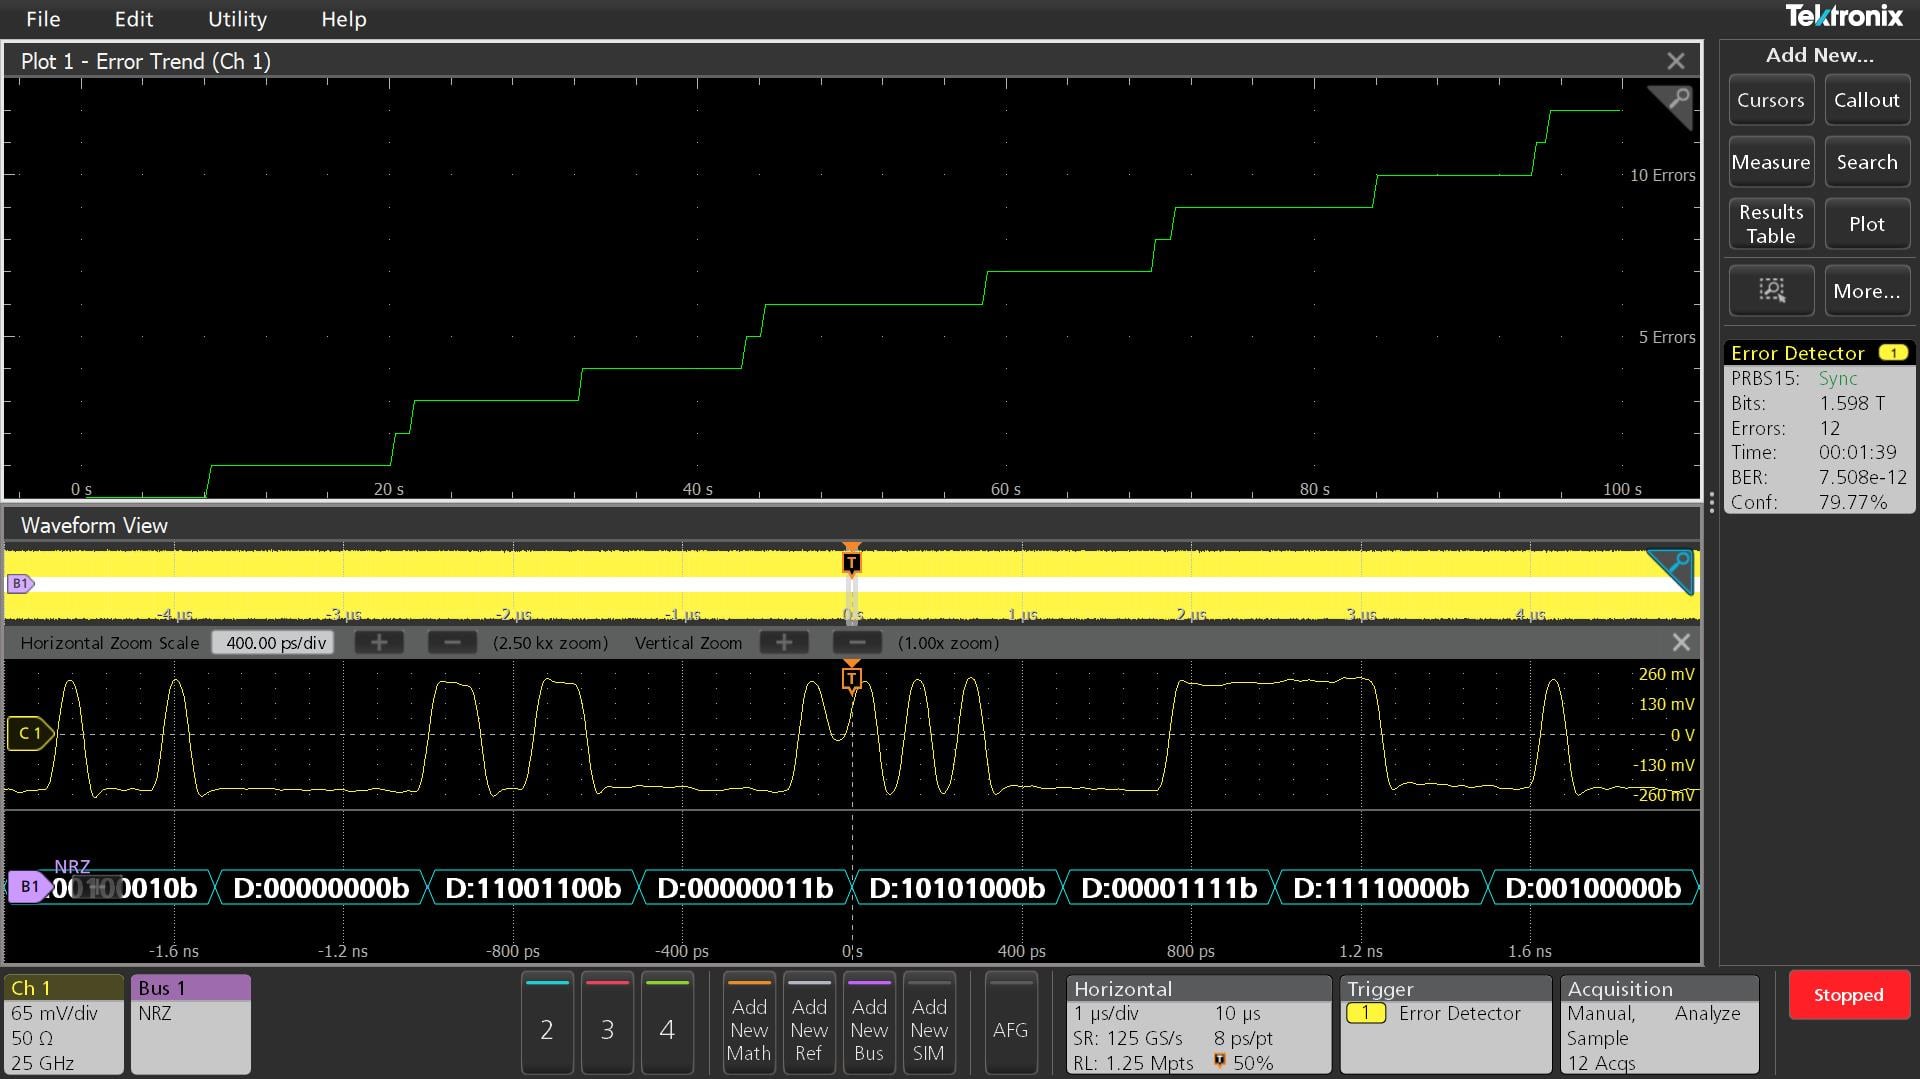
During a BER test, a known data pattern, often a pseudorandom binary sequence (PRBS), is transmitted through a device or communication channel and compared against the expected pattern at the receiver. The key component in this process is the Error Detector, which continuously recovers the data clock, aligns itself to the expected pattern, and performs a bit-by-bit comparison of every incoming bit. When a mismatch is detected, the Error Detector records an error and updates statistics such as the total bits tested, error count, and calculated BER. Hardware-based Error Detectors are particularly valuable because they analyze every transmitted bit in real time and can operate for extended periods to measure very low error rates, allowing engineers to verify receiver performance, quantify signal integrity margins, and capture waveforms associated with rare bit errors for root-cause analysis.
The Error Detector feature allows for high-speed serial bit error detection and requires options 7-ERRDET and 7-ST1. The Error Detector allows you to trigger on NRZ bit streams with data rates between 1 Gbps and 26.6 Gbps. This simple detector uses the high-speed serial trigger system hardware to detect bit errors on a repeating pattern being sent by a serial transmitter. A bit pattern file is used to define the expected incoming pattern. Many common PRBS patterns are predefined and available from the Pattern Selection drop-down, but you can also create your own unique bit pattern files.
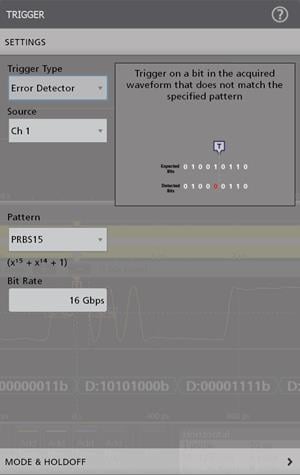
When a bit error is detected, the oscilloscope triggers a waveform acquisition, resulting in a capture of the waveform containing the bit error. The bit error that triggered the acquisitions will be aligned with the trigger position indicator within the waveform graticule. If the oscilloscope also has an optional serial decoder for the serial data stream being tested (for example, 8b10b), the acquired waveform can include decoded data, making analysis and debug of bit errors easier. You can view statistics on bits counted and number of errors detected, as well as see waveform data upon detection of a bit error.
NOTE: This error detector is not protocol aware and does not detect frame/symbol/character errors.
Digital Phosphor Oscilloscope (DPO) technology with FastAcq™— Expedites debugging by displaying elusive events that threaten stable system operation
FastAcq™ captures signals at up to 150,000 waveforms per second on all TekConnect® channels simultaneously, dramatically increasing the probability of discovering infrequent fault events. And with a simple turn of the intensity knob you can clearly "see a world others don't see", displaying the complete picture of your circuit's operation. Once you can see the elusive event, you can construct a trigger to capture and analyze the characteristics.
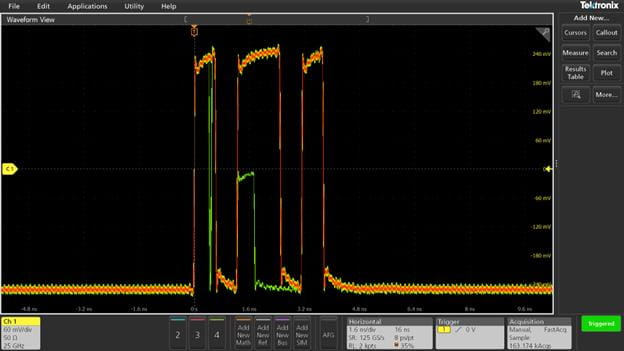
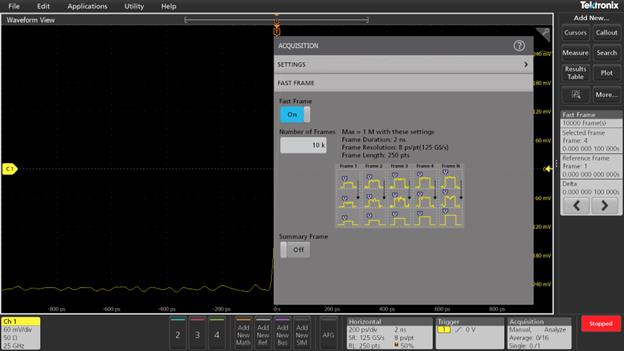
FastFrame™ captures widely spaced events at maximum resolution plus fast averaging to increase SNR (Signal-to-Noise Ratio)
When the key events you are interested in are widely spaced in time, such as bursts of activity on a bus, the FastFrame segmented memory feature on the 7 Series enables you to capture the events of interest while conserving acquisition memory. Using multiple trigger events, FastFrame captures and stores short bursts of signals and saves them as frames for later viewing and analysis. Capturing thousands of frames is possible, so long-term trends and changes in the bursting signal can be analyzed. FastFrame also minimizes trigger re-arm time, allowing for acquisition of events that are very closely spaced in time. Using this feature, it is possible to reliably trigger on and acquire signals that are spaced as tightly as 33 ns, providing a maximum trigger rate >30 million waveforms per second.
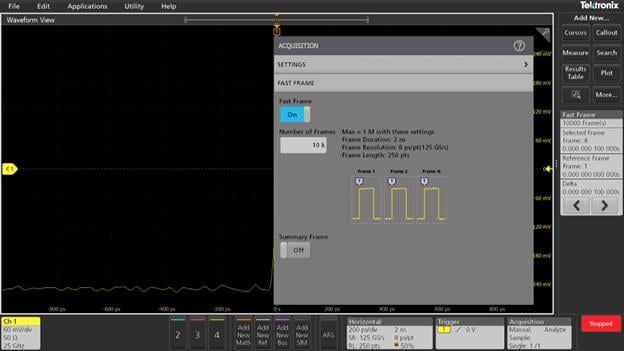
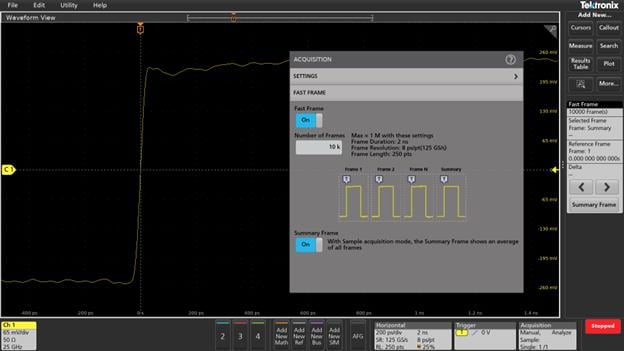
Extended features that are part of FastFrame include the ability to very efficiently calculate a point-point average of all frames to a single waveform (summary frame average). In addition, it is possible to perform an orthogonal average, whereby multiple sets of frames can be acquired. In this mode, each #1 frame is averaged on a point-by-point basis with all other #1 frames, each #2 frame is averaged on a point-by-point basis with all other #2 frames, and so on up to the total number of frames specified (orthogonal frame average). This feature provides a very efficient way to extend the dynamic range of the oscilloscope while acquiring repeatable sequences of events.
FastFrame
Average Summary Frame: Frames will be averaged together horizontally from Frame 1 through Frame N to produce a Summary Frame at the end of the Frame Set.
Orthogonal FastFrame Averaging: Frame averaging is performed vertically with Frame 1 of the Frame Set being averaged with Frame 1 of the next Frame set, Frame 2 with Frame 2 continuing all the way to Frame N. As each Frame Set is acquired, the acquisition count that makes up the average waveform contained within each frame increases by one. This results in a final Frame Set where each frame contains averaged waveform data. This differs from the Average Summary Frame, where only the Summary Frame contains average waveform data. Orthogonal Fast Frame Averaging is useful for acquiring repeatable, multi-step processes where averaging is required to get a higher signal-to-noise ratio (SNR).
Figure 2. FastFrame™ with Summary Frame AveragingFigure 3. FastFrame™ with Orthogonal Frame Averaging
Unprecedented signal viewing capability
Leveraging the same user interface from our 2 Series through 6 Series B, the stunning 15.6 inch (396 mm) display with full HD resolution (1,920 x 1,080), enables you to see many signals at once with ample room for critical readouts and analysis.
The viewing area is optimized to ensure that the maximum vertical space is available for waveforms. The Results Bar on the right can be hidden, enabling the waveform view to use the full width of the display.
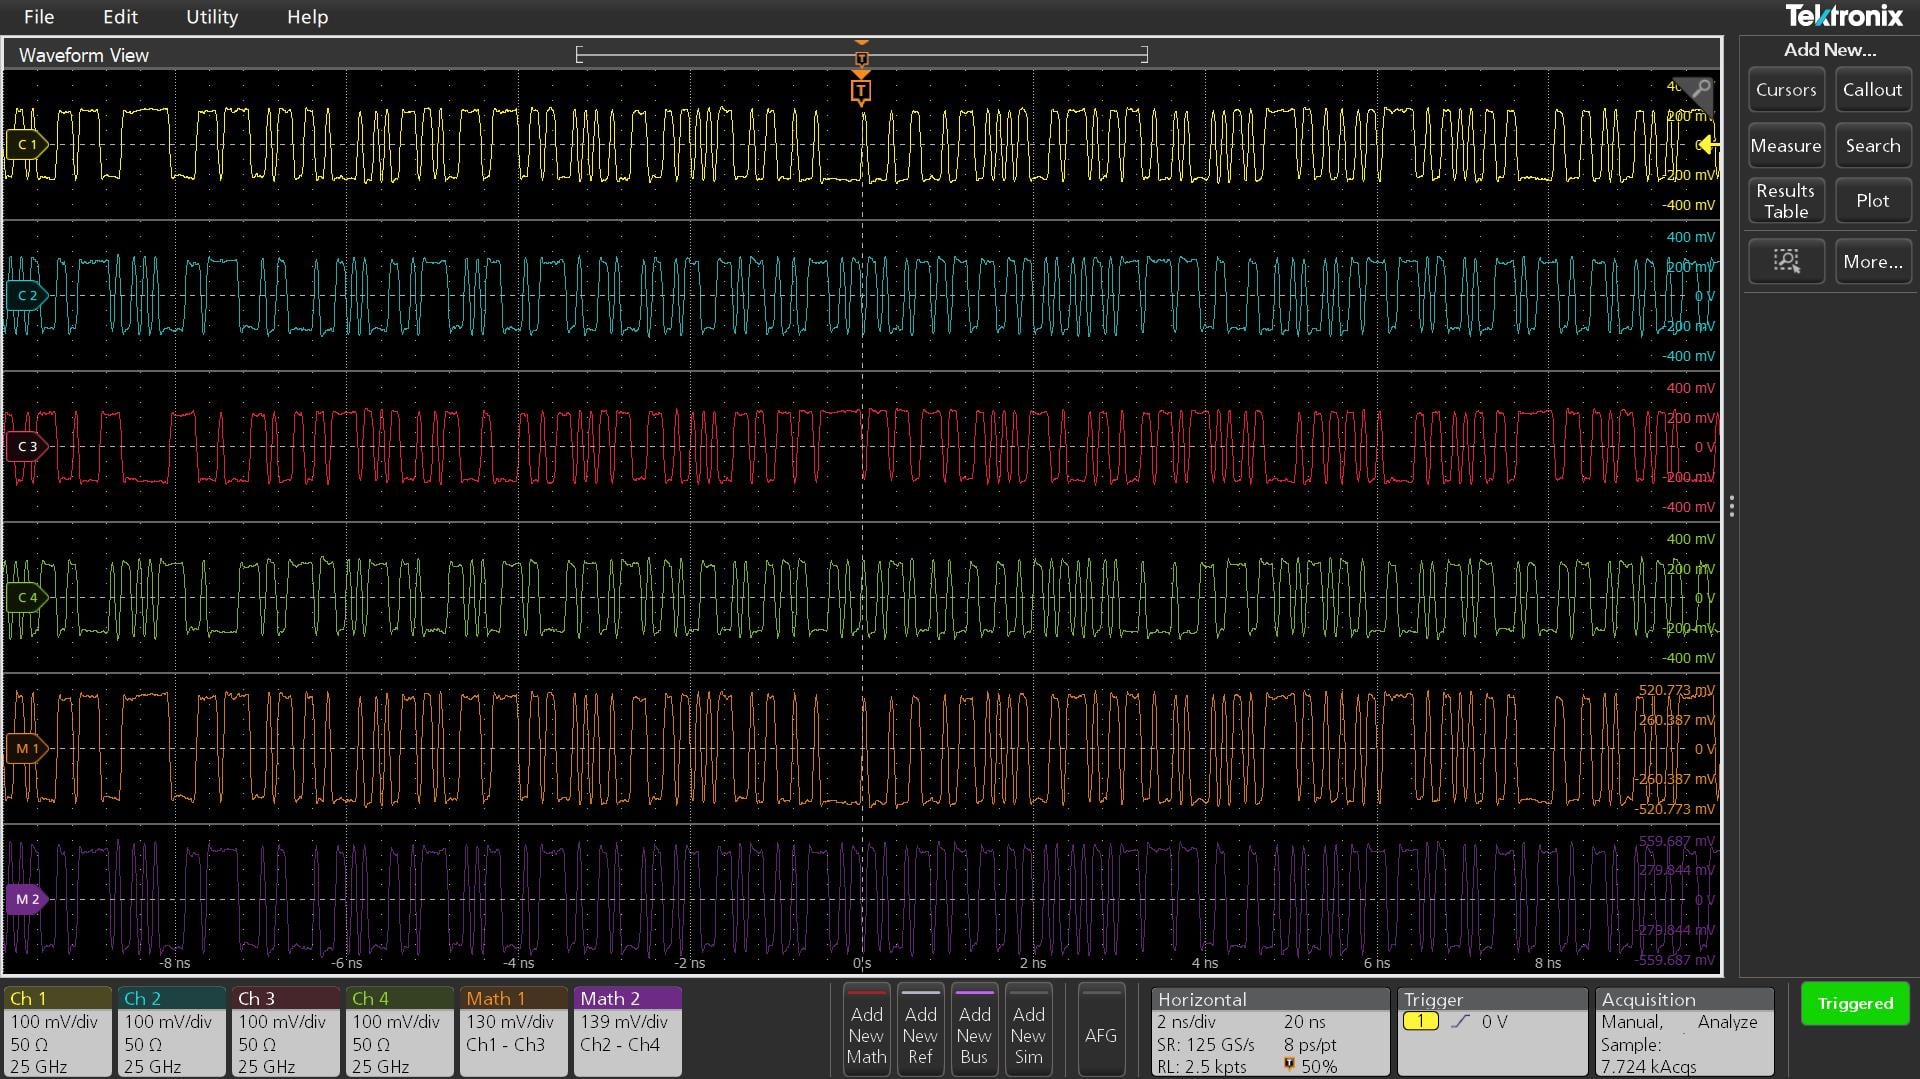
The 7 Series DPO offers a revolutionary Stacked display mode. Historically, scopes have overlaid all waveforms in the same graticule, forcing difficult tradeoffs:
To make each waveform visible, you vertically scale and position each waveform so that they don't overlap. Each waveform uses a small percentage of the available ADC range, leading to less accurate measurements.
For measurement accuracy, you vertically scale and position each waveform to cover the entire display. The waveforms overlap each other, making it hard to distinguish signal details on individual waveforms.
The Stacked display eliminates this tradeoff. It automatically adds and removes additional horizontal waveform 'slices' (additional graticules) as waveforms are created and removed. Each slice helps you get the most out of the newly developed custom 12-bit analog-to-digital converters by allocating separate full-resolution graticules for each waveform. Each graticule represents the full dynamic range of the ADC while maintaining the often-preferred view where the waveforms are separated and compared.
And it is all done automatically as waveforms are added or removed. Channels can easily be reordered in stacked display mode by dragging and dropping the channel and waveform badges in the Settings bar at the bottom of the display. Groups of channels can also be overlaid within a slice to simplify visual comparison of signals.
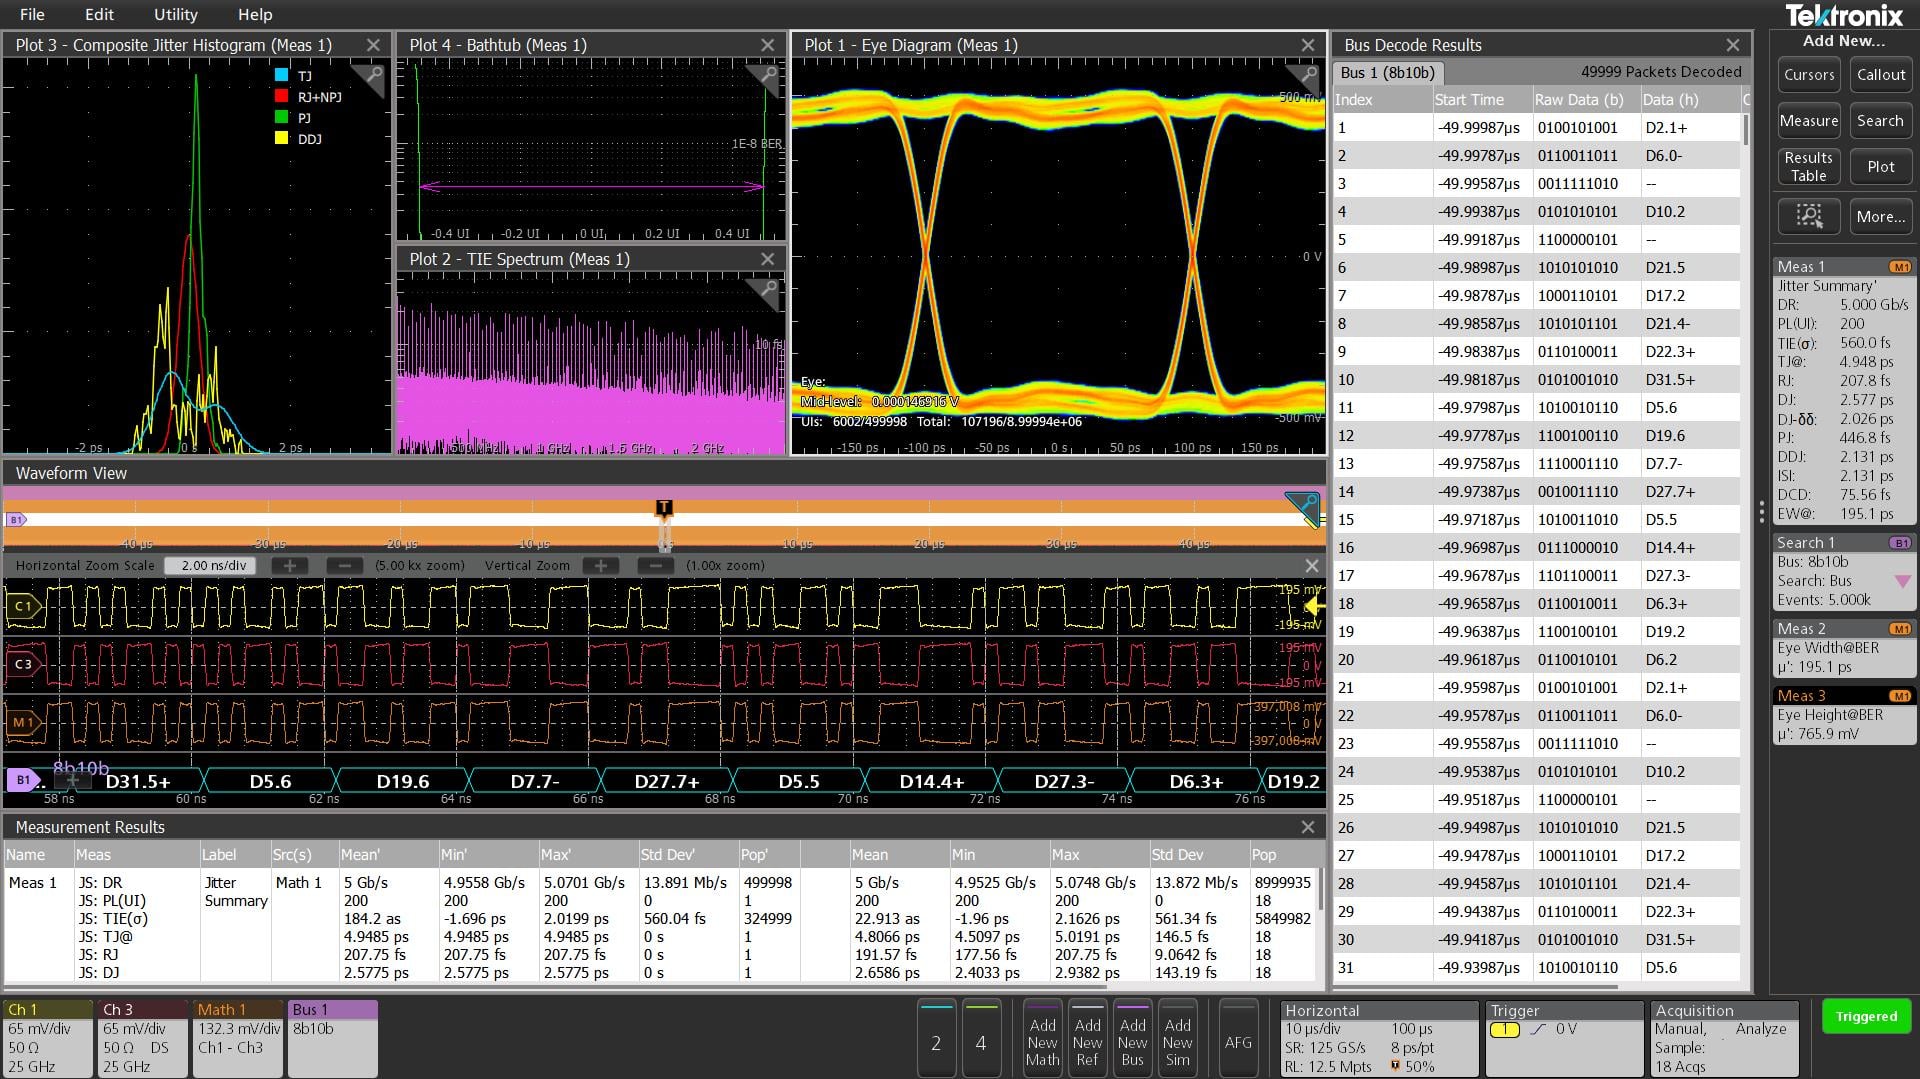
The massive 15.6 inch display provides plenty of viewing area not only for signals, but also for plots, measurement results tables, bus decode tables and more. By bringing every perspective together in one place, it simplifies analysis, speeds up debug, and gives engineers a clearer picture of overall system behavior.
Exceptionally easy-to-use user interface lets you focus on the task at hand
The Settings Bar - key parameters and waveform management
Waveform and scope operating parameters are displayed in a series of “badges” in the Settings Bar that runs along the bottom of the display. The Settings Bar provides Immediate access for the most common waveform management tasks. With a single tap, you can:
Turn on channels
Add math waveforms
Add reference waveforms
Add bus waveforms
Enable the optional integrated Arbitrary Function generator (AFG)
The Results Bar - analysis and measurements
The Results Bar on the right side of the display includes immediate, one-tap access to the most common analytical tools such as cursors, measurements, searches, measurement and bus decode results tables, plots, and callouts.
Measurement and search results badges are displayed in the Results Bar without sacrificing any waveform viewing area. For additional waveform viewing area, the Results Bar can be dismissed and brought back at any time.
Touch interaction finally done right
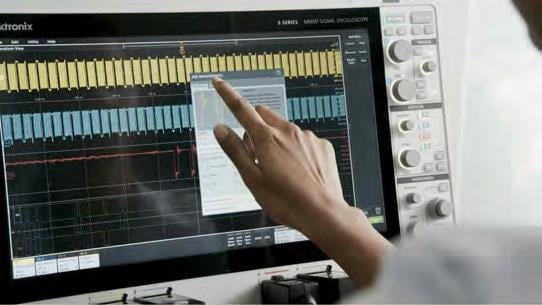
Oscilloscopes have included touch screens for years, but the touch interface has been an afterthought. The 7 Series DPO 15.6" display includes a capacitive touchscreen and provides the industry's first oscilloscope user interface truly designed for touch.
The touch interactions that you use with phones and tablets, and expect in a touch enabled device, are supported.
Drag waveforms left/right or up/down to adjust horizontal and vertical position or to pan a zoomed view
Pinch and expand to change scale or zoom in/out in either horizontal or vertical directions
Flick items off the edge of the screen to delete them
Swipe in from the right to reveal the Results Bar or down from the top to access the menus in the upper left corner of the display
Smooth, responsive front panel controls allow you to make adjustments with familiar knobs and buttons, and you can add a mouse or keyboard as a third interaction method.
Attention to detail in the front-panel controls
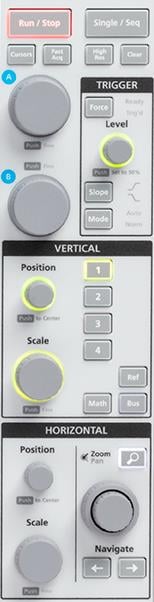
Traditionally, the front face of a scope has been roughly 50% display and 50% controls. The 7 Series DPO display fills about 85% of the face of the instrument. To achieve this, it has a streamlined front panel that retains critical controls for simple intuitive operation, but with a reduced number of menu buttons for functions directly accessed via objects on the display.
Color-coded LED light rings indicate trigger source and vertical scale/ position knob assignments. Large, dedicated Run/ Stop and Single Sequence buttons are placed prominently in the upper right, and other functions like Force Trigger, Trigger Slope, Trigger Mode, Default Setup, Auto-set and Quick-save functions are all available using dedicated front panel buttons.
With increasing acquisition durations, the 7 Series DPO helps with navigating through your deep record to quickly move to areas of interest. You can simply zoom in on the waveform with the integrated Wave Inspector controls, then either use the spring-loaded panning control of Wave Inspector or grab the zoom window and move it forward or backward in the record quickly and easily.
Windows or not - you choose
The 7 Series DPO offers you the choice of whether to include a Microsoft Windows
The 7 Series DPO comes with a standard removable SSD that contains a closed embedded operating system (Linux) that will boot as a dedicated scope with no ability to run or install other programs. An optional SSD with Windows 10 operating system is available that will boot to an open Windows 10 configuration, so you can minimize the oscilloscope application and access a Windows desktop where you can install and run additional applications on the oscilloscope or you can connect additional monitors and extend your desktop. Simply swap the drives as needed on the rear of the instrument.
Whether you run Windows or not, the oscilloscope operates in exactly the same way with the same look and feel and UI interaction.
Comprehensive analysis for fast insight
Basic waveform analysis
Verifying that your prototype's performance matches simulations and meets the project's design goals requires careful analysis, ranging from simple checks of rise times and pulse widths to sophisticated power loss analysis, characterization of system clocks, and investigation of noise sources.
The 7 Series DPO offers a comprehensive set of standard analysis tools including:
Waveform- and screen-based cursors
36 automated measurements. Measurement results include all instances in the record, the ability to navigate from one occurrence to the next, and immediate viewing of the minimum or maximum result found in the record
Basic waveform math
Basic FFT analysis
Advanced waveform math including arbitrary equation editing with filters and variables
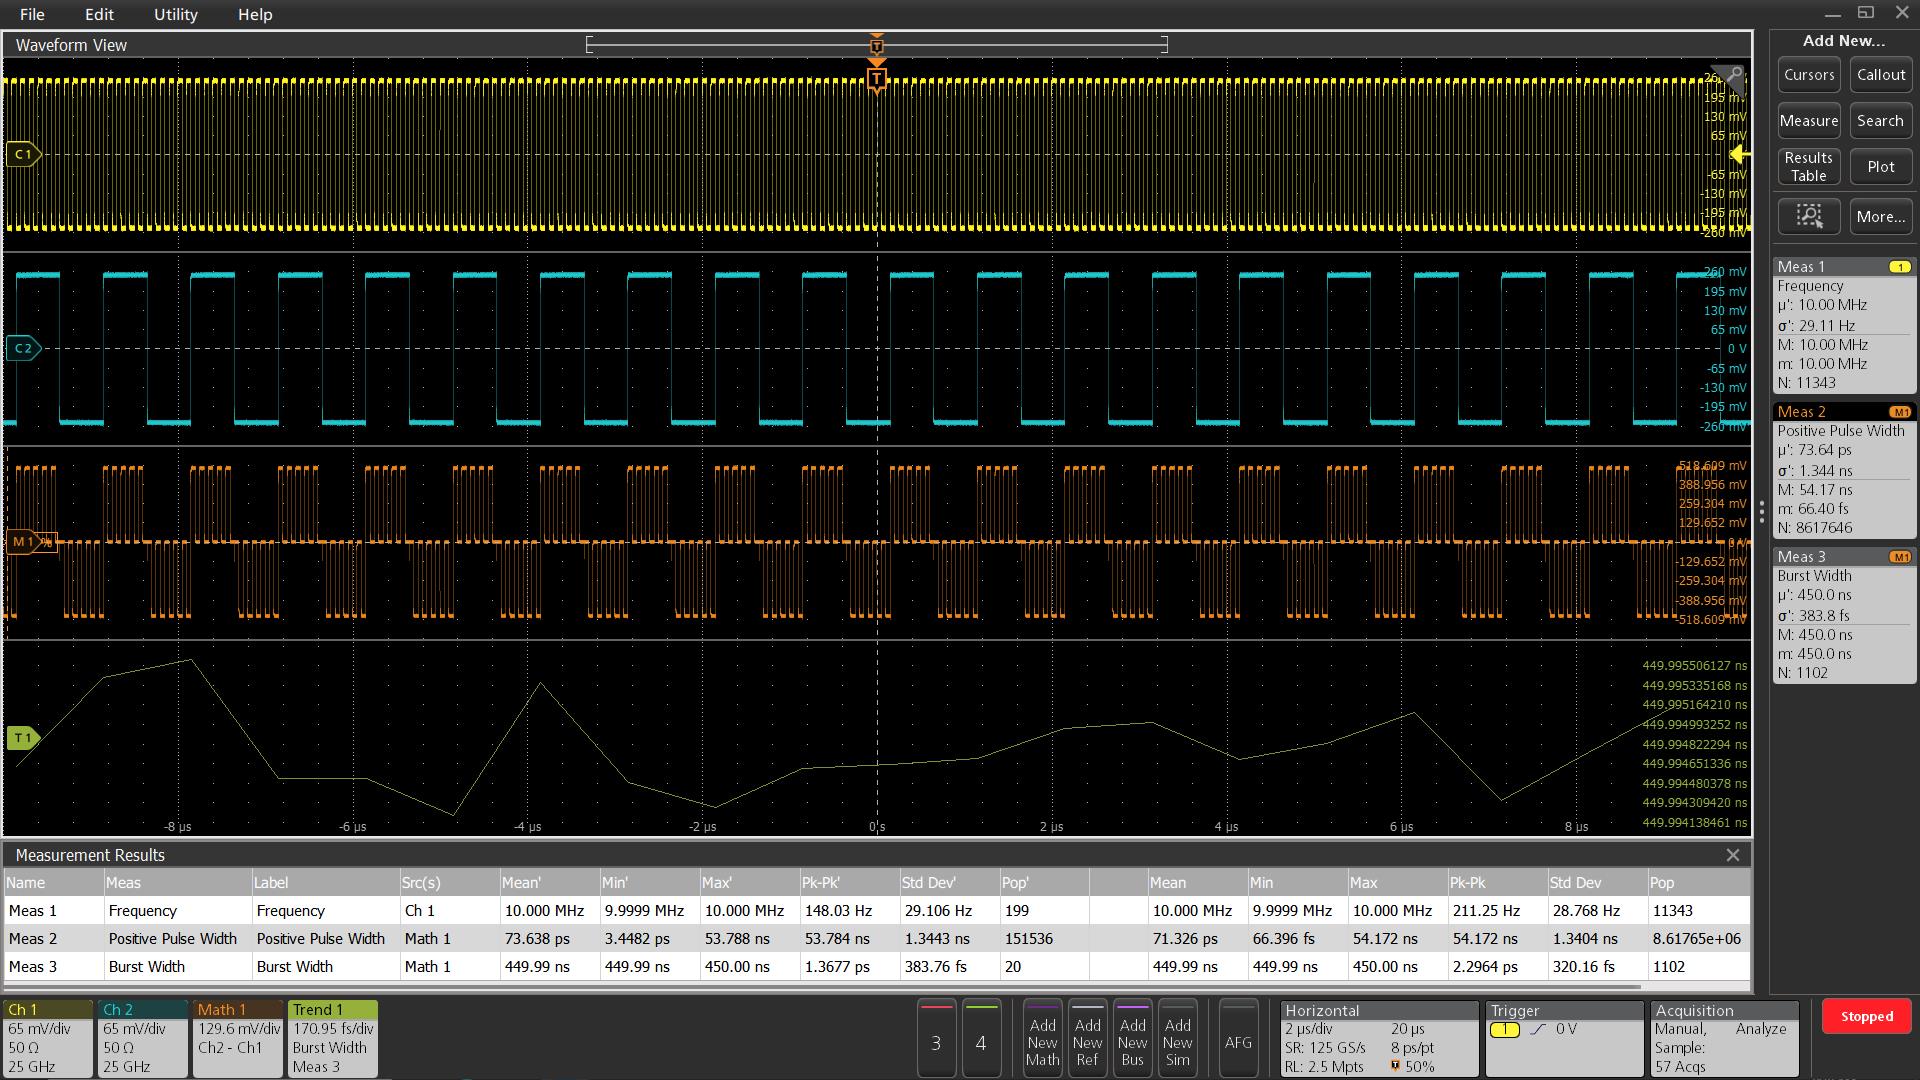
Standard amplitude and time measurements annotate the waveform display with visual bars and markers to indicate relative information. Measurement results tables provide comprehensive statistical views of measurement results with statistics across both the current acquisition and all acquisitions.
Callouts
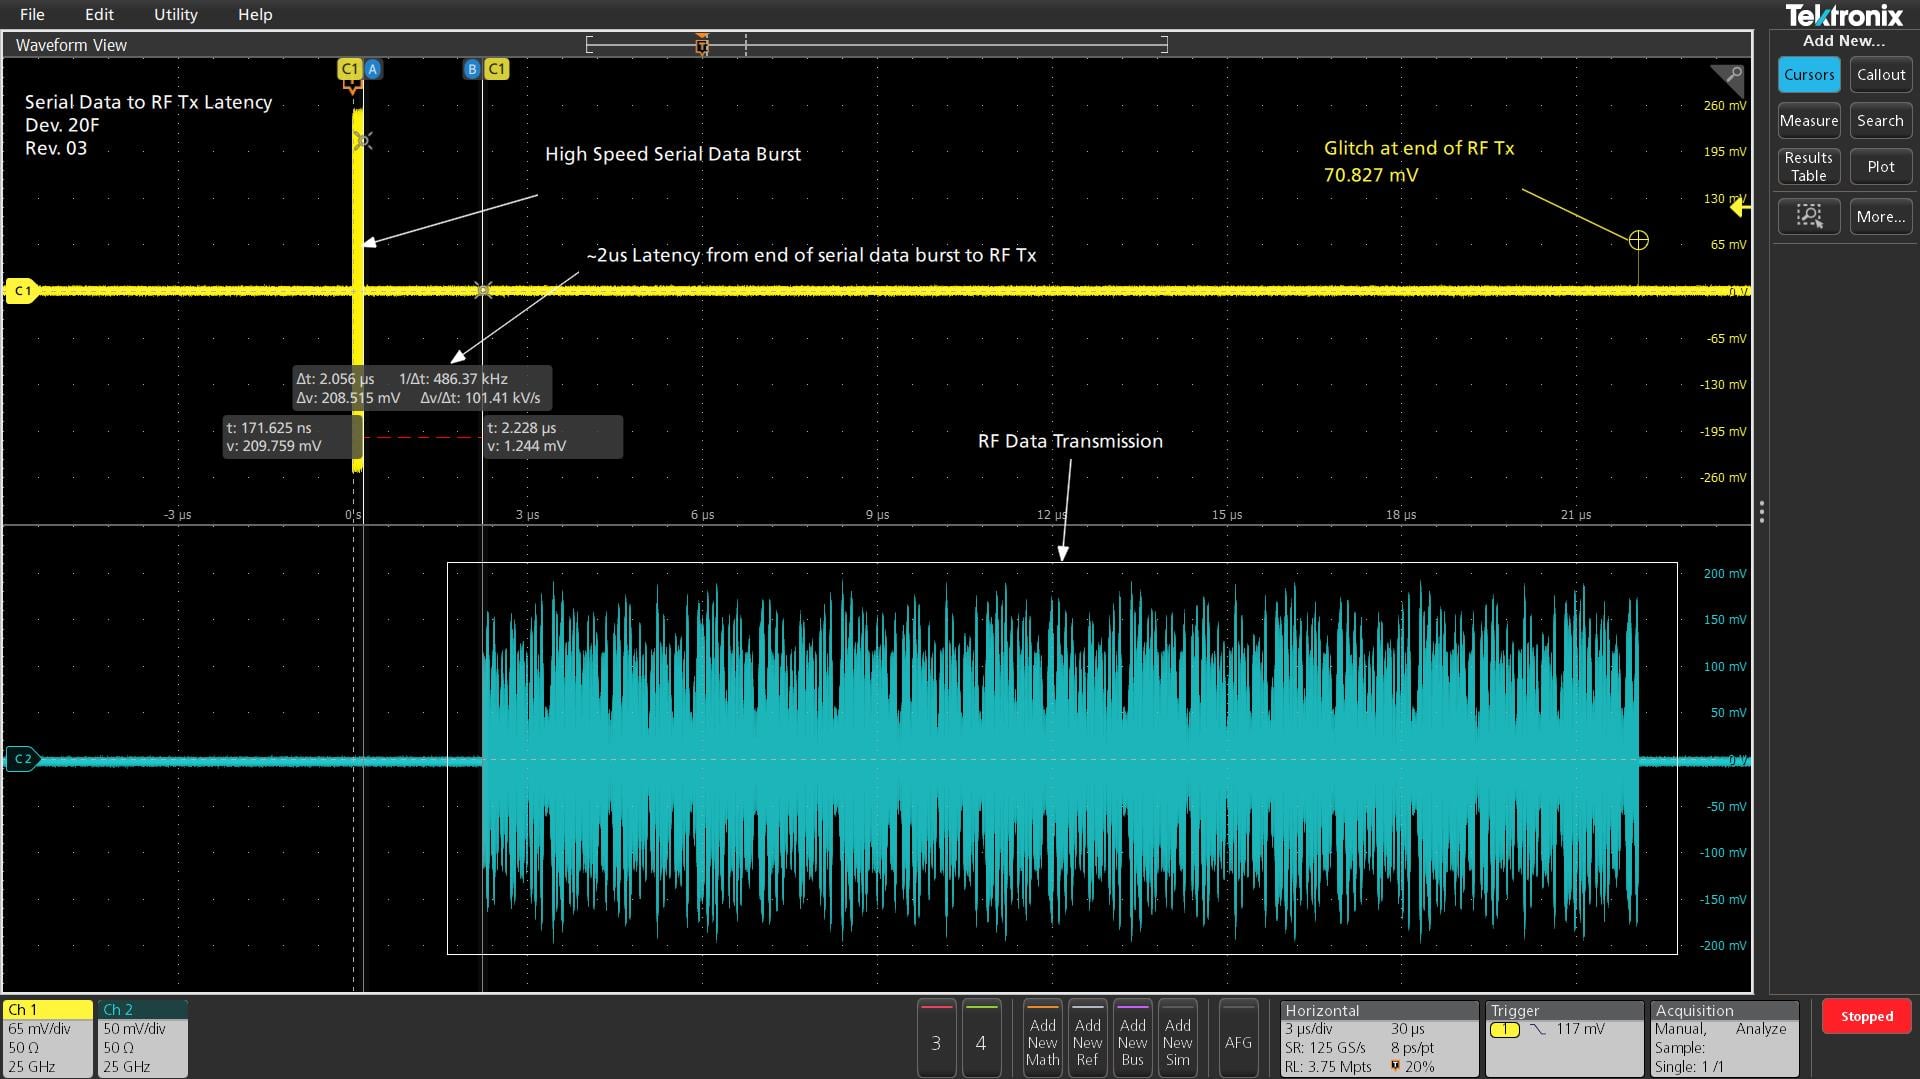
Note: Write and position a text box on the screen.Arrow: Write and position a text box, then add an arrow to a specific location on the screen.Rectangle: Write text and outline a specific region on the screen indicated by a resizable box.Bookmark: Create a dynamic readout at a specific time relevant to a trigger point. This readout includes text, magnitude of the signal, signal units, as well as a line and target indicating the bookmark reference point.
Documenting test results and methods is critical when sharing data across a team, recreating a measurement at a later date, or delivering a customer report. With a few taps on the screen, you can create as many custom callouts as needed; enabling you to document the specific details of your test results. With each callout, you can customize the text, location, color, font size, and font.
Navigation and search
Finding your event of interest in a long waveform record can be time consuming without the right search tools. With today's record lengths of many millions of data points, locating your event can mean scrolling through literally thousands of screens of signal activity.
The 7 Series DPO offers the industry's most comprehensive search and waveform navigation with its innovative Wave Inspector® controls. These controls speed panning and zooming through your record. With a unique force-feedback system, you can move from one end of your record to the other in just seconds. Or, use intuitive drag and pinch/ expand gestures on the display itself to investigate areas of interest in a long record.
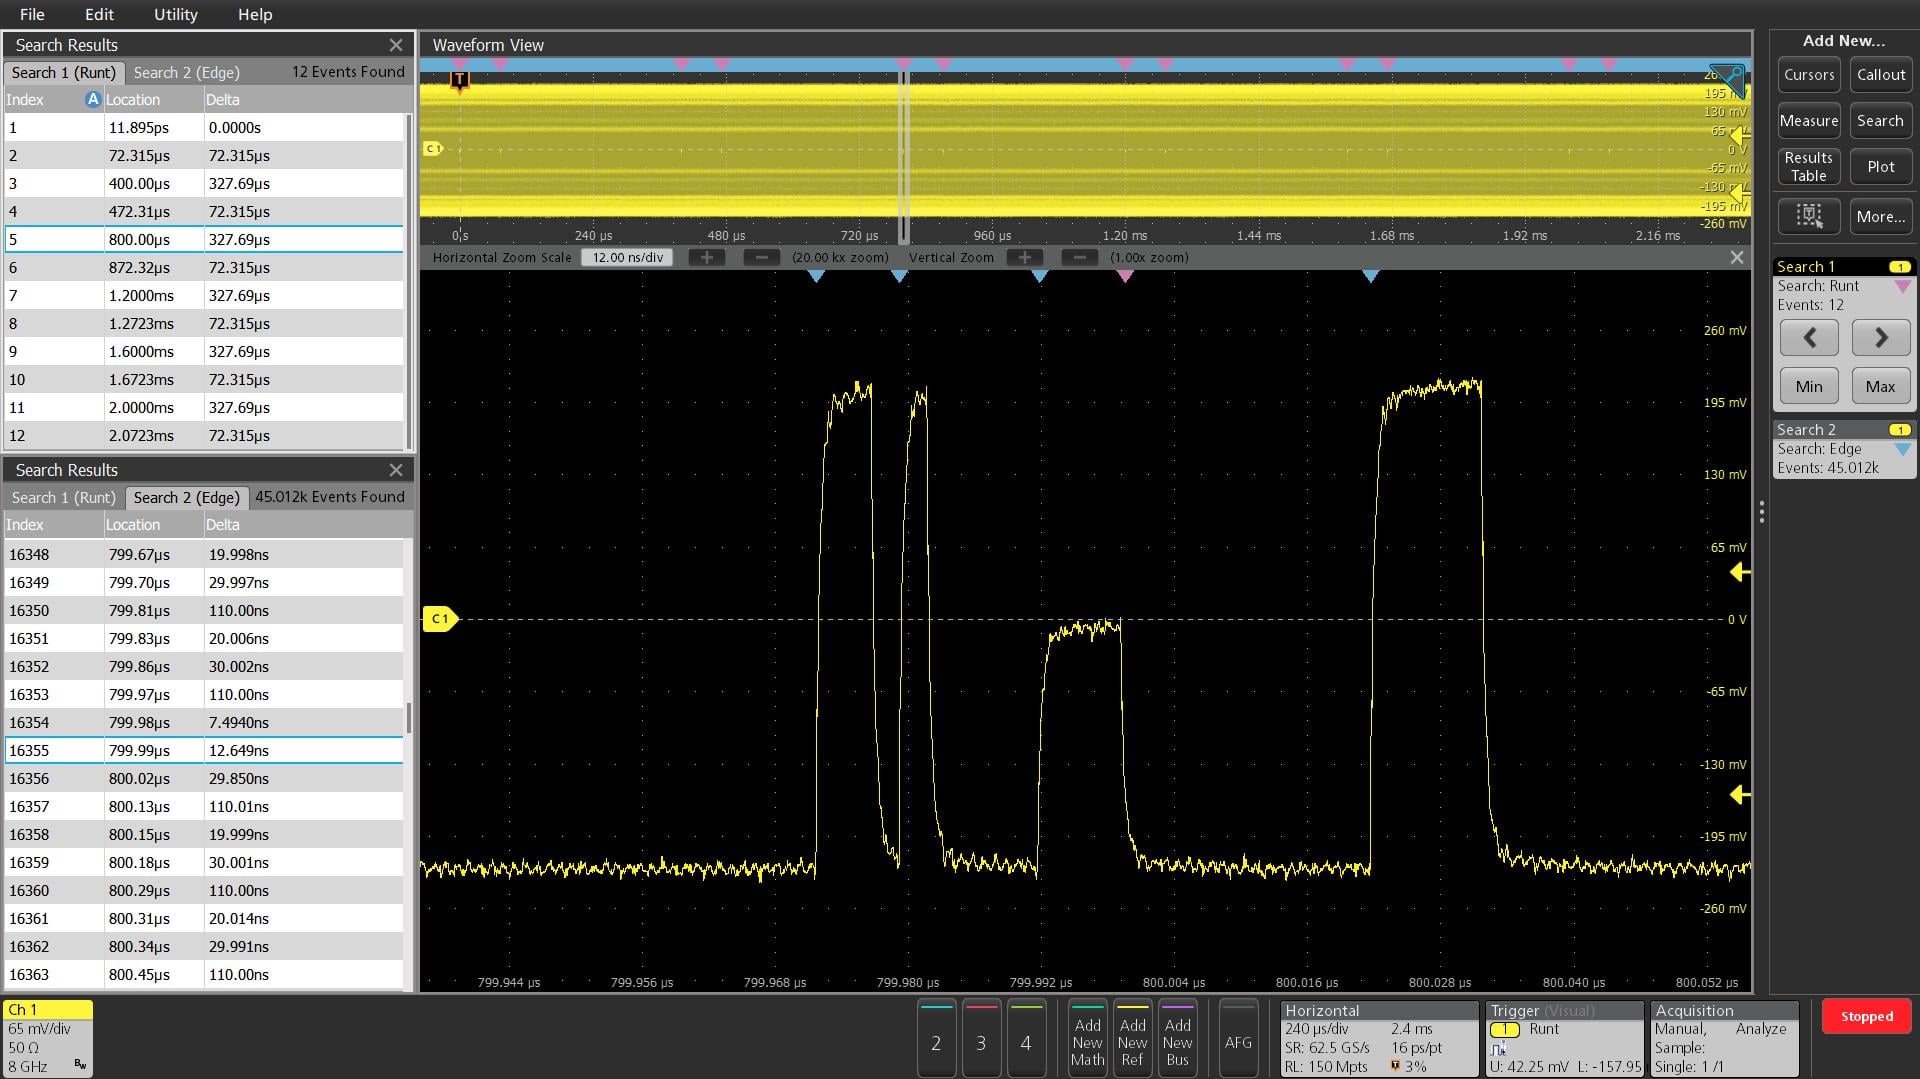
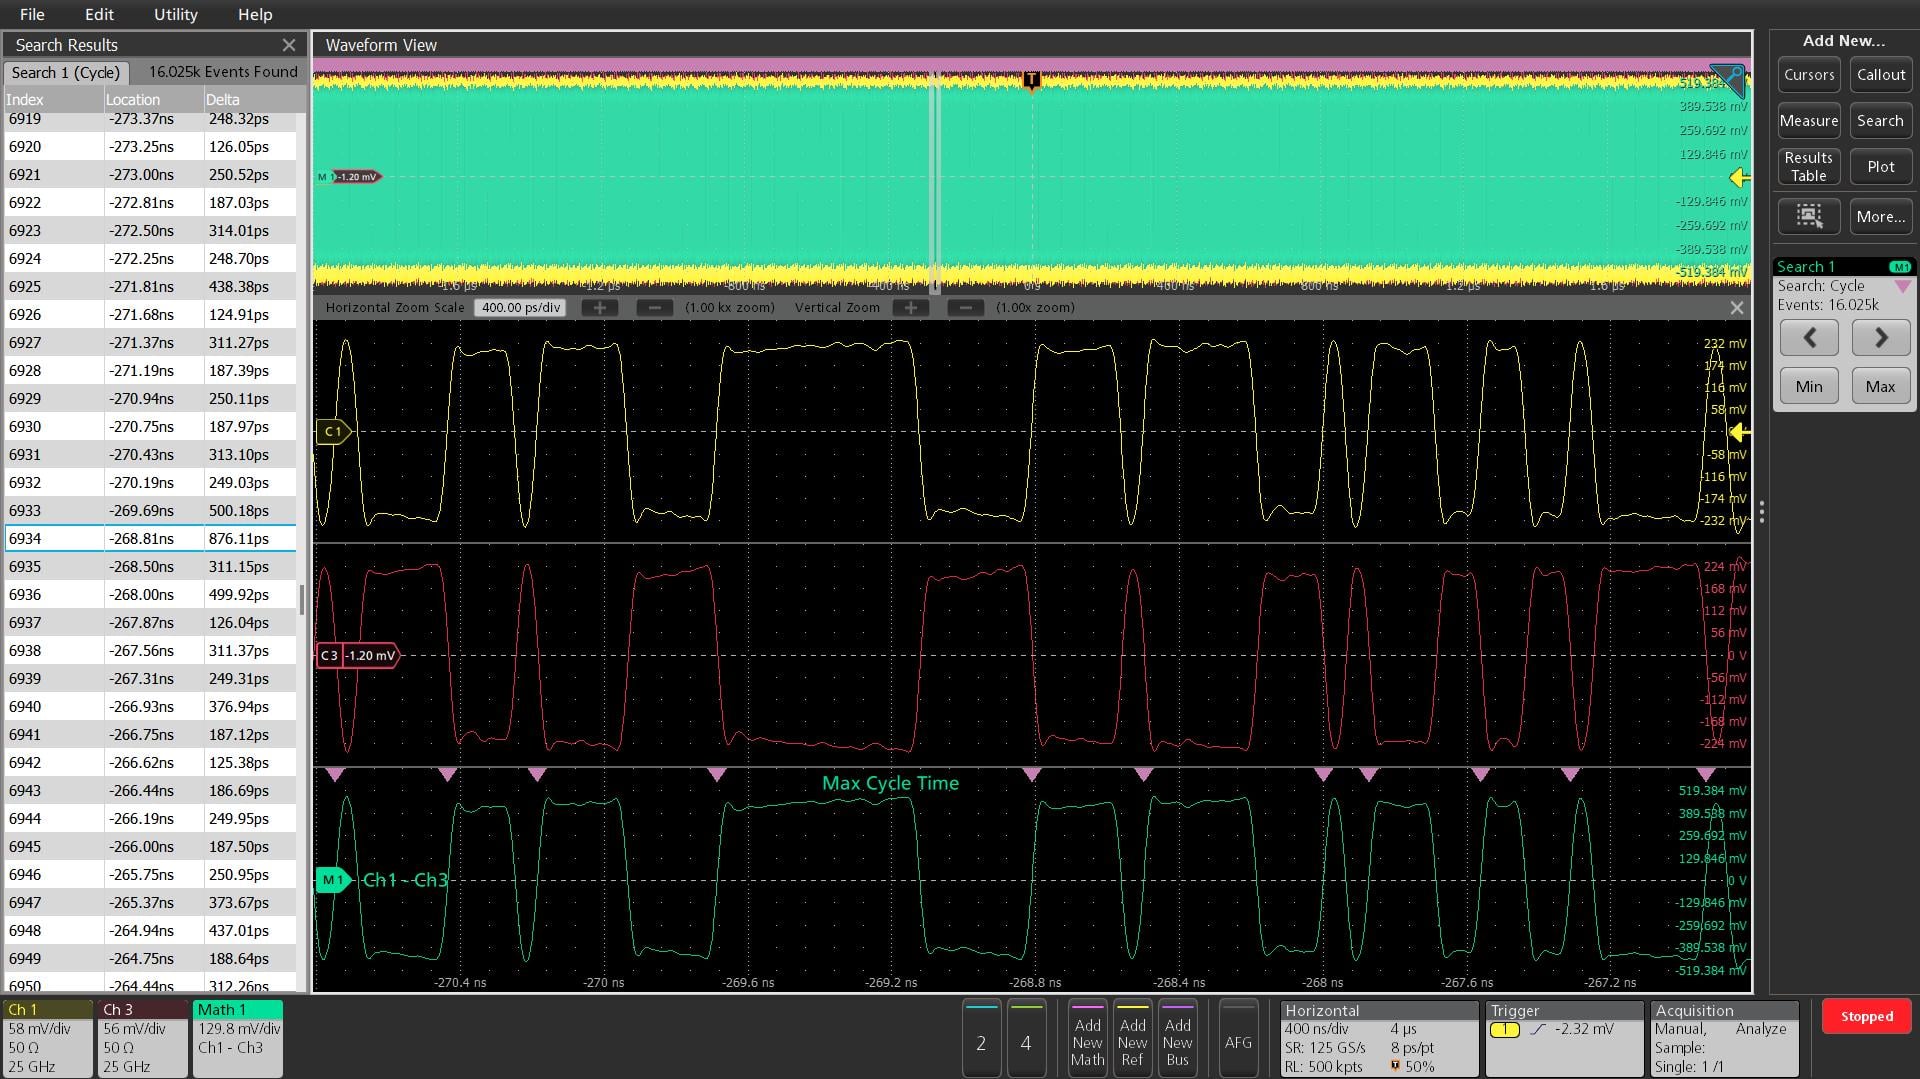
The Search feature allows you to automatically search through your long acquisition looking for user-defined events. All occurrences of the event are highlighted with search marks and are easily navigated to, using the Previous ( ← ) and Next ( → ) buttons found on the front panel or on the Search badge on the display. Search types include edge, pulse width, timeout, runt, window, logic, setup and hold, rise/fall time and parallel/serial bus packet content. You can define as many unique searches as you like.
You can also quickly jump to the minimum and maximum value of search results by using the Min and Max buttons on the Search badge.
Mask and limit testing (optional)
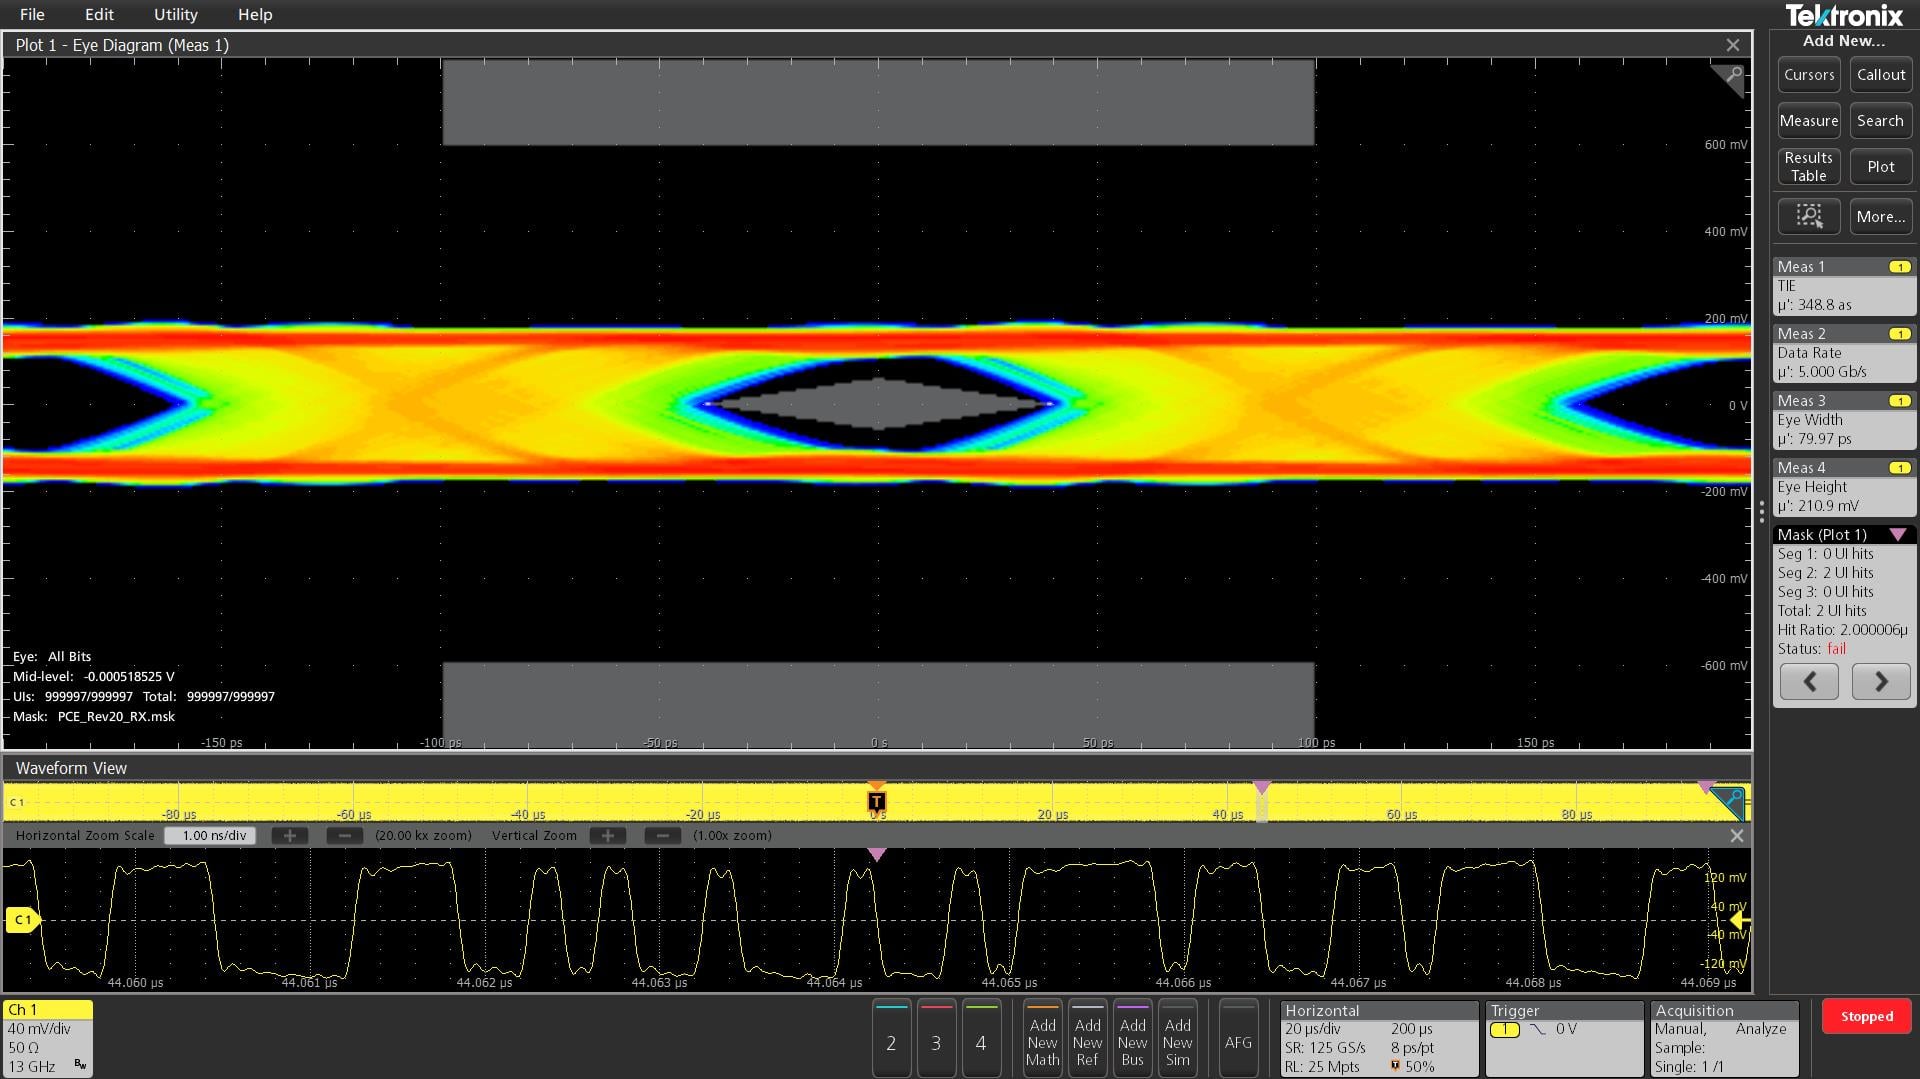
Whether you are focused on signal integrity or setting up pass/ fail conditions for production, mask testing is an efficient tool to characterize the behavior of certain signals in a system. Quickly create custom masks by drawing mask segments on the screen. Tailor a test to your specific requirements and set actions to take when a mask hit is registered, or when a complete test passes or fails.
Limit testing is an insightful way to monitor the long-term behavior of signals, helping you characterize a new design or confirm hardware performance during production line testing. Limit tests compare your live signal to an ideal, or golden version of the same signal with user-defined vertical and horizontal tolerances.
You can easily tailor a mask or limit test to your specific requirements by:
Defining test duration in number of waveforms
Setting a violation threshold that must be met before considering a test a failure
Counting violations/failures and reporting statistical information
Setting actions upon violations, test failure, and test complete
Figure 1. Custom, multiple segment mask capturing the presence of a signal glitch and runt pulse in a waveform.
User-defined filtering (optional)
In the broad sense, any system that processes a signal can be thought of as a filter. For example, an oscilloscope channel operates as a low pass filter where its 3 dB down point is referred to as its bandwidth. Given a waveform of any shape, a filter can be designed that can transform it into a defined shape within the context of some basic rules, assumptions, and limitations.
Digital filters have some significant advantages over analog filters. For example, the tolerance values of analog filter circuit components are high enough that high order filters are difficult or even impossible to implement. High order filters are easily implemented as digital filters. Digital filters can be implemented as Infinite Impulse Response (IIR) or Finite Impulse Response (FIR). The choice of IIR or FIR filters are based upon design requirements and application.
The 7 Series DPO has the ability to apply designated filters to math waveforms through a MATH arbitrary function. Option 7-UDFLT takes this functionality a level deeper, providing more than MATH arbitrary basic functions and adds flexibility to support standard filters and can be used for application centric filter designs.
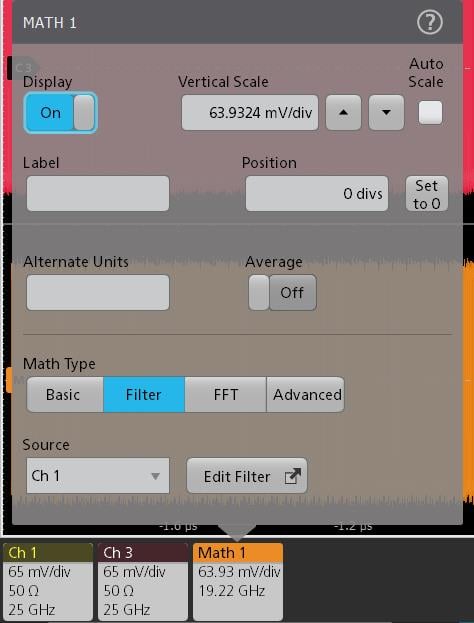
Filter types supported on the 7 Series DPO include:
Low pass
High pass
Band pass
Band stop
All pass
Hilbert
Differentiator
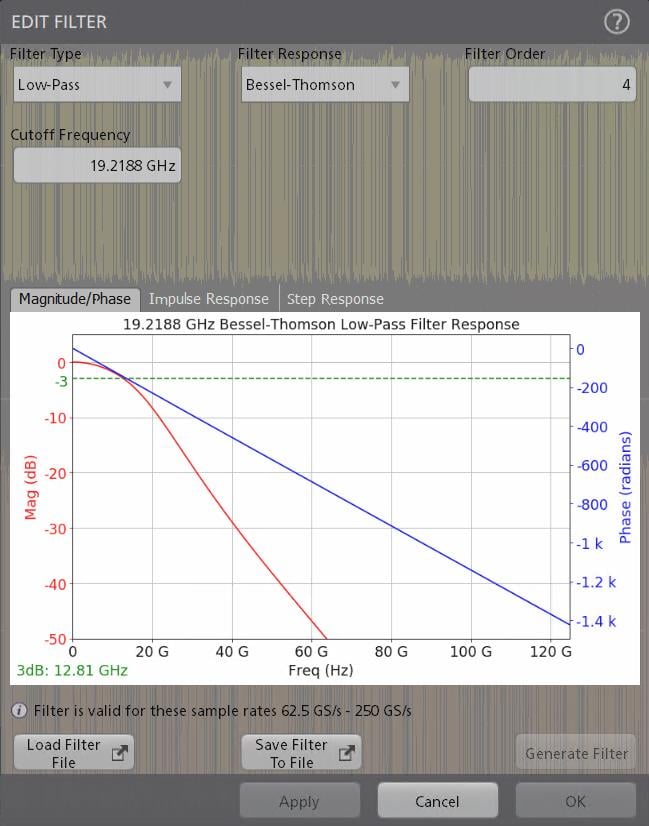
Filter response types supported on the 7 Series DPO include:
Butterworth
Chebyshev I
Chebyshev II
Elliptical
Gaussian
Bessel-Thomson
Custom
The Filter Response control is available for all Filter Types except All-pass, Hilbert, or Differentiator.
Filter designs can be saved, recalled, and applied once any editing has been completed.
Protocol decode and analysis (optional)
During debugging, it can be invaluable to trace the flow of activity through a system by observing the traffic on one or more serial buses. It could take many minutes to manually decode a single serial packet, much less the thousands of packets that may be present in a long acquisition.
And if you know the event of interest that you are attempting to capture occurs when a particular command is sent across a serial bus, wouldn't it be nice if you could trigger on that event? Unfortunately, it's not as easy as simply specifying an edge or a pulse width trigger.
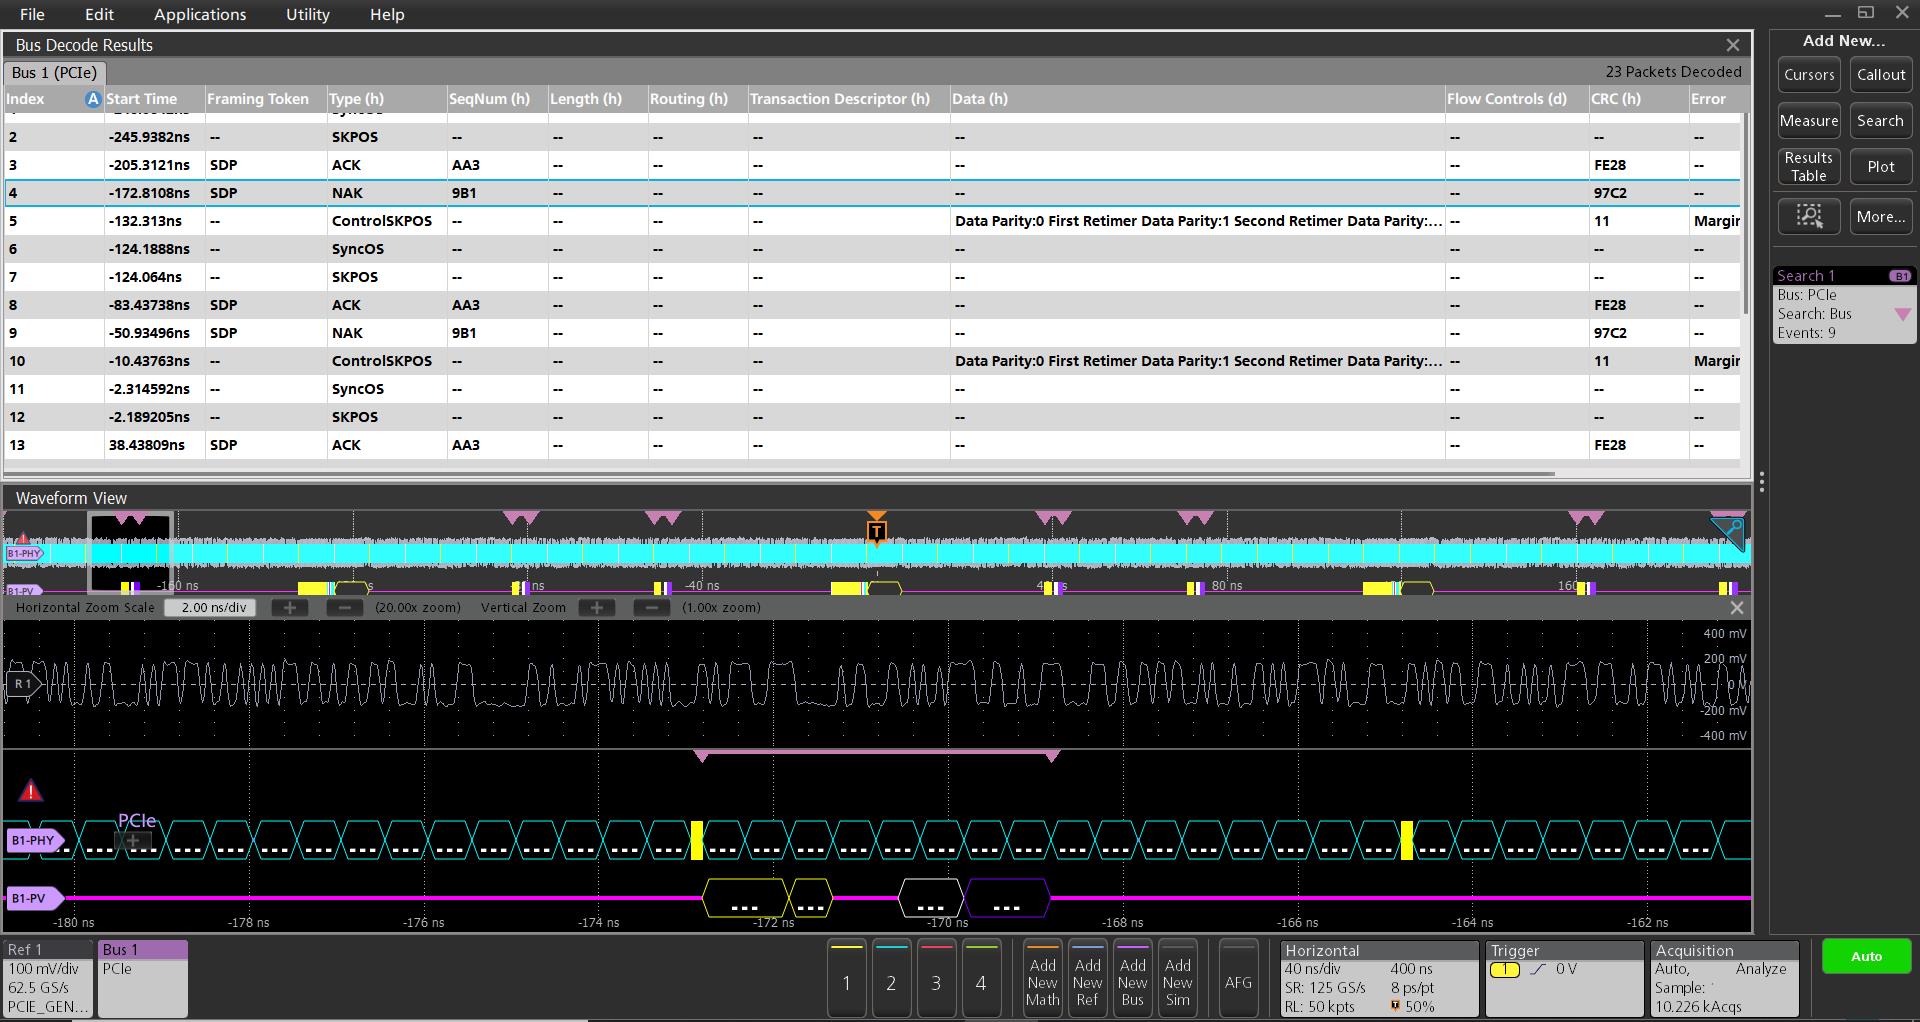
The 7 Series DPO offers a robust set of tools for working with the most common buses such as PCIe, USB, DisplayPort, DDR and dozens of others supports – refer to Ordering Information for complete list of supports.
Protocol search enables you to search through a long acquisition of serial packets and find the ones that contain the specific packet content you specify. Each occurrence is highlighted by a search mark. Rapid navigation between marks is as simple as pressing the Previous ( ← ) and Next ( → ) buttons on the front panel or in the Search badge that appears in the Results Bar.
The tools described for serial buses also work on parallel buses. Support for parallel buses is standard in the instrument. Parallel buses can be up to 64 bits wide and can include a combination of analog and digital channels.
Serial protocol triggering lets you trigger on specific packet content including start of packet, specific addresses, specific data content, unique identifiers, and errors.
Bus waveforms provide a higher-level, combined view of the individual signals (clock, data, chip enable, and so on) that make up your bus, making it easy to identify where packets begin and end, and identifying sub-packet components such as address, data, identifier, CRC, and so on.
The bus waveform is time aligned with all other displayed signals, making it easy to measure timing relationships across various parts of the system under test.
Bus decode tables provide a tabular view of all decoded packets in an acquisition much like you would see in a software listing. Packets are time stamped and listed consecutively with columns for each component (Address, Data, and so on).
Jitter and Eye Diagram Analysis (standard)
The 7 Series DPO comes with integrated jitter and eye diagram analysis, leveraging Tektronix’ proven DPOJET engine. With just a few clicks, engineers can measure and view key parameters such as Time Interval Error and Phase Noise. Analysis tools including histograms, time-trend plots, and spectrum views provide quick visibility into how timing varies over time and where jitter or modulation sources originate.
Advanced Jitter and Eye Diagram Analysis (optional)
Option 7-DJA adds more than 30 additional measurements and advanced decomposition algorithms. It separates random, deterministic, periodic, and data-dependent jitter components with precision, giving engineers clear visibility into root causes.
Real-time eye diagram rendering, combined with advanced visualization tools such as composite jitter histograms, bathtub curves, SSC profiles, and spectrum plots, provides immediate feedback and deeper insight into signal behavior. Automated eye diagram mask testing with margin analysis not only delivers clear pass/fail results but also quantifies design robustness.
These capabilities make DJA an essential tool for uncovering hidden jitter sources, accelerating debug, and ensuring confidence in today’s high-speed serial, digital, and communication designs.
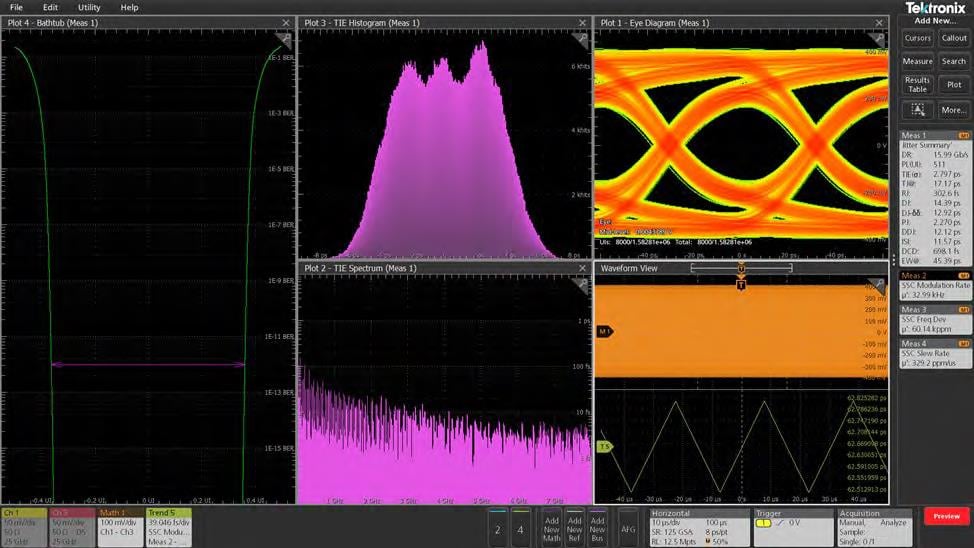
Tektronix uniquely supports virtually unlimited parallel measurements and plots—each with independent clock recovery settings—for rapid side-by-side comparisons of equalization strategies, margin sensitivity, or configuration changes. With DJA, engineers can extend this capability to jitter summaries and eye diagrams across two or more signals from a system. Full jitter measurements, plots, and eye diagrams can be displayed simultaneously for direct comparison, and windows can be easily rearranged to customize the workflow.
Signal Integrity Modeling (Base) (optional)
Modern high-speed designs all face the same challenge: measurement and interconnect impairments that obscure the true performance of the device. Cables, probes, fixtures, and channel elements introduce reflections, loss, and delay that can dominate over the DUT’s actual behavior. This creates two traps in validation: false failures, where the device appears broken but the issue is the measurement path, and false confidence, where the device looks fine in the lab but collapses in the real system. Addressing these impairments is essential for accurate measurement, meaningful simulation, and reliable system validation.
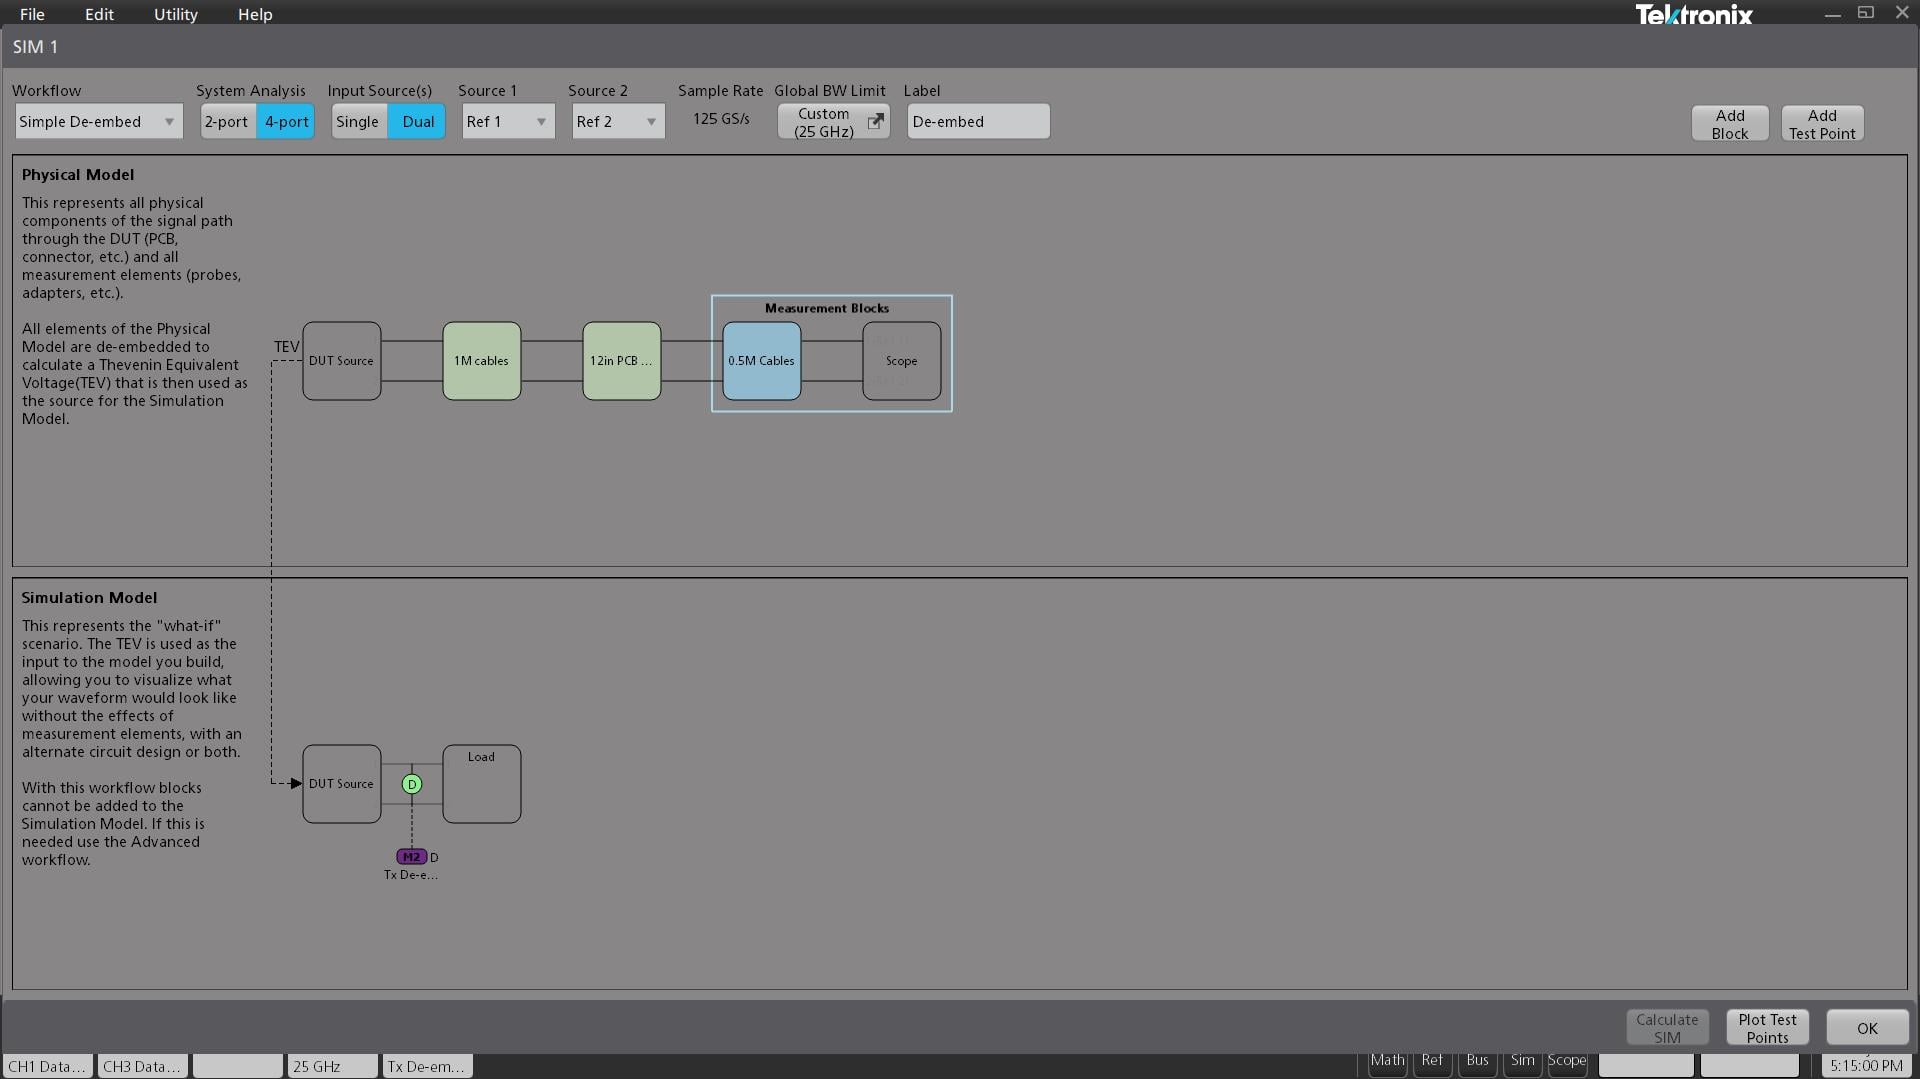
SIM addresses these challenges by enabling precise de-embedding of the measurement circuit—including probes, fixtures, and cables—while accurately accounting for source and load impedances at the transmitter and receiver. SIM allows users to define a variety of models, such as S-parameter, transmission line, and RLC models, to remove loss and delay from the setup. This level of correction improves measurement fidelity and can be the difference between passing and failing compliance tests.
Once the measurement circuit is de-embedded, engineers can explore “what-if” scenarios by embedding a simulation circuit. This may range from a simple 50 Ω termination for transmitter characterization, to a worst-case cable added at the end of a signal path, to a complete backplane or interconnect modeled using S-parameters. These simulations provide valuable insight into system behavior under real-world conditions – helping teams validate design robustness and avoid costly hardware iterations.
Signal Integrity Modeling (Advanced) (optional)
Designers increasingly rely on advanced equalization techniques at the receiver to compensate for loss and distortion in high-speed channels. In many cases, channel loss can cause eye diagrams to close, masking the true performance of the system.
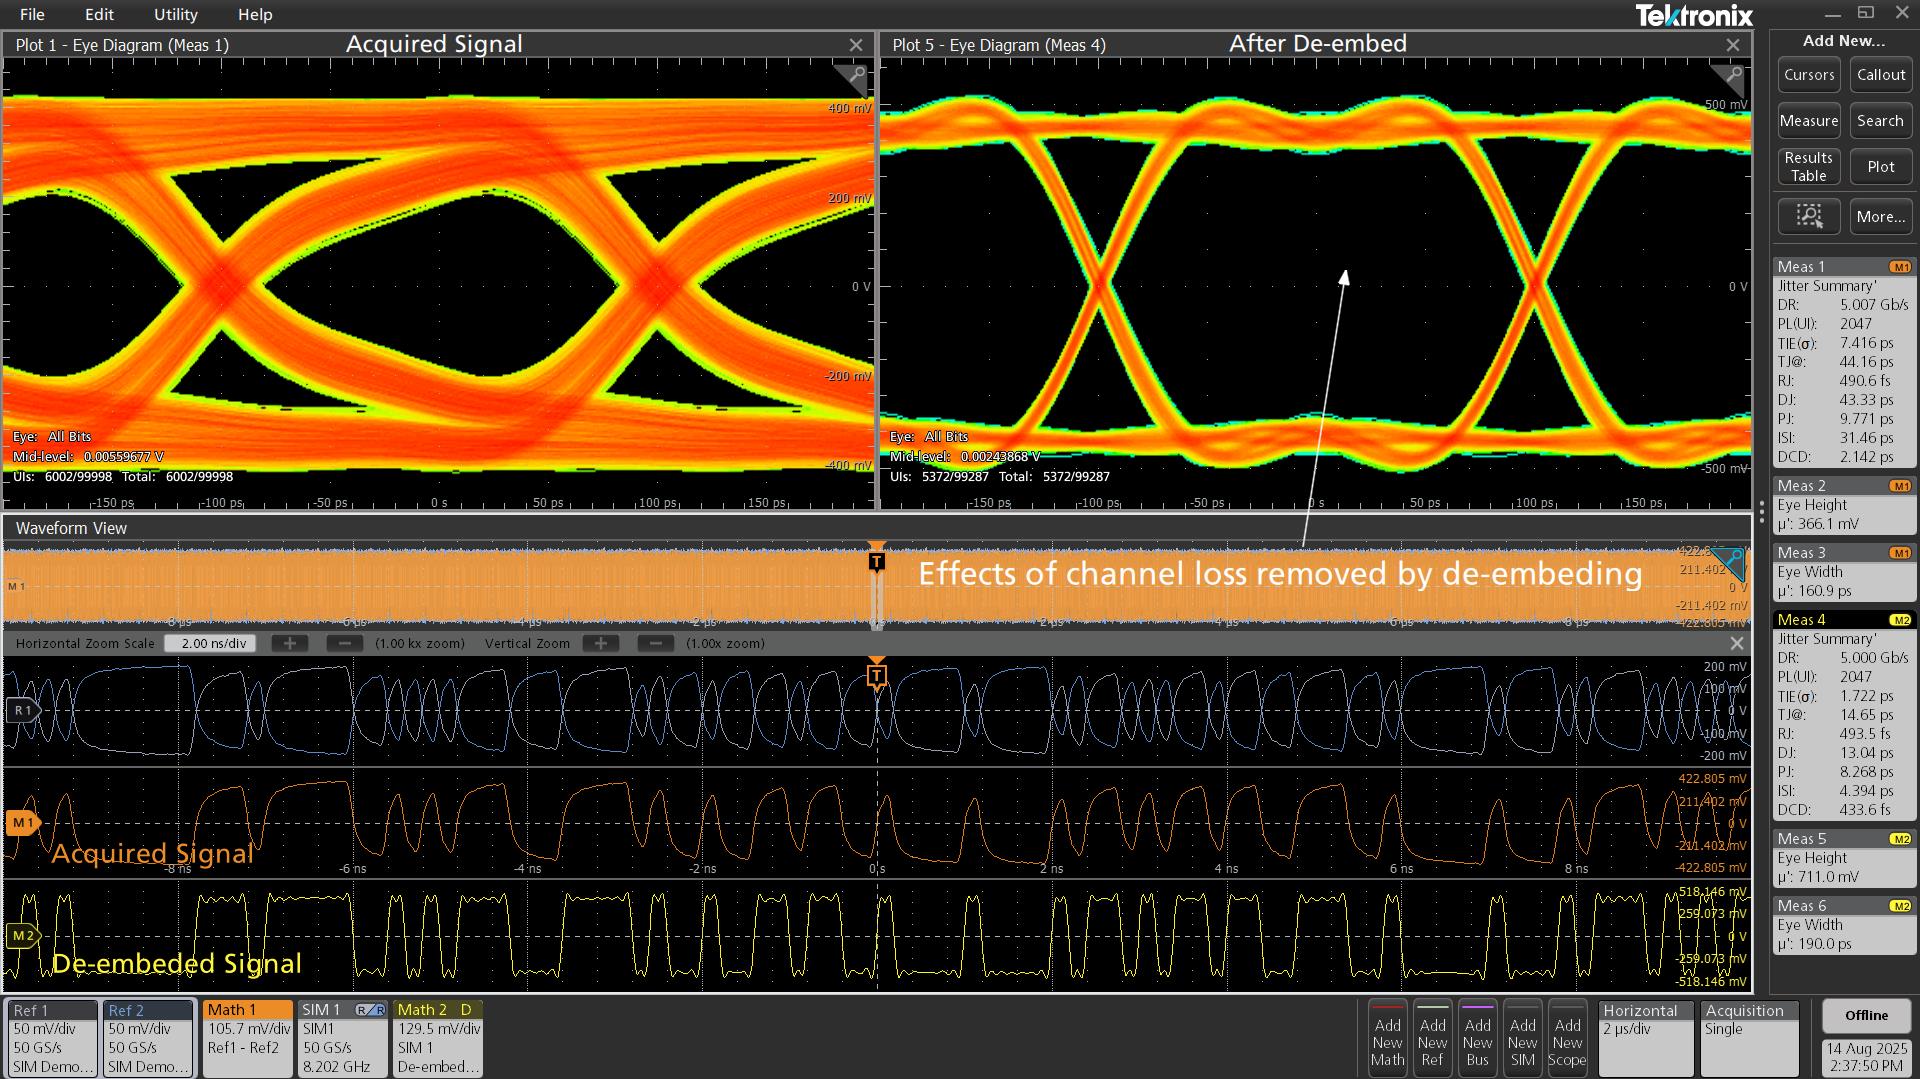
SIM Advanced (SIMA) helps overcome this by providing receiver equalization tools including CTLE, FFE, and DFE that reduce inter-symbol interference (ISI), open closed eyes, and deliver a more accurate view of receiver performance under realistic operating conditions.
Finally, as transmitter waveforms evolve beyond simple NRZ signaling—toward higher-order schemes and tighter margins—evaluating the impact of transmitter equalization becomes critical. SIMA enables users to apply pre-emphasis or de-emphasis to simulate real-world behavior and optimize system performance across challenging channels.
SIMA builds on SIM capabilities, providing a complete signal integrity modeling environment that supports de-embedding, embedding, and advanced equalization for high-speed serial links. Whether validating digital interfaces like DDR, PCIe, or Ethernet, or modeling RF, analog, or fast-switching power systems, SIM and SIMA help ensure robust performance and reduces costly hardware iterations.
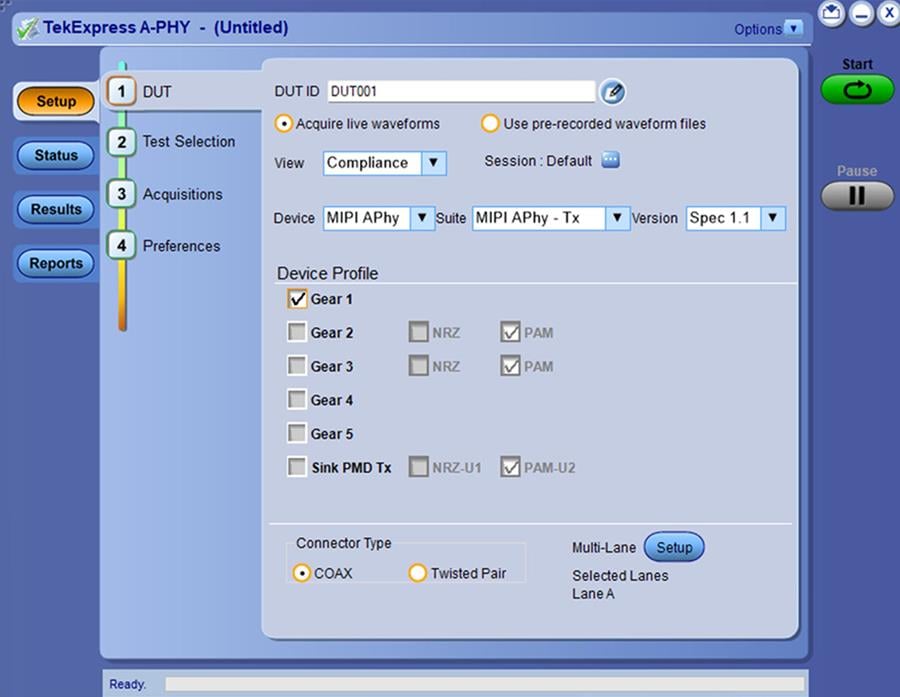
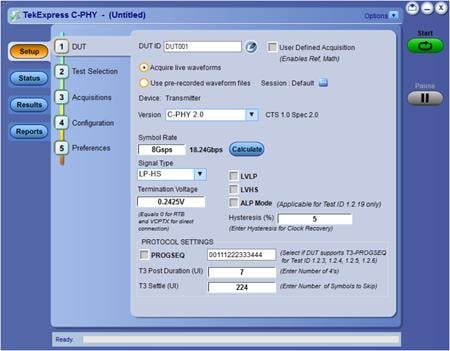
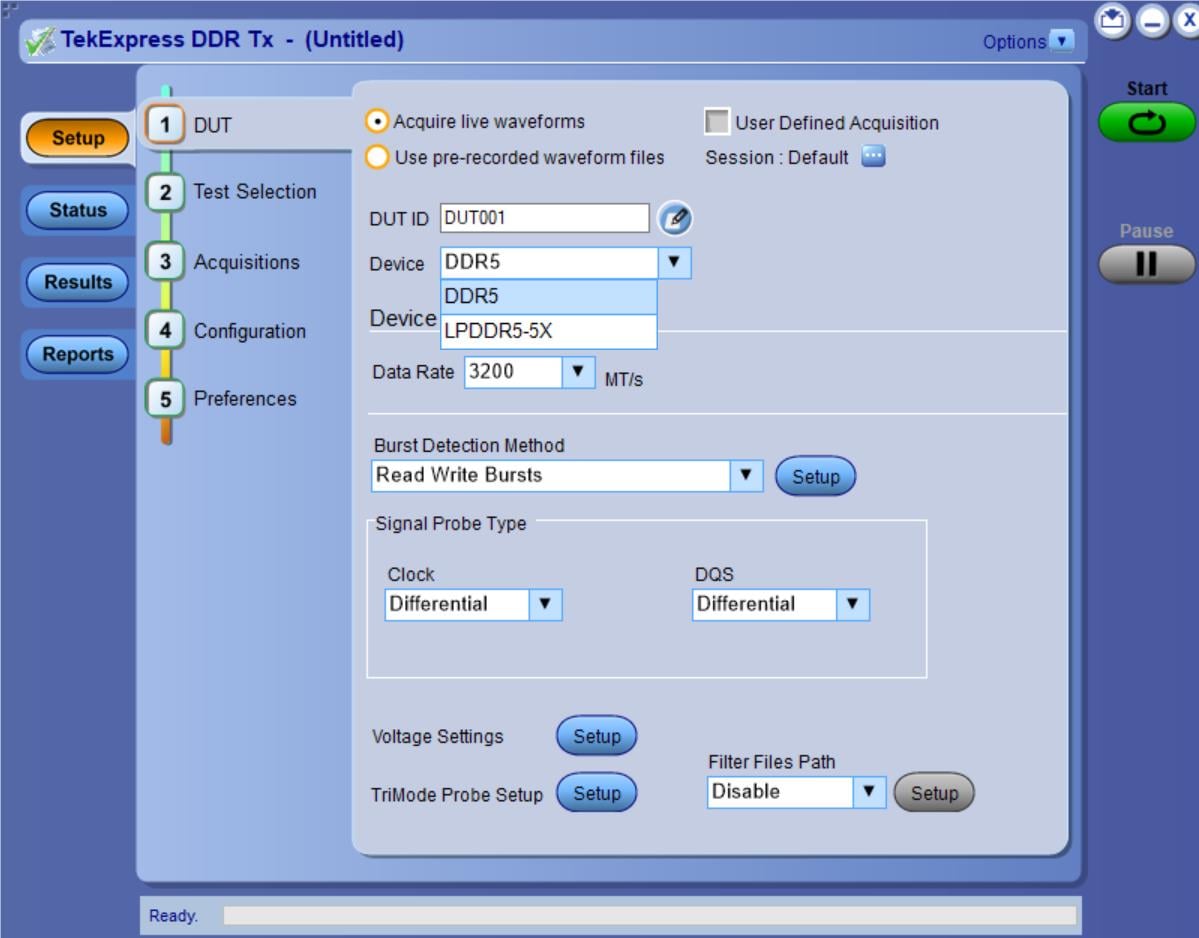
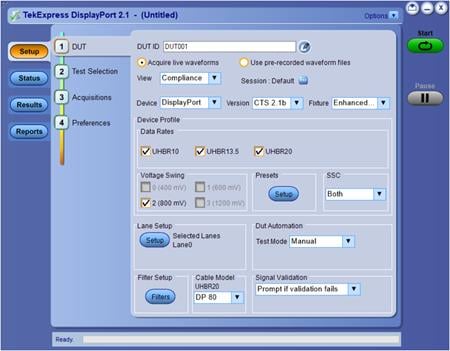
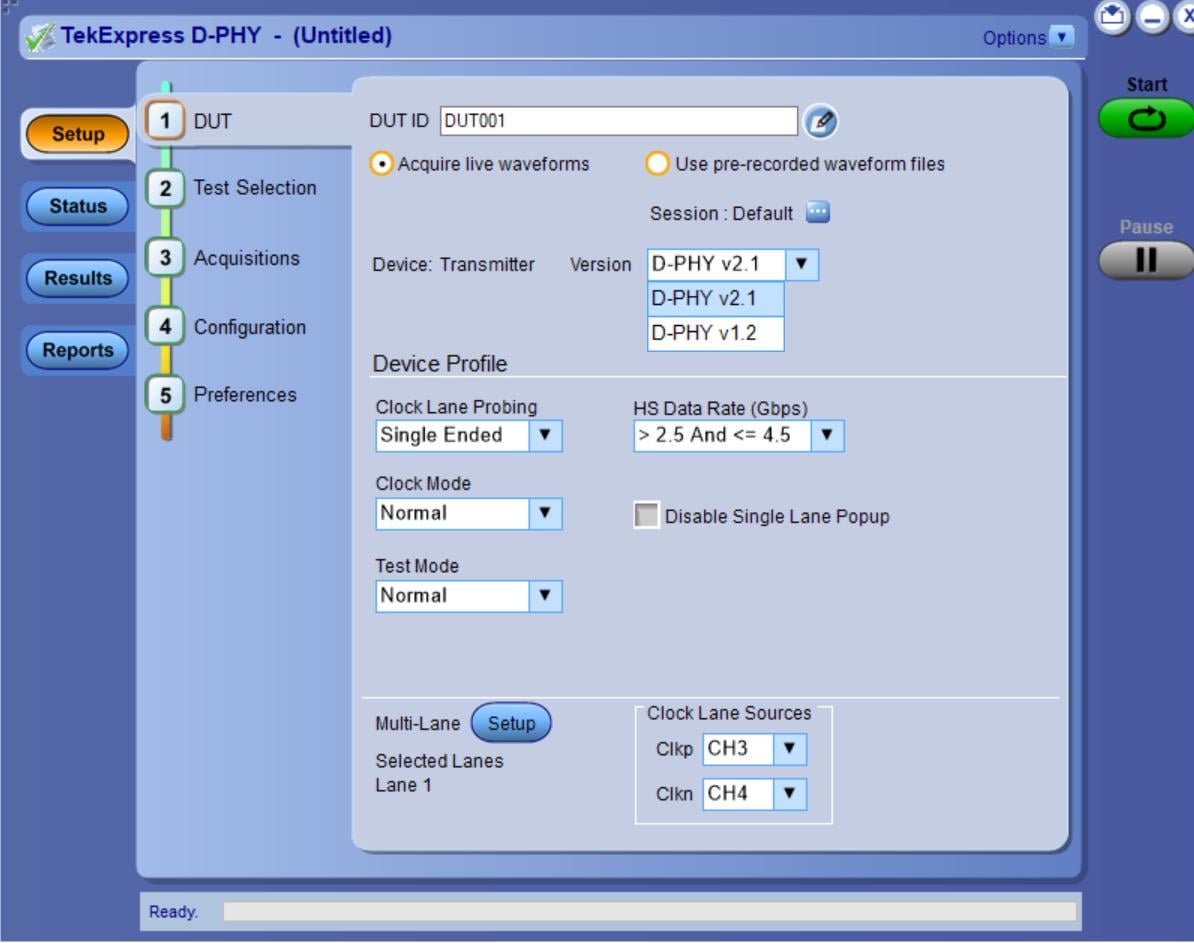
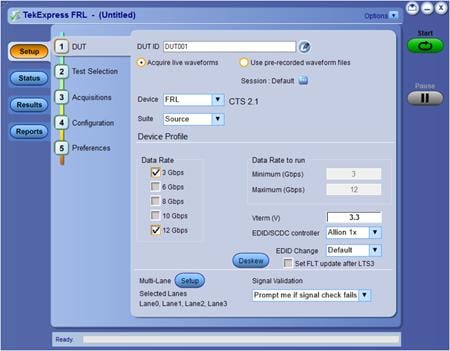
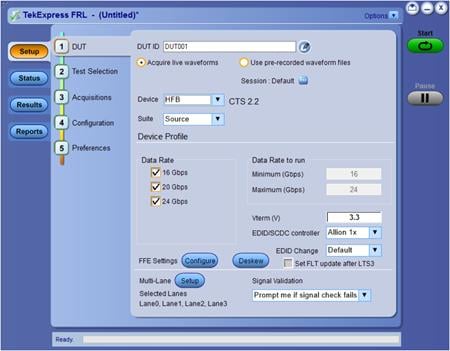
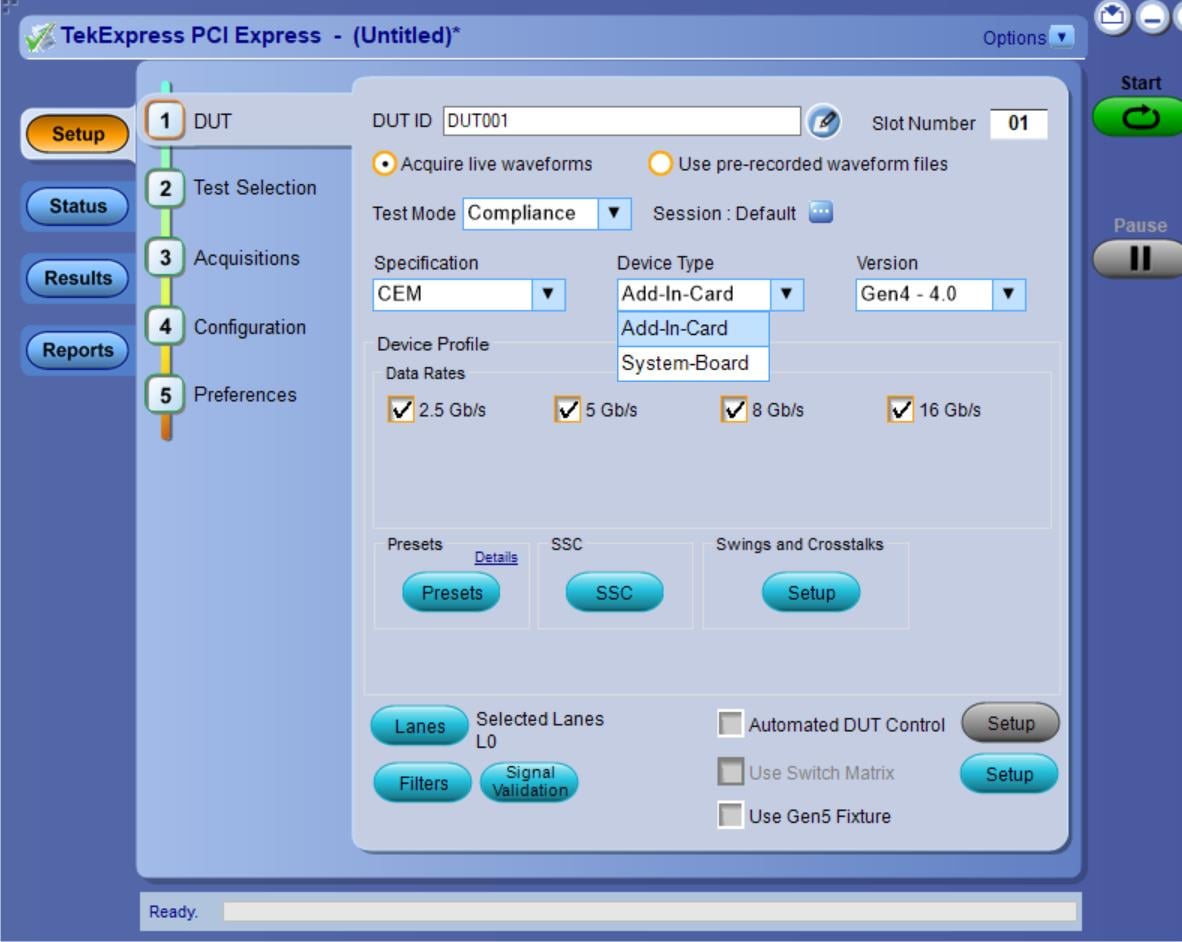
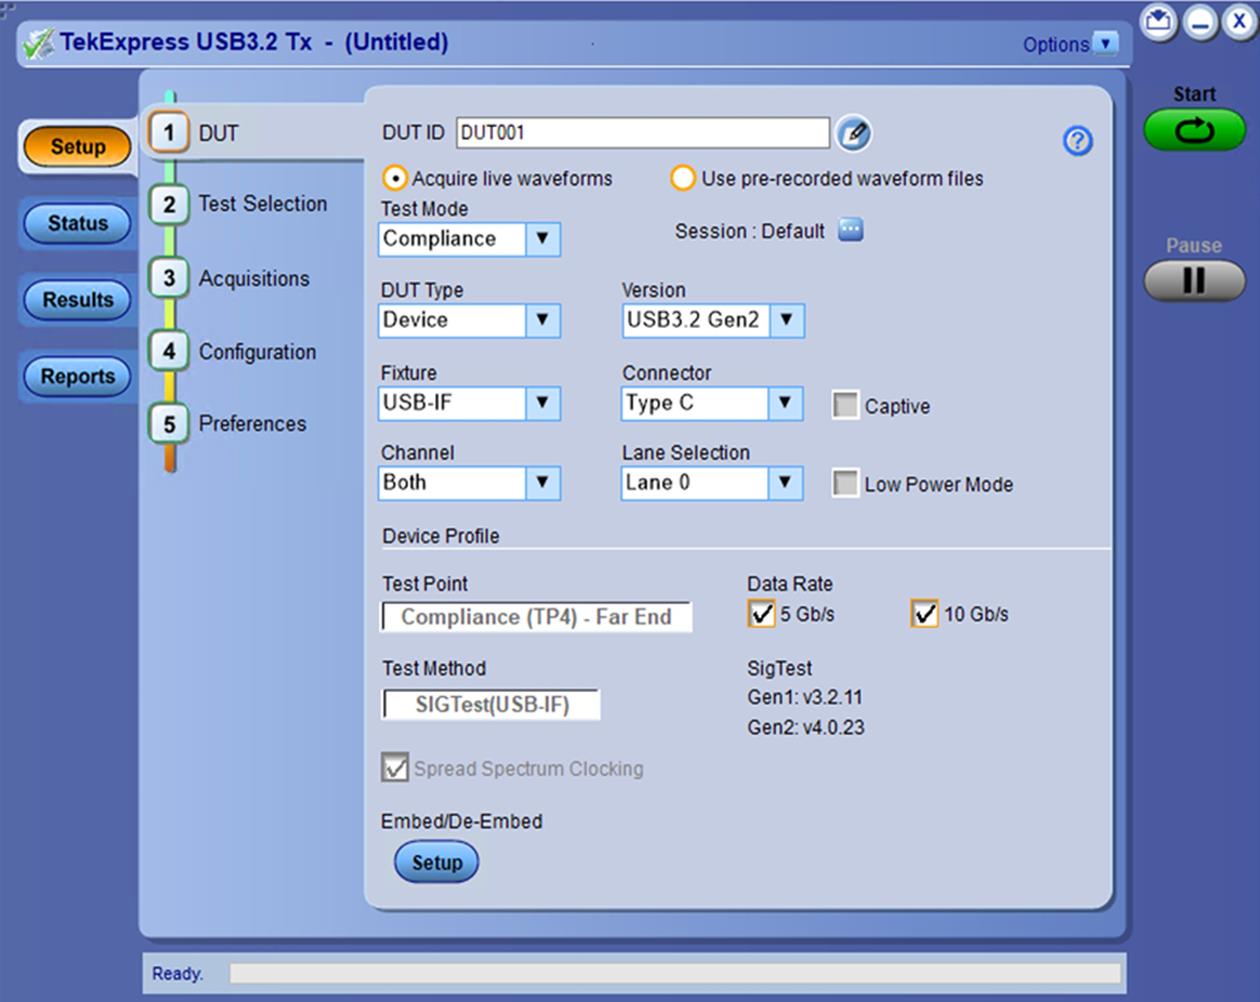
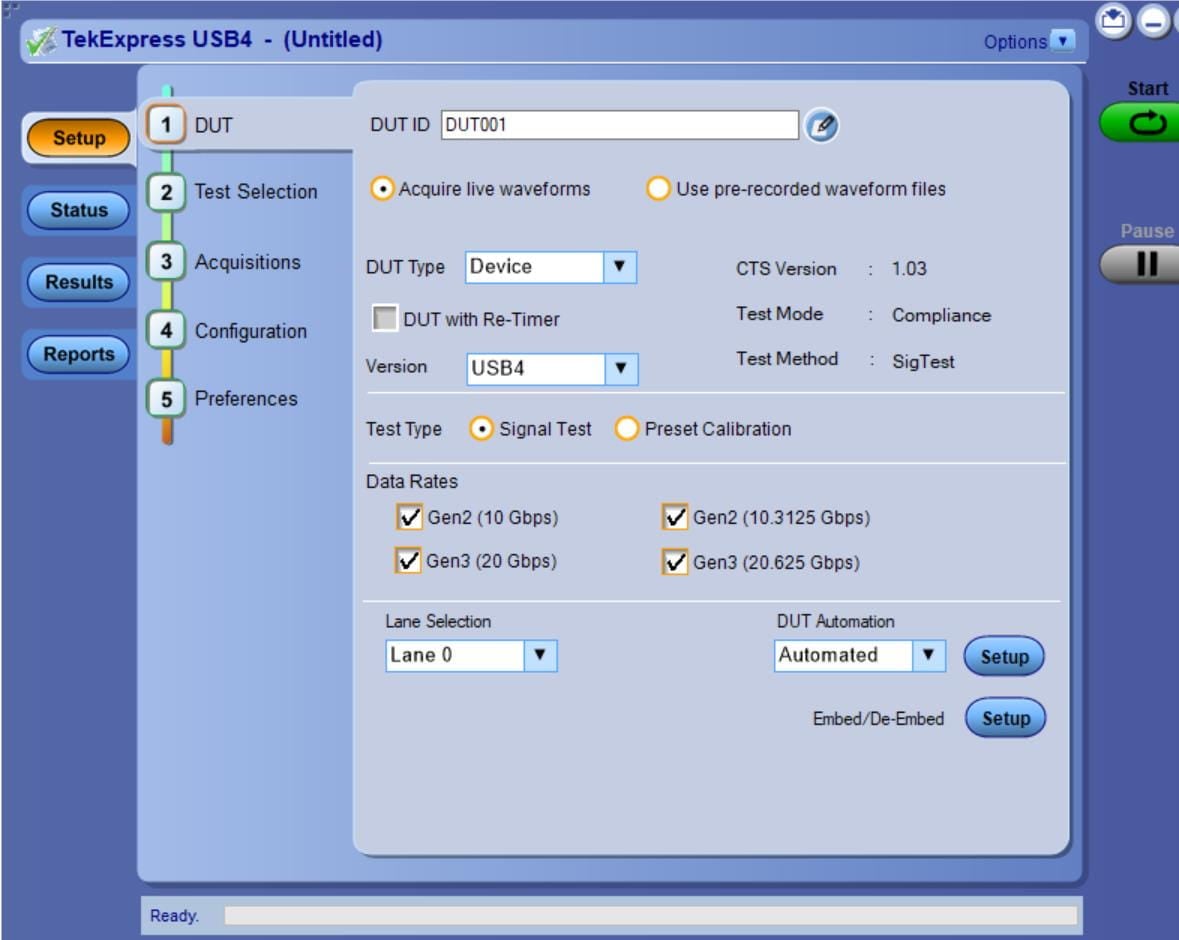
TekExpress® Compliance test (optional)
A key focus area for embedded designers is testing various embedded and interface technologies for compliance. This ensures the device passes the logo certification at plugfests and achieves successful interoperability when working with other compliant devices.
The compliance test specifications for high speed serial standards like USB, Ethernet, Memory, Display and MIPI are developed by the respective consortiums, or governing bodies. Working closely with these consortiums, Tektronix has developed oscilloscope-based compliance applications that not only focus on providing pass/fail results but also provide deeper insight into any failures by providing relevant measurement tools such as jitter and timing analysis to debug failing designs.
These automated compliance applications are built on a framework that provides:
Complete test coverage per the specification.
Fast test times with optimized acquisitions and test sequencing based on customized settings.
Analysis based on previously-acquired signals, allowing the device under test (DUT) to be disconnected from the setup once all acquisitions are completed. This also allows analysis of waveforms acquired on a different oscilloscope or captured at a remote lab, facilitating a very collaborative test environment.
Signal validation during acquisition to ensure the right signals are being captured.
Additional parametric measurements for design debug.
Custom eye diagram mask testing for insight into design margin.
Detailed reports in multiple formats with setup information, results, margins, waveform screenshots and plot images.
SignalVu-PC® vector signal analysis (optional)
The 7 Series DPO offers a high-performance hardware platform designed for demanding RF signal analysis. With a low noise floor, high SFDR, and wide bandwidth supporting multi-channel phase synchronous acquisition, the 7 Series DPO is ideal for capturing and analyzing complex RF environments across broad frequency ranges.
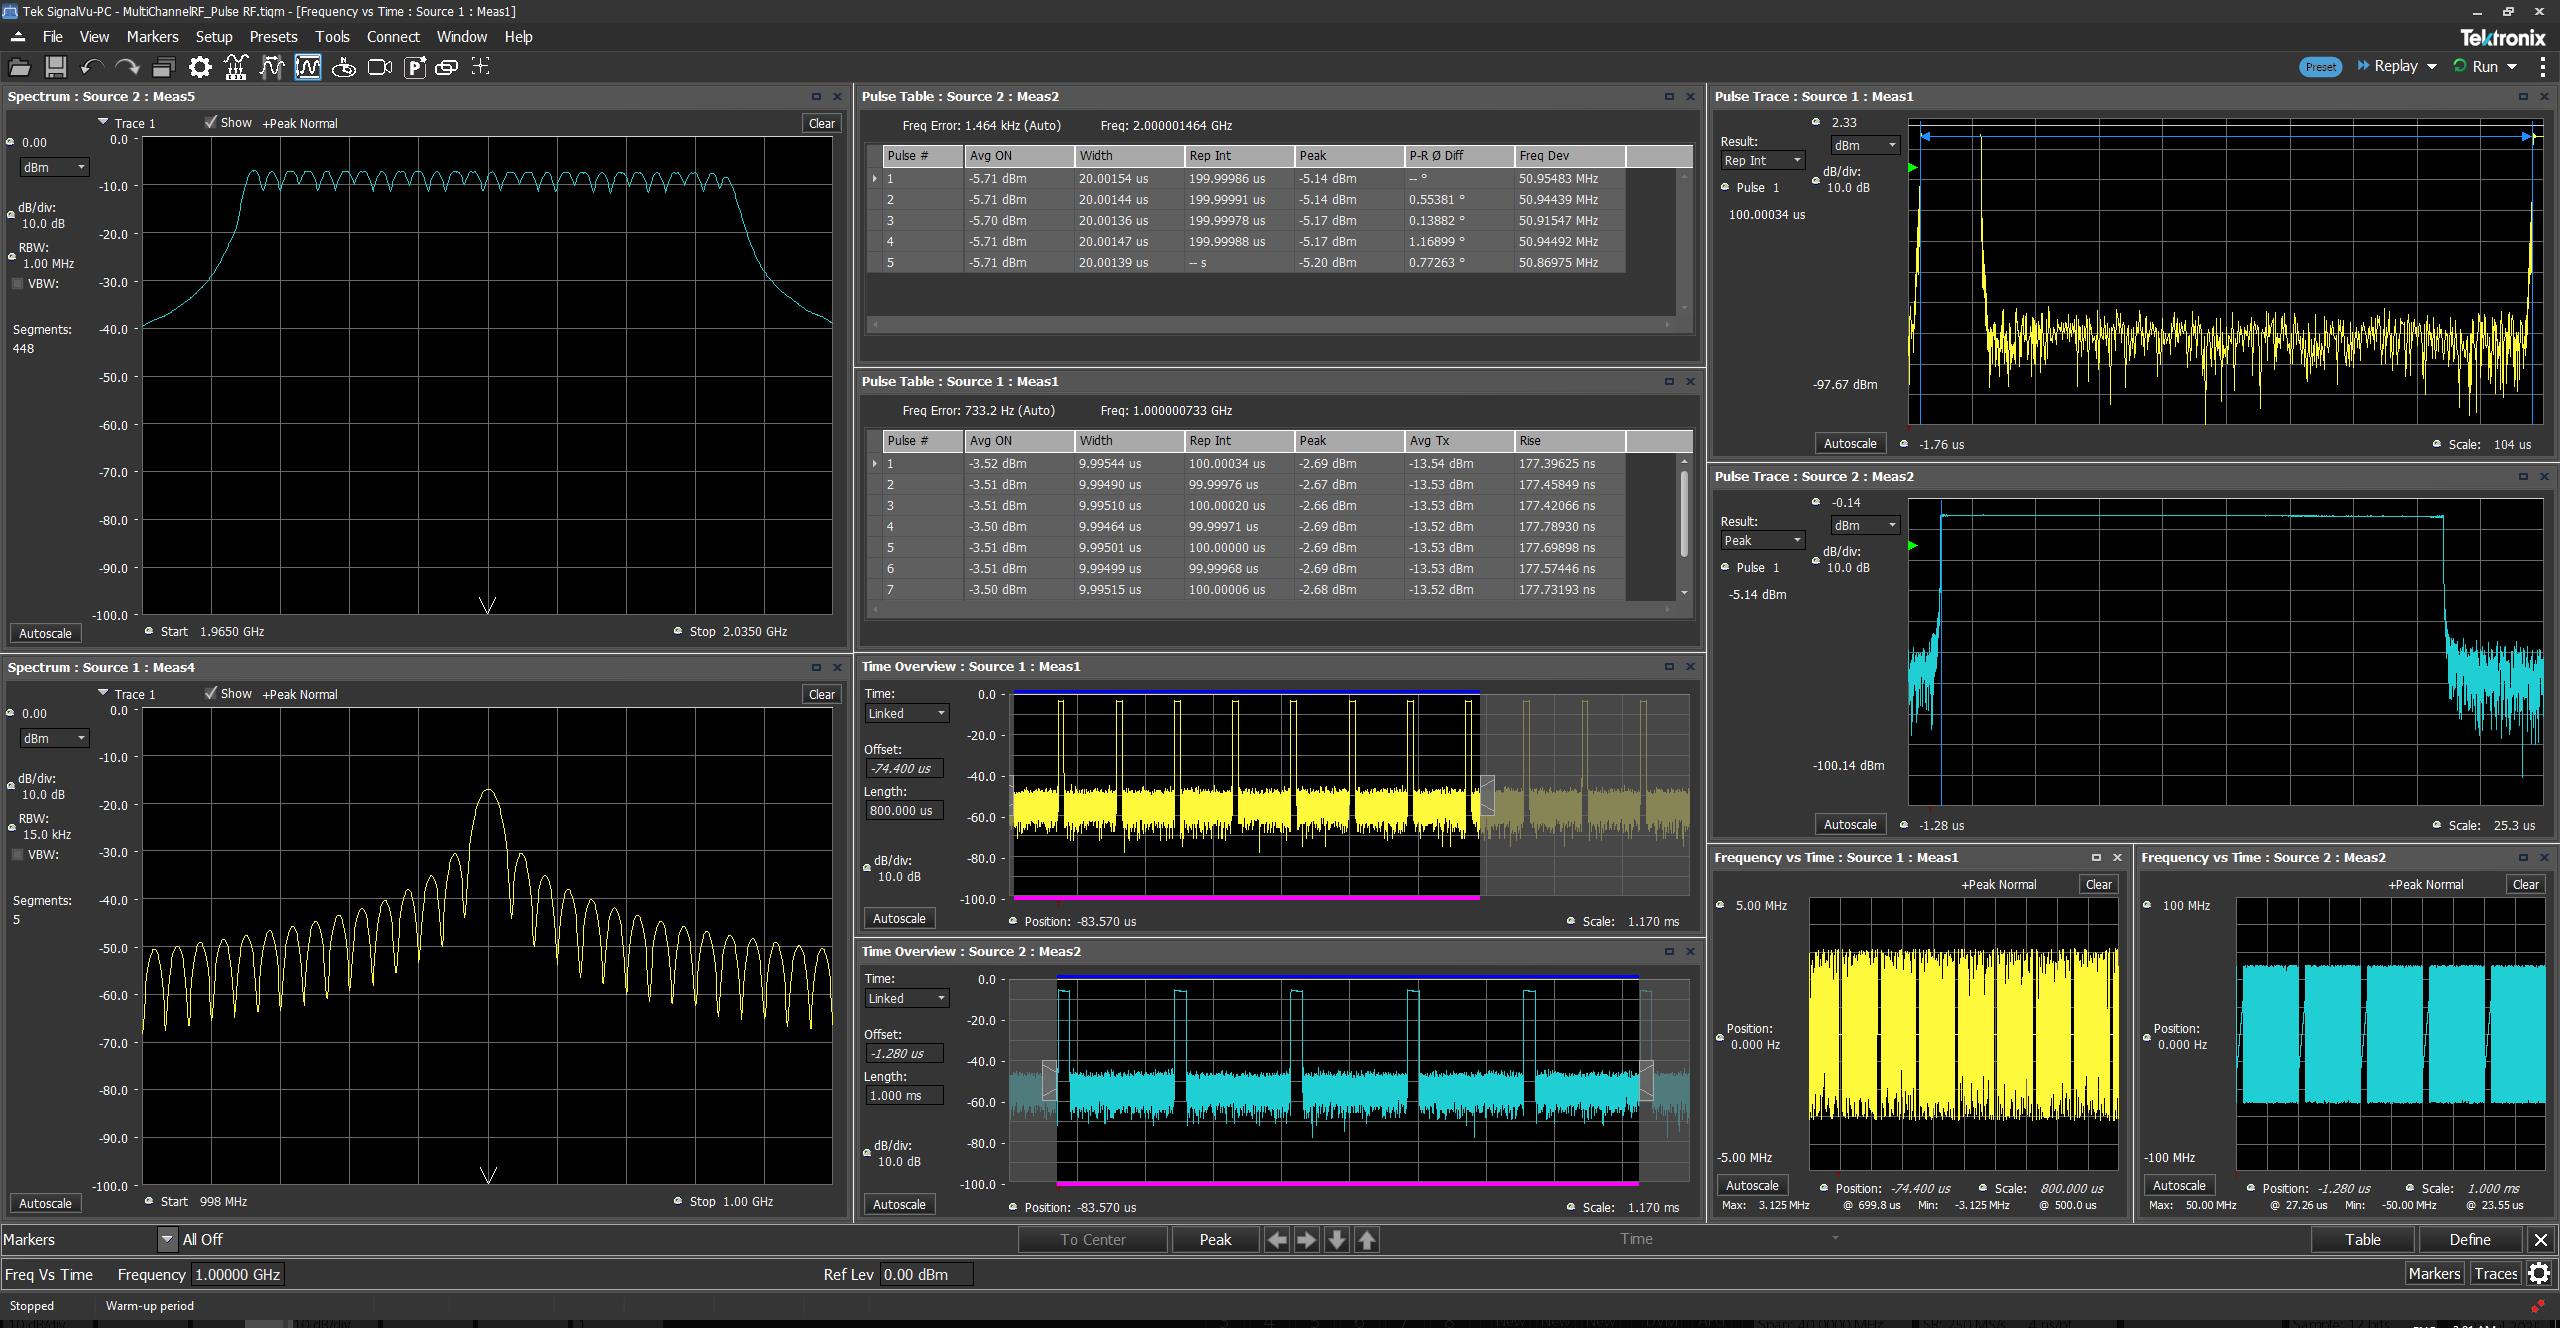
Integrated with the SignalVu-PC vector signal analysis software, the 7 Series DPO becomes a complete solution for advanced RF diagnostics. SignalVu-PC enables rich, synchronized insights across time, frequency, and modulation domains. All measurements in SignalVu-PC are fully time-correlated, allowing users to view how modulation events align with frequency content and time-domain changes. Linked markers across domains provide interactive, synchronized navigation—ideal for analyzing frequency hopping, modulation switching, bandwidth shifts, and transient anomalies.
A key advantage of this solution is the tight integration between software and hardware. SignalVu-PC can directly control scope parameters such as vertical, horizontal scale and triggering. This seamless interaction simplifies setup and ensures consistent signal acquisition and analysis.
The 7 Series DPO supports acquisition of RF, IQ, and differential IQ signals. This allows engineers to examine baseband, IF, and RF signals at various stages of the signal chain.
Data transfer between the 7 Series DPO and SignalVu-PC uses a high-speed serial interface, significantly faster than traditional VISA communication. This results in faster throughput, lower latency, and a more responsive analysis experience, especially when handling large datasets.
Multi-Channel RF Analysis
The 7 Series DPO with SignalVu-PC supports multi-channel acquisition and analysis, enabling simultaneous, phase-synchronous signal analysis across all available channels. Each channel can capture and process wide-bandwidth signals in real time, making the solution ideal for advanced applications such as multi-emitter radar testing, phased-array systems, and electronic warfare analysis.
SignalVu-PC’s general purpose analysis functions—such as spectrum, spectrogram, phase versus time, and amplitude versus time, Pulse radar analysis and General-purpose modulation analysis—are fully available on all channels. This allows not only parallel measurement across multiple channels, but also precise correlation between them. Engineers can analyze amplitude and phase differences between channels to characterize beamforming behavior, signal alignment, or channel-specific anomalies.
For example, SignalVu-PC’s spectrograms, spectra and amplitude quickly provide other views of critical experiment data for specific applications such as Photon Doppler Velocimetry (PDV).
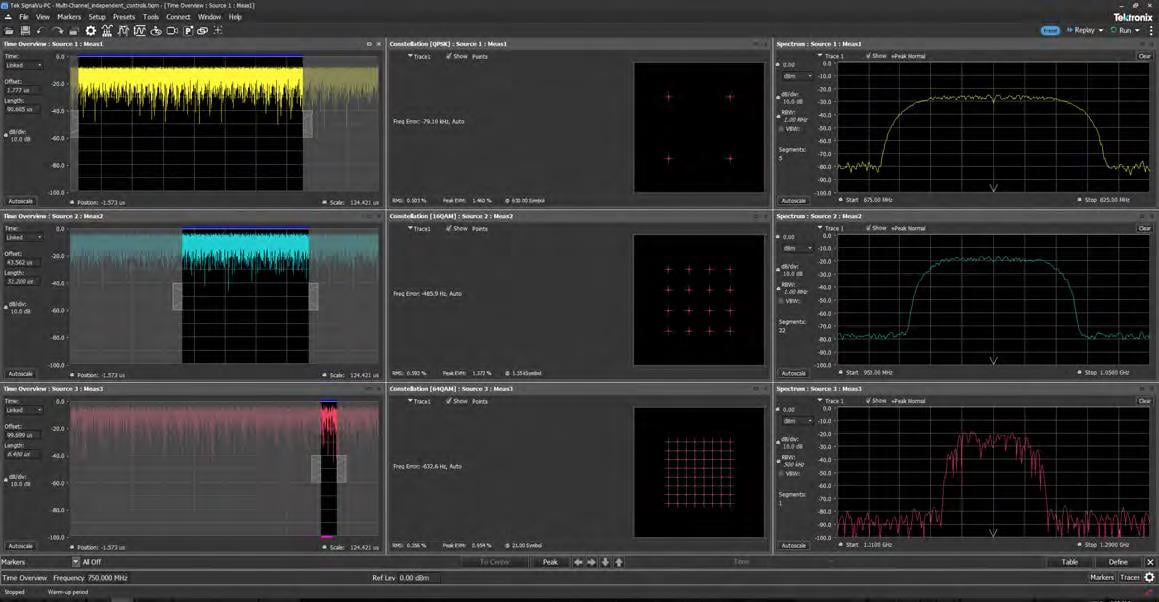
Each channel can be configured independently with its own center frequency, span, resolution bandwidth (RBW), reference level, and time gating. At the same time, global settings allow users to quickly apply the same configuration across all channels when uniformity is required. This flexible setup ensures the system can adapt to both synchronized and independent channel analysis scenarios.
For example as shown above, engineers can simultaneously analyze three different signals—each at a distinct frequency, span, and RBW with different modulation schemes. Each signal can be demodulated at different points in the analysis time, demonstrating the full control and independence available per channel. This capability makes the system an ideal tool for evaluating signal environments with varying modulation formats and time-domain behaviors.
Shared acquisition multi-signal support
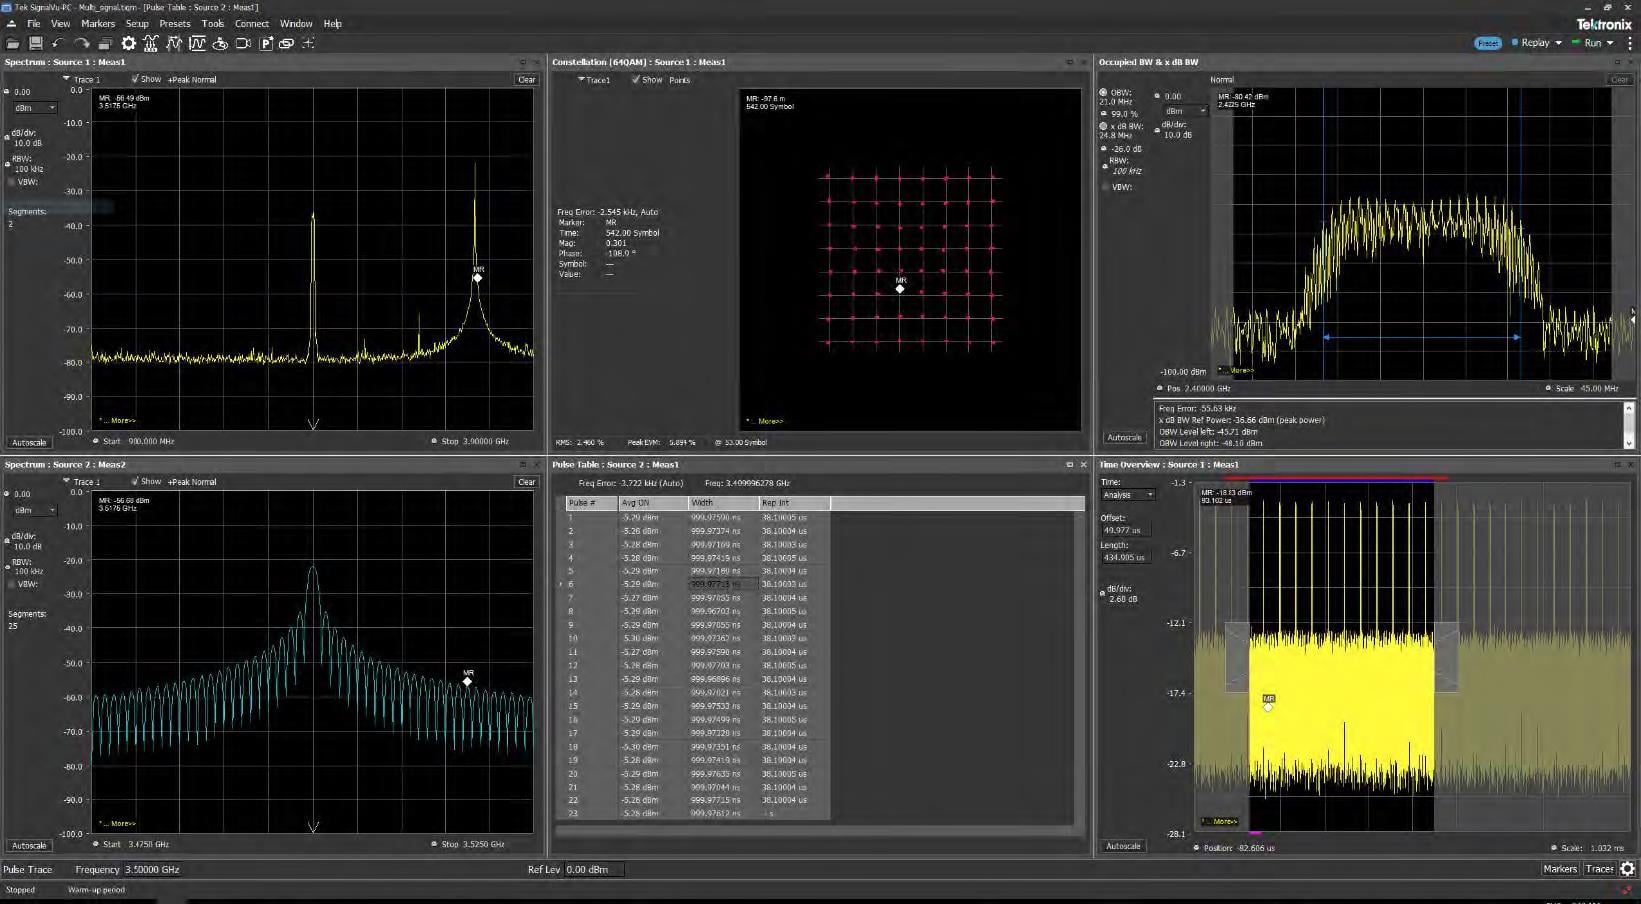
The 7 Series DPO with SignalVu-PC enables advanced analysis of multiple signals captured on a same input channel, an essential capability for environments such as wireless coexistence testing, satcom monitoring and electronic warfare, where emitters of varying types and behaviors may overlap in time or frequency. Each signal within the channel can be isolated, time-gated, and analyzed with its own unique settings—just as in a multi channel configuration.
In the example below, both Source 1 and Source 2 are connected to the same channel. Within Source 1, the spectrum reveals two signals: a modulated communication signal centered at 2.4000 GHz, and a radar pulse centered at 3.5000 GHz. Despite sharing the same acquisition channel, these signals are independently channelized and analyzed. This enables investigation of the phase relationships, timing offsets, or interaction patterns between signals in the same channel—critical in applications involving multi-emitter detection, signal deconfliction.
Advanced pulse analysis (optional)
The Advanced Pulse Analysis package (Opt. SVP) provides 31 individual measurements to automatically characterize long pulse trains.
Designed with your needs in mind
LXI Class C Version 1.6
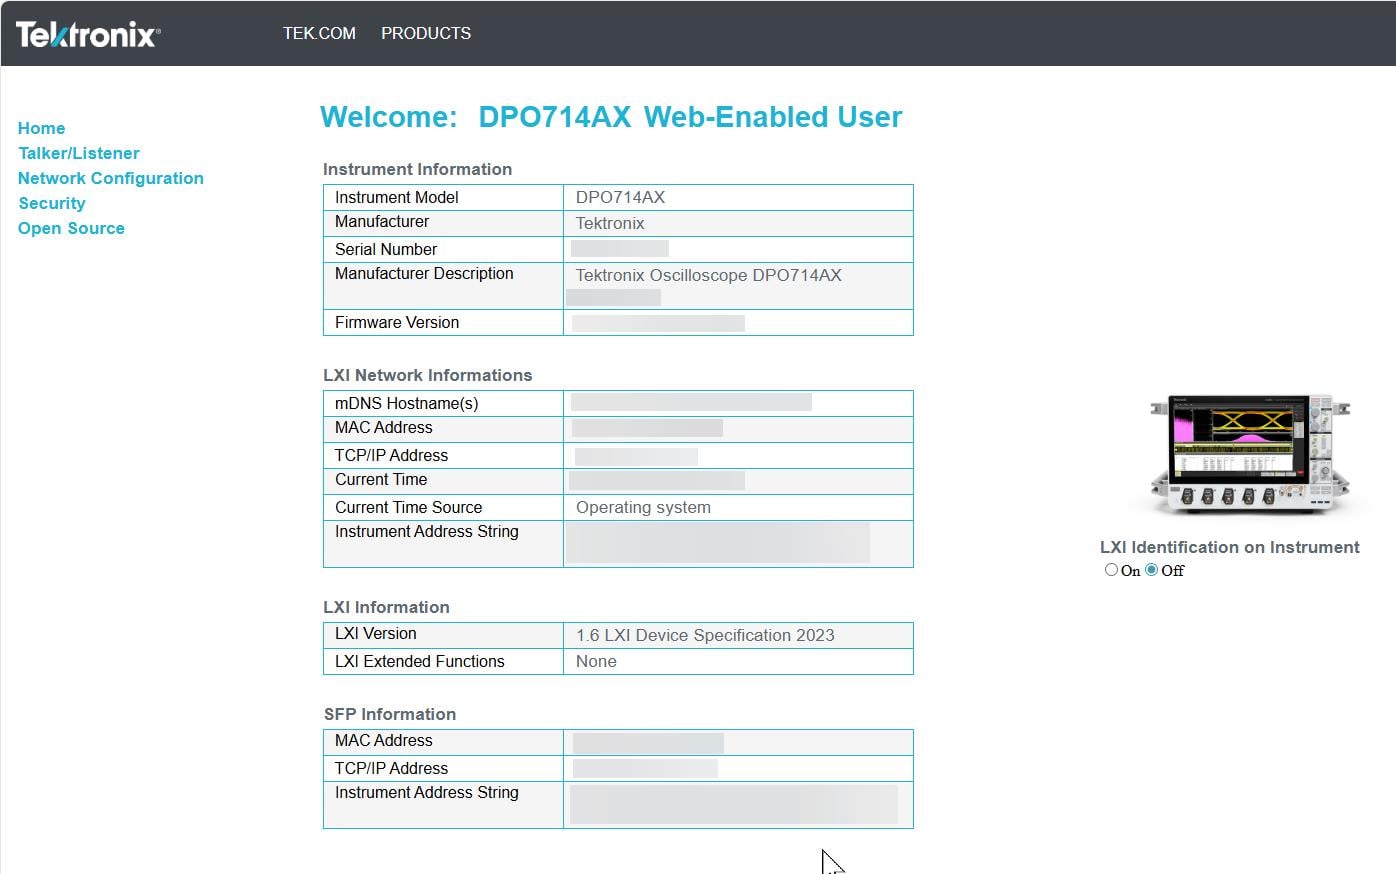
Using the LXI Web Interface, you can connect to the 7 Series through a standard web browser by simply entering the oscilloscope’s IP address in the address bar of the browser. The web interface enables viewing of instrument status and configuration, as well as status and modification of network settings. All web interaction conforms to the LXI Class C Version 1.6 specification for Windows OS or LXI Class C Version 1.5 specification for Embedded (Linux) OS.
Upgrade Automated Test Equipment (ATE) systems quickly and smoothly
Anyone working closely with automated test systems knows that moving to a new model or platform can be painful. Modifying an existing codebase for a new product can be prohibitively expensive and complicated. Now there's a solution.
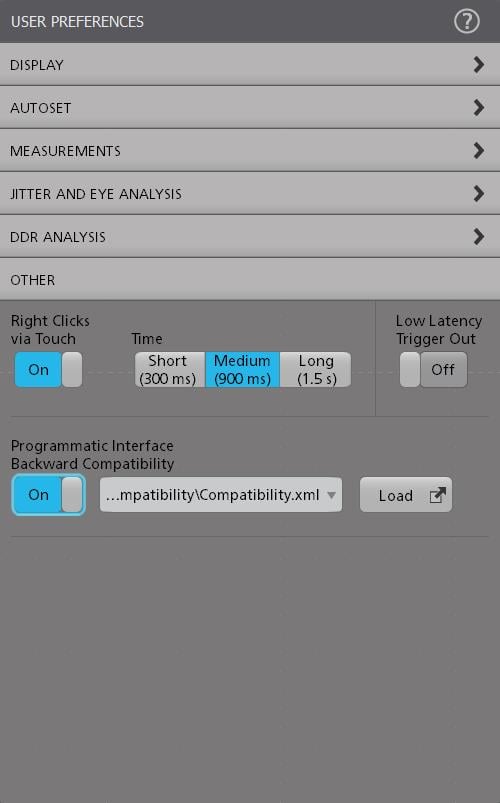
All 7 Series DPO’s include a Programmatic Interface (PI) Translator. When enabled, the PI Translator acts as an intermediate layer between your test application and the oscilloscope. It recognizes a subset of legacy commands from the popular DPO70000C/DX/SX platforms and translates them on the fly into supported commands for the 7 Series DPO. The Translator interface is designed to be human- readable and easily extensible, which means that you can customize its behavior to minimize the amount of effort required when transitioning to your new oscilloscope.
Remote operation to improve collaboration
Want to collaborate with a design team on the other side of the world?
The included e*Scope® capability enables fast control of an oscilloscope running the Embedded Operating System over a network connection. This can be viewed from any PC or device through a standard web browser.
Simply enter the IP address or network name of the oscilloscope and a web page will be served to the browser. Control the oscilloscope remotely in the exact same way that you do in-person using the built-in touchscreen. Alternatively for oscilloscopes with the Microsoft Windows 10 Operating System, you can use Windows Remote Desktop™ to connect directly to the instrument and control it remotely.
The TekVISA™ I/O library is included for using and enhancing Windows applications for data analysis and documentation. IVI-COM instrument drivers are included to enable easy communication with the oscilloscope using LAN or USBTMC connections from an external PC.
Utilize TekHSI(tm) framework to dramatically speed up data transfer from the 7 Series DPO to an external PC.
With a programmer's manual and a GitHub site, you have many commands and examples to help you get started.
Get the analysis capability of an award-winning oscilloscope on your PC. Analyze waveforms anywhere, anytime. The basic license lets you view and analyze waveforms, perform many types of measurements and decode the most common serial buses - all while remotely accessing your oscilloscope. Advanced license options add capabilities such as jitter analysis and more serial bus decoding options.
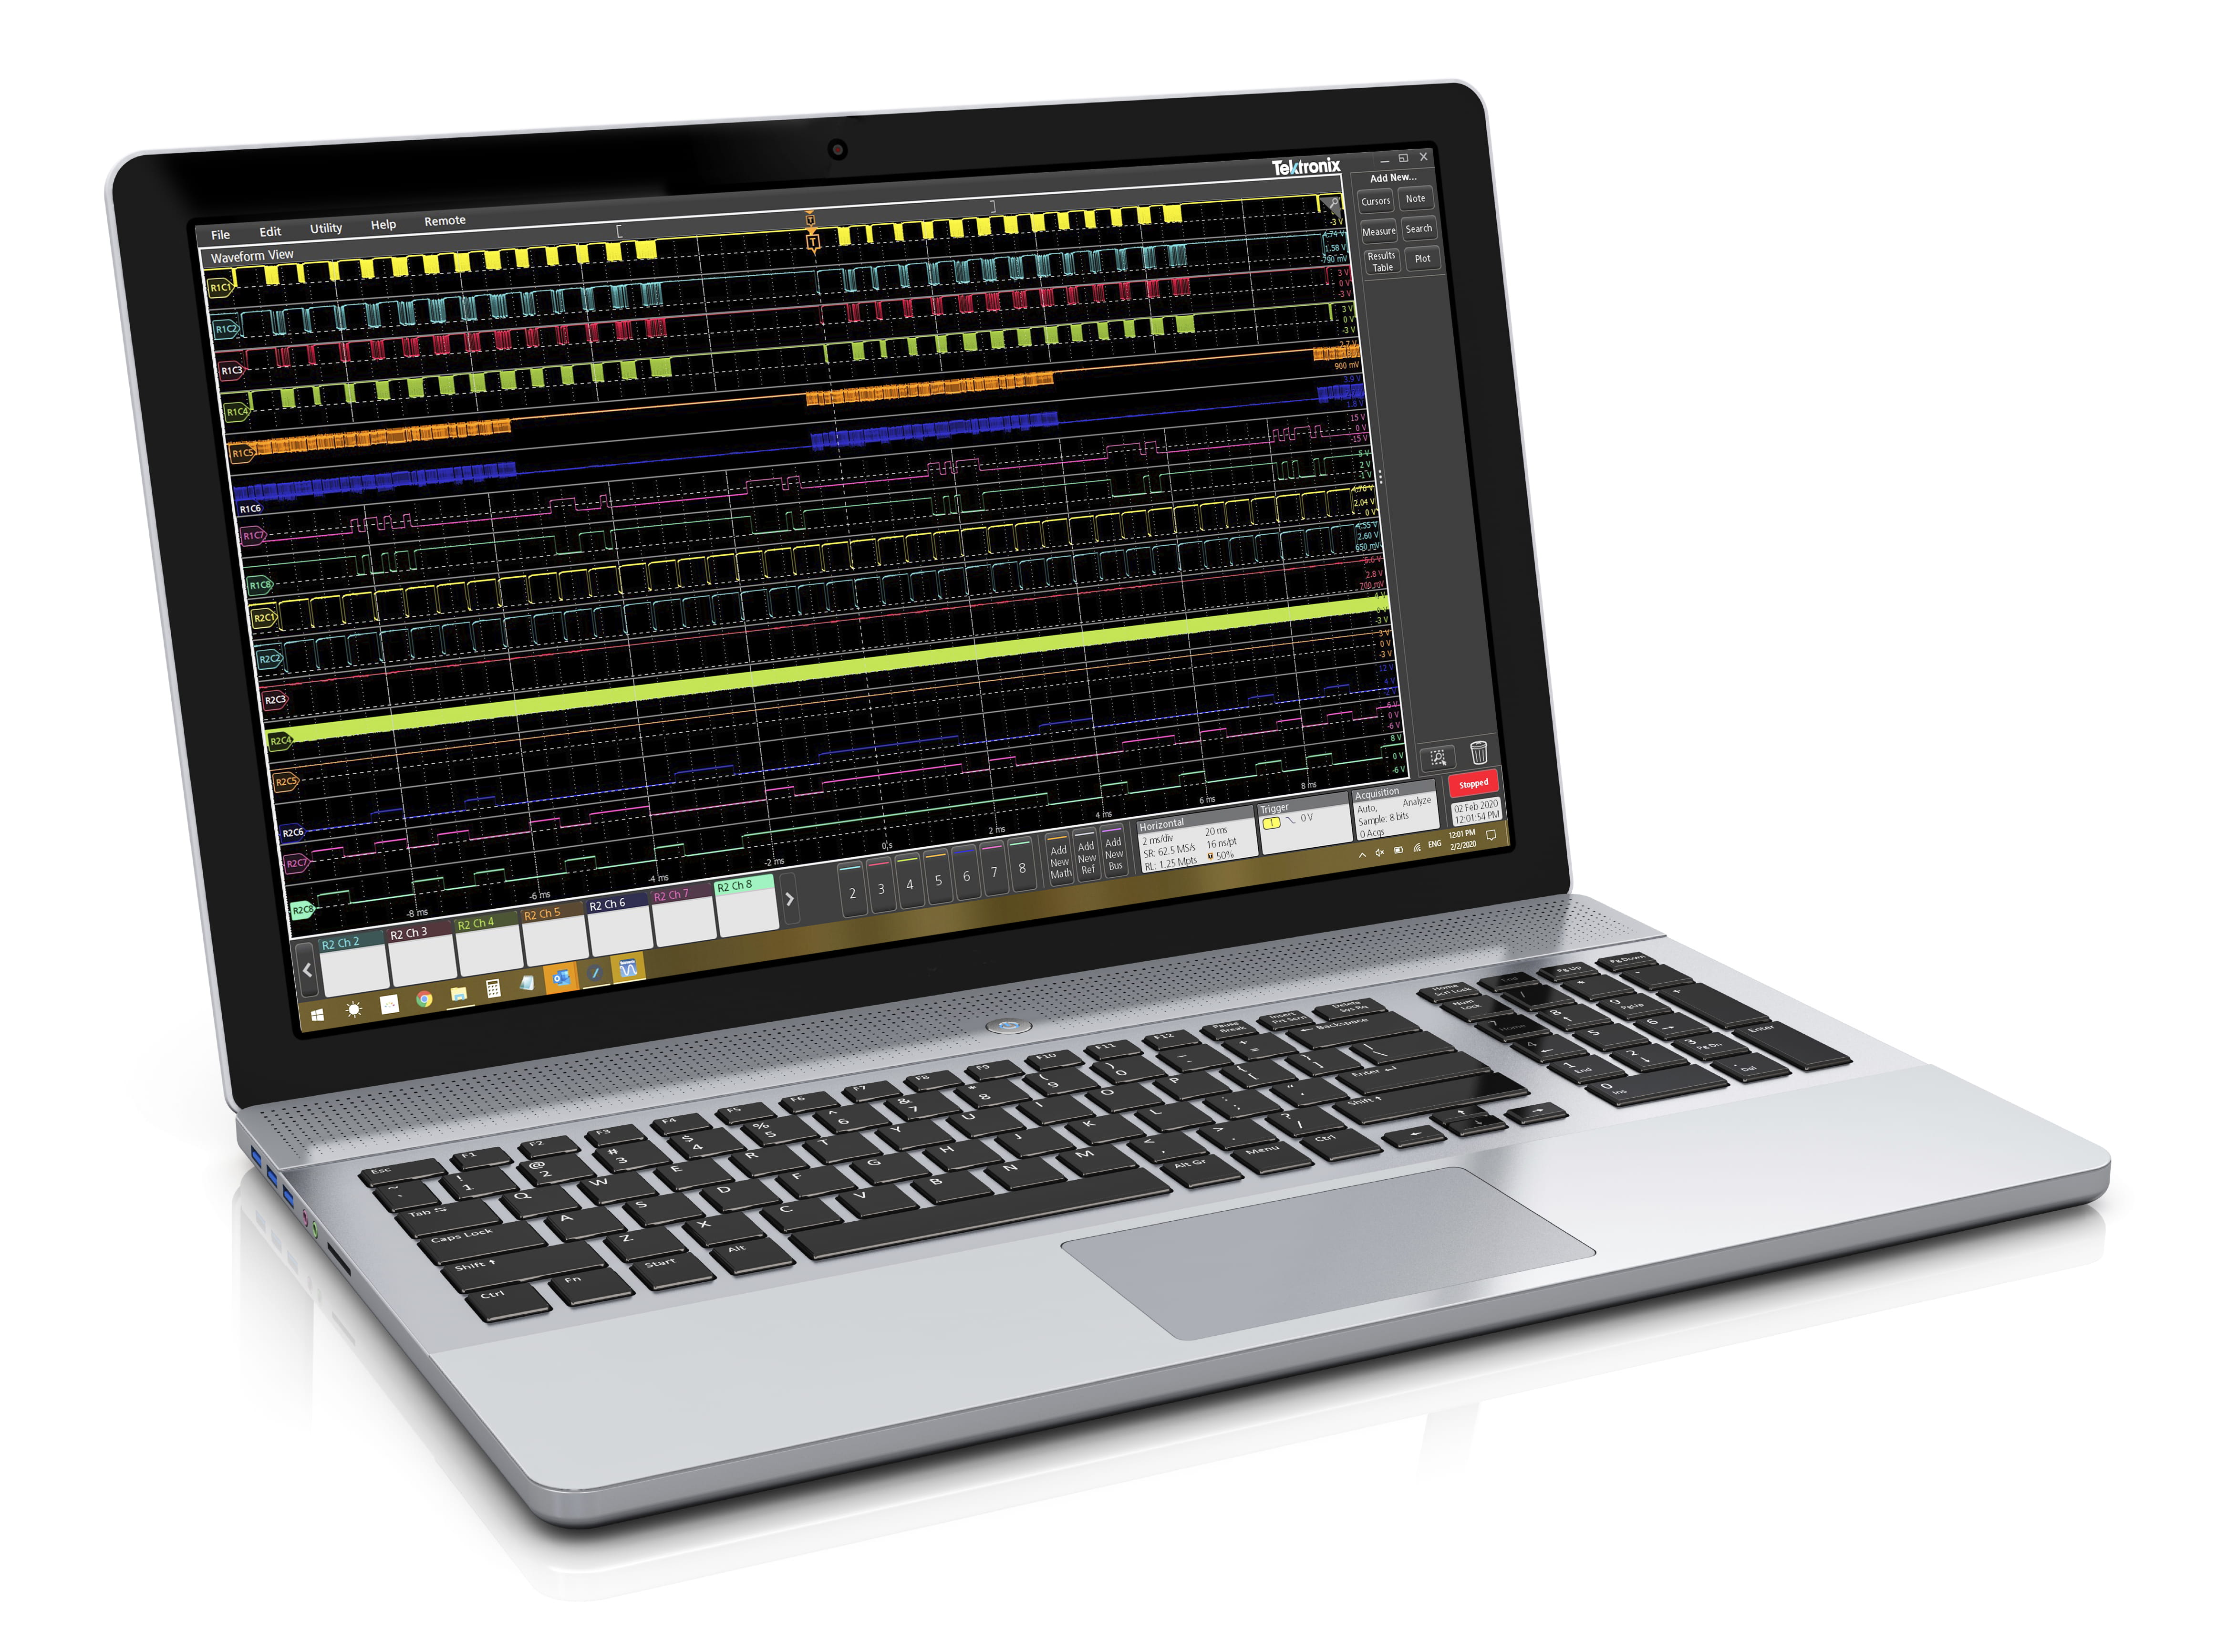
Key features of the TekScope PC analysis software for the 7 Series DPO include:
Recall Tektronix oscilloscope sessions and waveform files from the equipment made by Tektronix and other vendors
Waveform file formats supported include .wfm, .isf, .csv, .h5, .tr0, .trc, and .bin
Remotely connect to the Tektronix 4/5/6/7 Series to acquire data in real-time
Share data remotely with your colleagues so that they can perform analysis and make measurements as if they were sitting in front of the oscilloscope
Synchronize waveforms from the multiple oscilloscopes in real-time
Perform advanced analysis even if your oscilloscope isn't equipped with TekScope PC analysis software
TekDrive collaborative test and measurement workspace
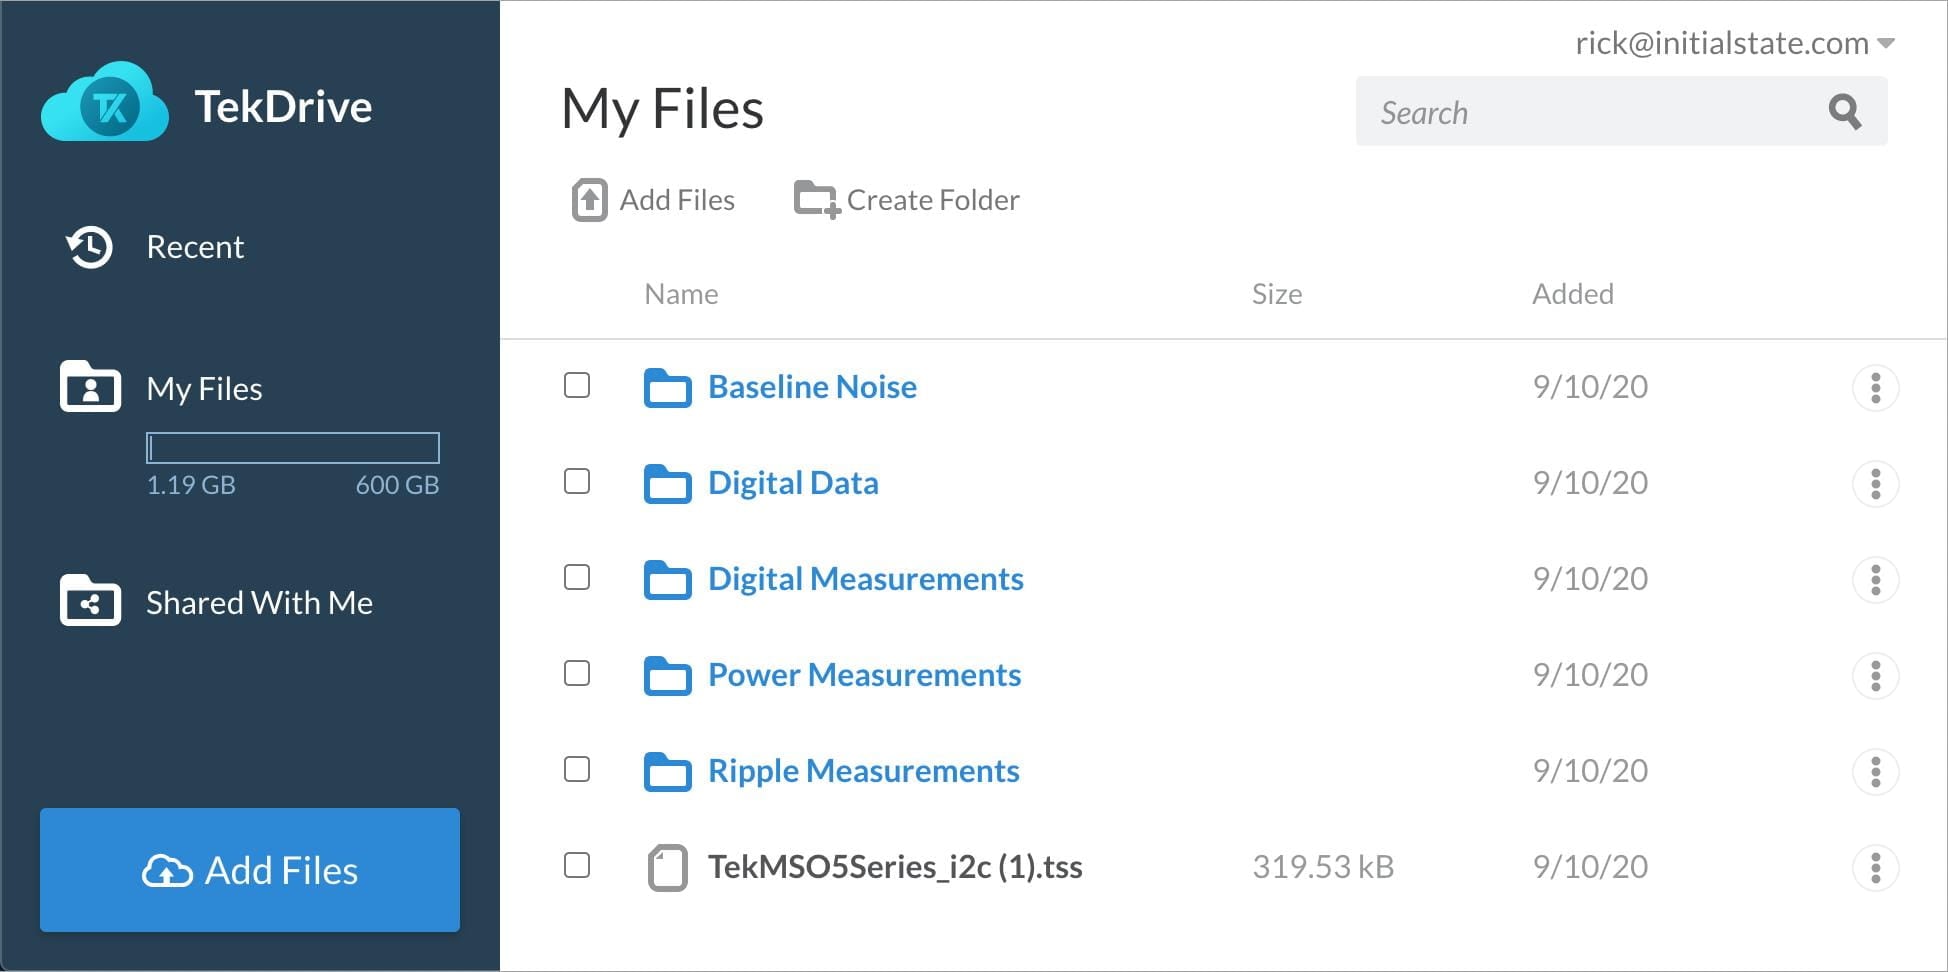
Using TekDrive, you can upload, store, organize, search, download, and share any file type from any connected device. TekDrive is natively integrated into the instrument for seamless sharing and recalling of files - no USB stick is required. Analyze and explore standard files like .wfm, .isf, .tss, and .csv, directly in a browser with smooth interactive waveform viewers. TekDrive is purpose built for integration, automation, and security.
Arbitrary Function Generator (AFG)
The instrument contains an optional integrated arbitrary function generator, perfect for simulating sensor signals within a design or adding noise to signals to perform margin testing. The integrated function generator provides output of predefined waveforms for sine, square, pulse, ramp/triangle, DC, noise, sin(x)/x (Sinc), Gaussian, Lorentz, exponential rise/decay, Haversine and cardiac. The AFG can load waveform records up to 128 k points in size from an internal file location or a USB mass storage device.
The AFG feature is compatible with Tektronix' ArbExpress PC-based waveform creation and editing software, making creation of complex waveforms fast and easy.
Trigger Frequency Counter
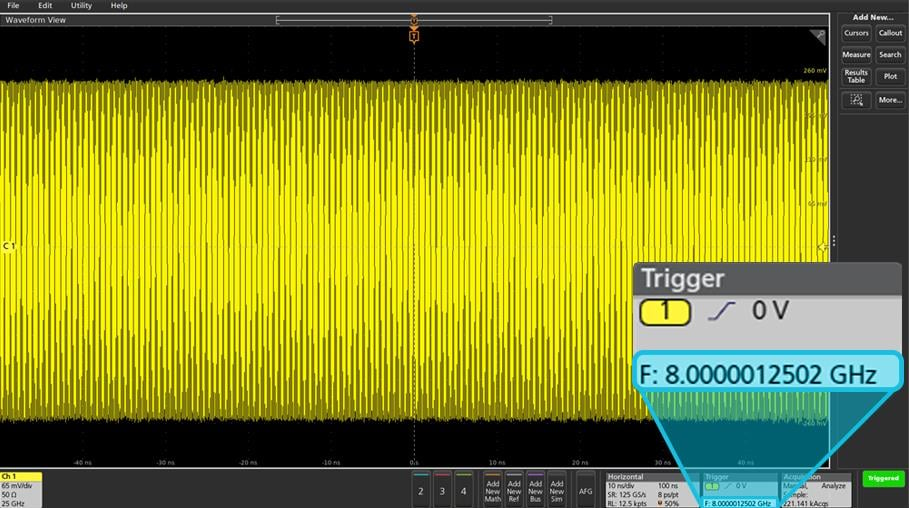
The instrument contains an integrated 11-digit trigger frequency counter. The trigger frequency counter provides a very precise readout of the frequency of the trigger event on which you’re triggering.
The trigger frequency counter is available for free and is activated when you register your 7 Series oscilloscope.
Enhanced security
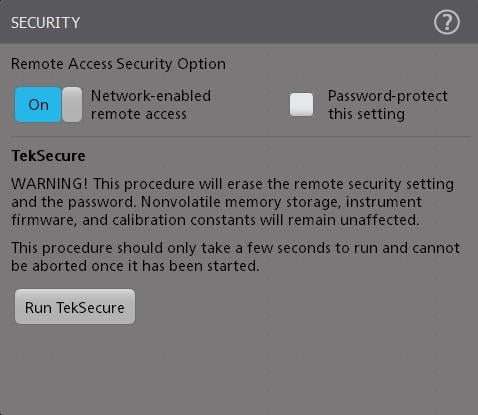
The 7 Series DPO provides you with the option to protect company data through the Security menu. This includes the option to restrict access to the instrument by password-protecting remote network access, I/O ports, and firmware updates to ensure the security of the data. By default, the oscilloscope disables remote access on initial use and gives you the option to enable remote access with or without a password.
To clear user data, run TekSecure from the menu. Sanitize the oscilloscope by removing the SSD from the rear of the instrument and removing power to the instrument for 30 seconds.
Option Asset Management
Option asset management: floating or node-locked (fixed).
Many Tektronix application solutions and hardware options are enabled with an encrypted license key that is entered through the oscilloscope's Utilities menu. You now have two options:
The first option is a node-locked license applied to a specific scope serial number and is permanently enabled. A node-locked license cannot be moved from one oscilloscope to another.
The second option is a floating license. Floating licenses provide the capability to move a license-key enabled option from one oscilloscope to another. This capability helps users with distributed teams and several Tektronix 7 Series oscilloscopes to better manage their assets and deploy applications or other options such as extended memory to the oscilloscope where it is needed.
Managing and deploying floating licenses uses an easy online licensing management system. All floating license management functions are maintained on Tektronix secure servers and no infrastructure or your company IT department involvement is necessary. Simply utilize your tek.com account to access, track, and deploy your oscilloscope floating- license enabled options.
Help when you need it
Several helpful resources are included so you can get your questions answered rapidly without having to find a manual or go to a website:
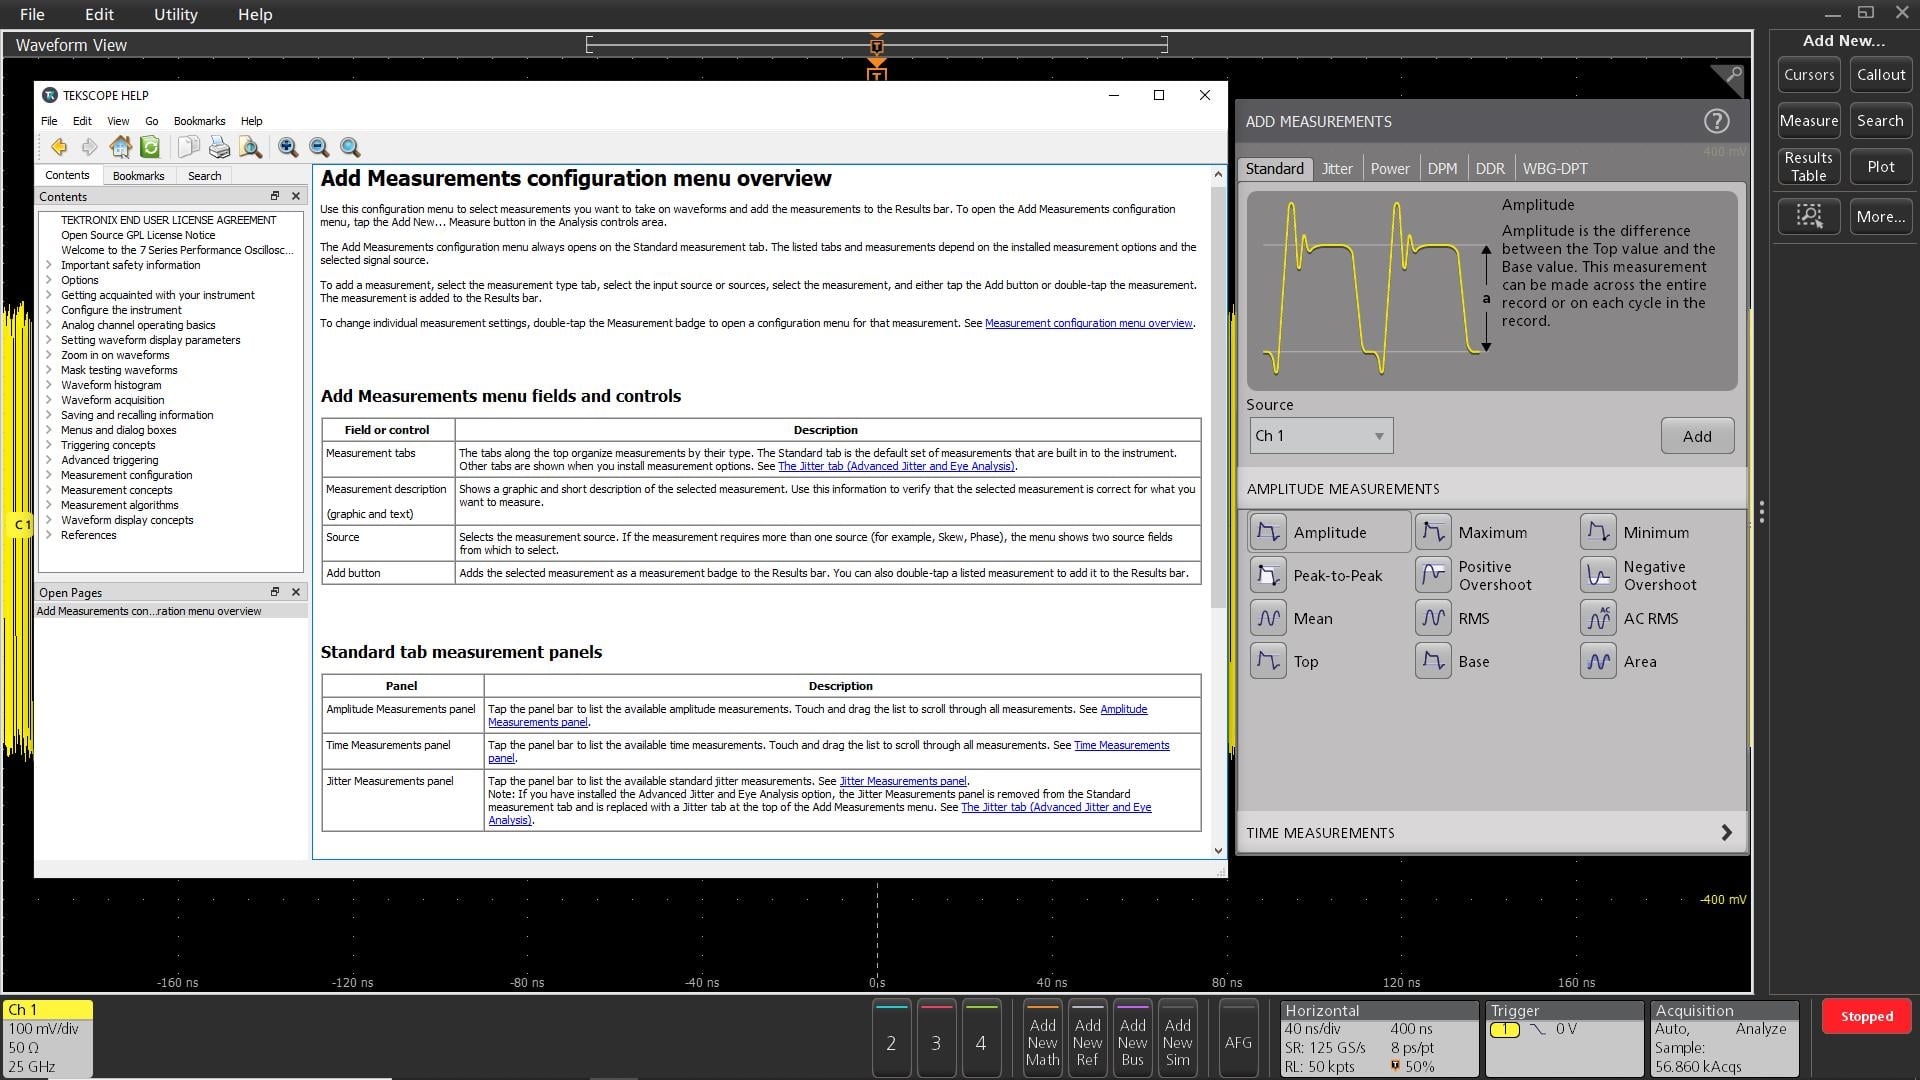
Graphical images and explanatory text are used in numerous menus to provide quick feature overviews.
All menus include a question mark icon in the upper right that takes you directly to the portion of the integrated help system that applies to that menu.
Figure 7. Integrated help answers your questions rapidly without having to find a manual or go to the internet.
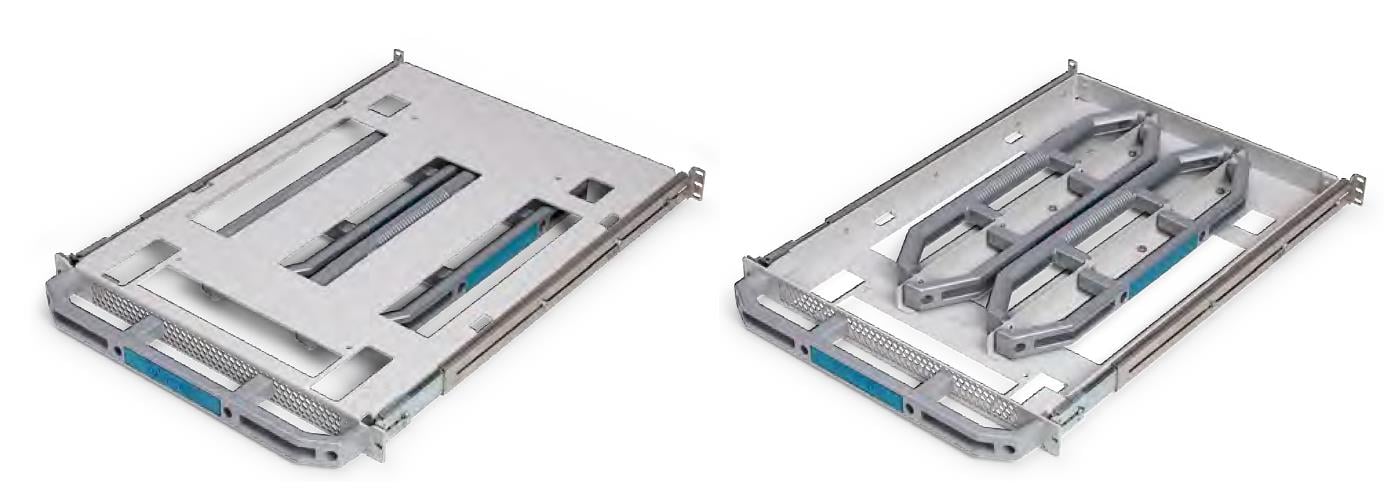
RM7 Custom rackmount kit for your 7 Series
Tektronix has developed the RM7, a custom-engineered, 1U rack mount that enables installation of any 7 Series DPO instrument into a standard 19-inch wide equipment rack.
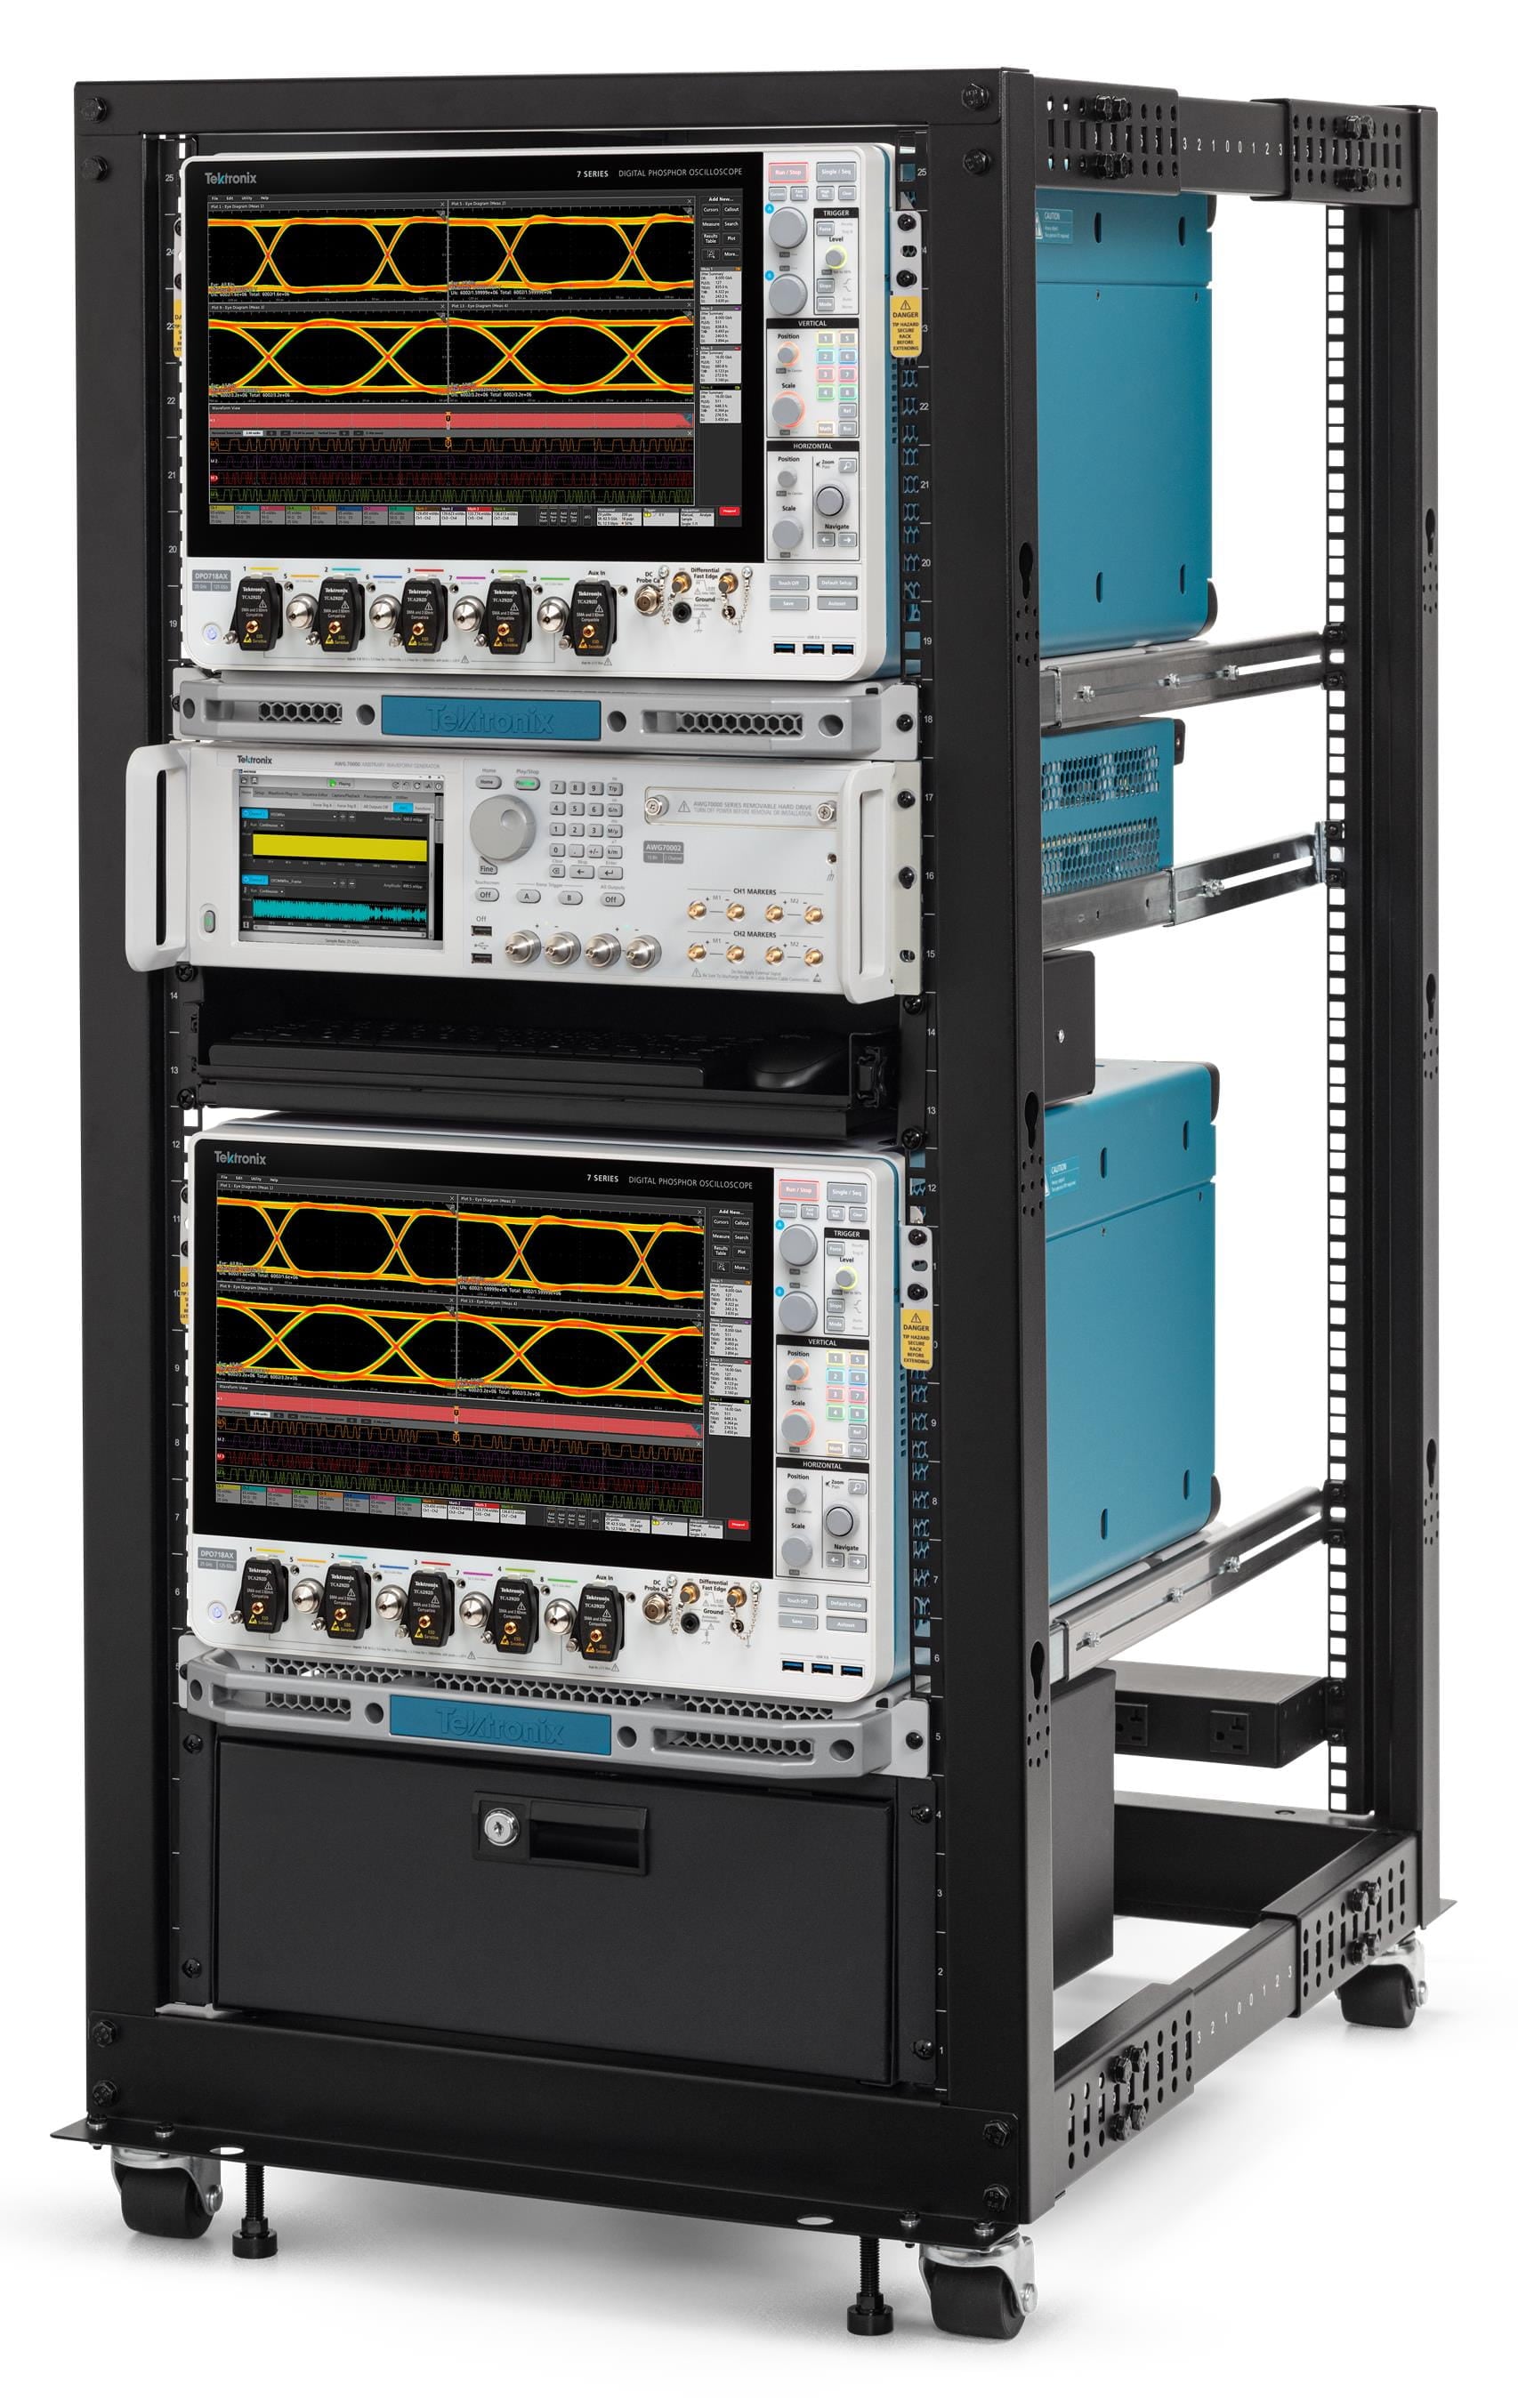
Slides fit racks of 20-36 inch depth
Draws air from front grill (behind rack handle) and exhausts to rear in 7 Series DPO instrument
Only need to remove and store 4 handles (provision to store all 4 handles on bottom of rack tray) – no need to remove instrument covers
Rack slides enable pulling 7 Series DPO from rack to access rear of instrument (e.g., access removable SSD or install/remove cables)
Comes with M5 screws and rack nuts
HC7B custom transit case to safely transport and protect your 7 Series
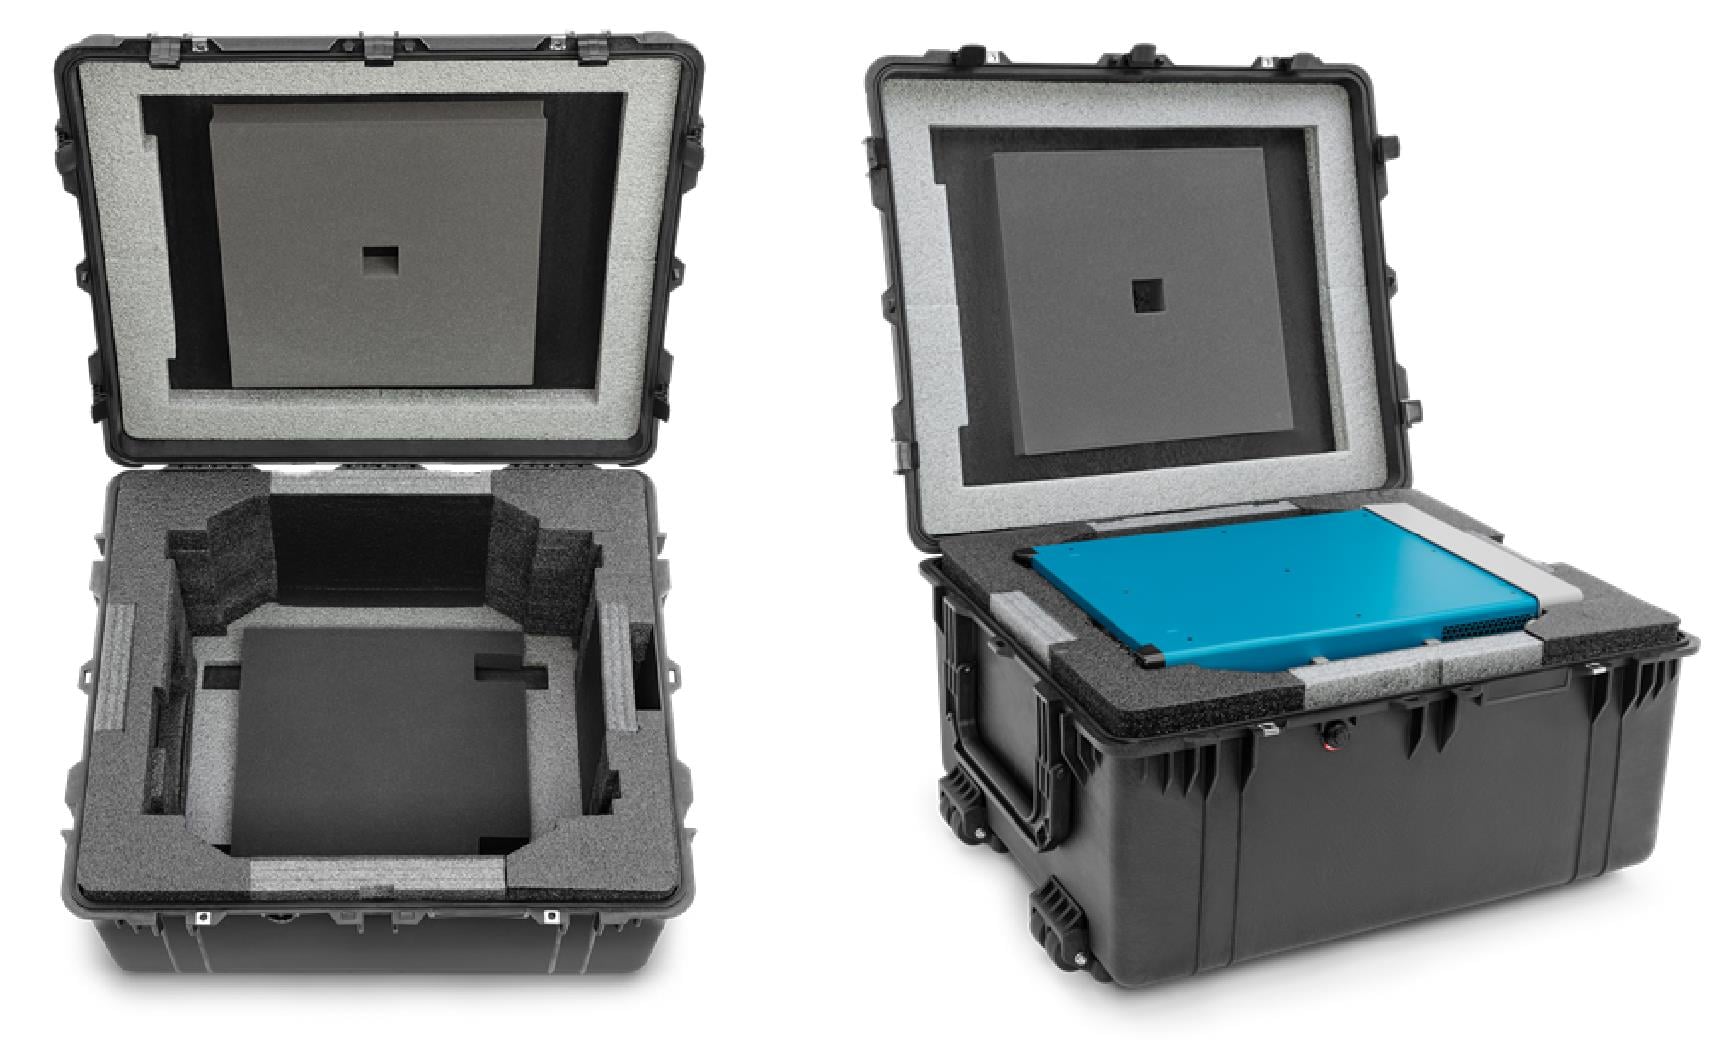
Tektronix has developed the HC7B, a custom transit case, to safely transport and protect the 7 Series DPO instrument from shock, vibration, and moisture. Based on the Pelican 1690 case, Tektronix developed a custom-engineered, multi-layer, foam insert to ensure maximum protection.
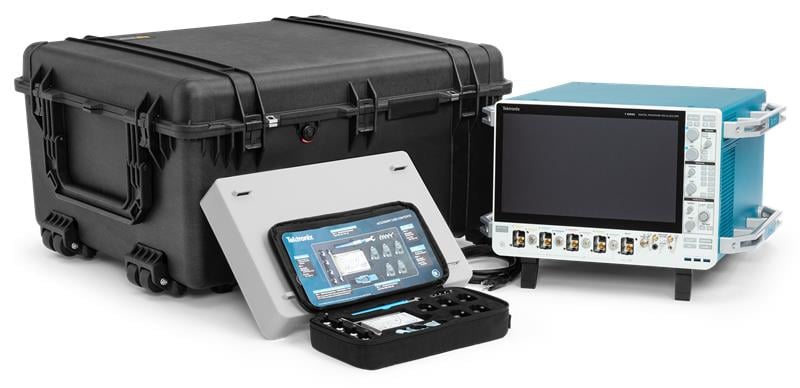
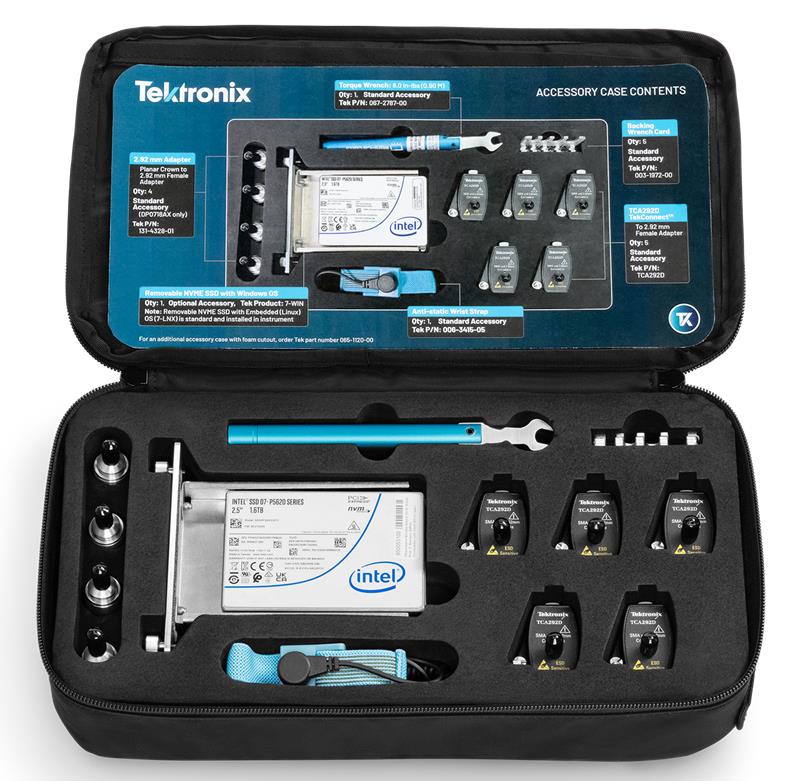
A separate Accessory Case was also designed to hold all of the standard accessories. This case fits between either of the handles on the sides of instrument to securely hold the accessories when transporting the instrument in the HC7B.
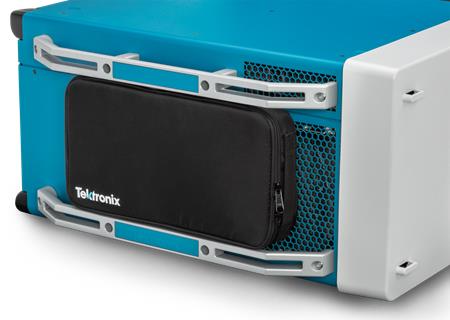
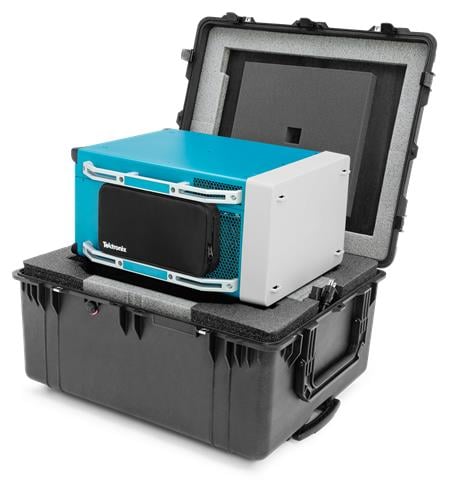
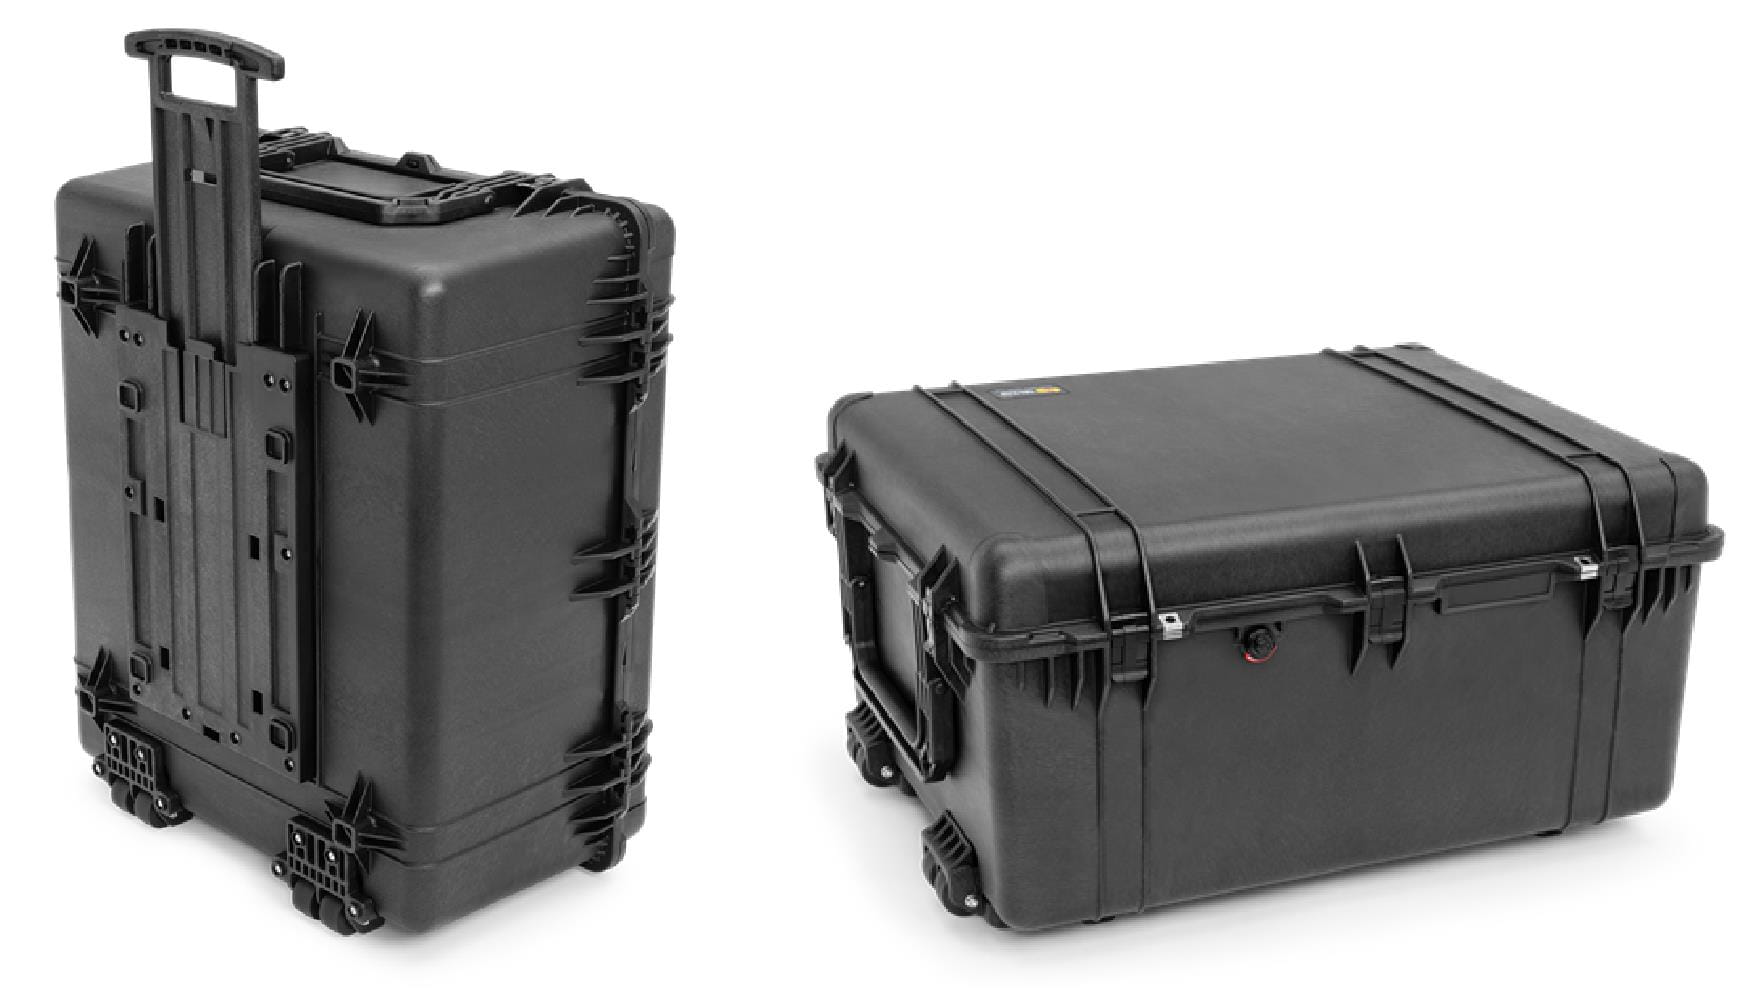
Other features include a retractable carrying handle, wheels, automatic air pressure equalization control valve for use during air transport, and security rings for use with lock (lock not included).
The HC7B is now a standard accessory – all new 7 Series DPO instruments ship with an HC7B. This makes it easy for you to transport your 7 Series DPO including any return to Tektronix for annual calibration.
Specifications
All specifications are typical unless noted. Specifications marked with the ✔ symbol are guaranteed and can be checked using procedures in the 7 Series DPO Specifications and Performance Verification technical reference manual available on
Model overview
Specification | DPO714AX | DPO718AX |
|---|---|---|
Maximum analog channels | 4 | 8 |
Inputs | 4 TekConnect | 4 TekConnect |
Analog bandwidth | 8 GHz, 10 GHz, 13 GHz, 16 GHz, 20 GHz, 25 GHz | |
Rise Time (calculated, typical) | 10% to 90%: 8 GHz (50 ps), 10 GHz (40 ps), 13 GHz (30.8 ps), 16 GHz (25 ps), 20 GHz (20 ps), 25 GHz (16 ps) 20% to 80%: 8 GHz (37.5 ps), 10 GHz (30 ps), 13 GHz (23.1 ps), 16 GHz (18.8 ps), 20 GHz (15 ps), 25 GHz (12 ps) | |
DC gain accuracy | ±2% ±2% ±1.5% ±1.5% | |
ADC resolution | 12 bits | |
Noise reduction | QuietChannel™ technology with Active CTLE (Continuous Time Linear Equalization) with 7 boost setting and one-button optimization routine which selects the optimal setting for the input signal to compensate for high-frequency signal channel loss. | |
Sample rate (resolution) | 125 GS/s on 4 channels (8 ps) 62.5 GS/s on 8 channels (16 ps) | |
Acquisition time at 125 GS/s sample rate, all channels | 4 ms (500 Mpoints - Std), 8 ms (1 Gpoints - Opt), 16 ms (2 Gpoints - Opt) | |
Arbitrary Function Generator (optional) | 13 predefined waveform types with up to 100 MHz output, both single-ended and differential | |
Trigger Frequency Counter | 11-digit frequency counter (free with product registration) | |
Network interfaces | 10 Gbps SFP+ port and 1 Gbps RJ-45 | |
TekHSI | Provides fast data offload, enabling saturation of the 10 Gbps SFP+ network interface Available with Python and C# libraries | |
Vertical system - analog channels
DC Input Resistance ✓
50 Ω ± 1.5 Ω from 18 °C to 28 °C
50 Ω ± 2 Ω from 5 °C to 40 °C
50 Ω ± 1.65 Ω from 18 °C to 28 °C
50 Ω ± 2.2 Ω from 5 °C to 40 °C
Input sensitivity range
Magnification is used below 4 mV/div.
Maximum input voltage
Overvoltage trip is intended to protect against overloads that may damage termination resistors. A sufficiently large impulse may cause damage regardless of the overvoltage protection circuitry because of the finite time required to detect and respond.
2.3 V
5.5 V
-5 V ≤ peak ≤ +5 V
Input termination voltage range
±4.0 V with P7600 and P7700 probes
ADC resolution
12 bits
DC gain accuracy ✓
±2%
±2%
±1.5%
±1.5%
Effective bits (ENOB)
Specification applies to 50 mV/div, 50 kS record length, Quiet Channel is OFF.
Vertical scale = 50 mV/div; Sample rate = 125 GS/s | ||||||||||
Frequency (GHz) | Effective Number of Bits (bit) Greater Than | |||||||||
Channel bandwidth (GHz), BW Filter Optimized for Flatness | ||||||||||
1 | 2 | 4 | 6 | 8 | 10 | 13 | 16 | 20 | 25 | |
Average (signal amplitude = 80% full scale) | 7.8 | 7.8 | 7.8 | 7.7 | 7.7 | 7.6 | 7.3 | 7.2 | 7.0 | 6.7 |
Average (signal amplitude = 90% full scale) | 7.6 | 7.6 | 7.6 | 7.5 | 7.5 | 7.4 | 7.2 | 7.1 | 6.9 | 6.5 |
Vertical scale = 50 mV/div; Sample rate = 62.5 GS/s | ||||||||||
Frequency (GHz) | Effective Number of Bits (bit) Greater Than | |||||||||
Channel bandwidth (GHz), BW Filter Optimized for Flatness | ||||||||||
1 | 2 | 4 | 6 | 8 | 10 | 13 | 16 | 20 | 25 | |
Average (signal amplitude = 80% full scale) | 7.7 | 7.7 | 7.7 | 7.5 | 7.4 | 7.3 | 7.1 | 6.9 | 6.8 | 6.4 |
Average (signal amplitude = 90% full scale) | 7.5 | 7.5 | 7.4 | 7.3 | 7.2 | 7.1 | 6.9 | 6.7 | 6.6 | 6.2 |
Bandwidth selections
1 GHz starting bandwidth to the instrument bandwidth in 1 GHz increments
Bandwidth filtering optimization
Optimized for Flatness or Step response
Random noise, RMS
125 GS/s, QuietChannel Setting = Off | ||||||
|---|---|---|---|---|---|---|
Vertical scale (full scale) | Channel bandwidth (GHz), BW Filter Optimized for Flatness | |||||
8 | 10 | 13 | 16 | 20 | 25 | |
155 μV | 174 μV | 195 μV | 222 μV | 261 μV | 309 μV | |
155 μV | 174 μV | 195 μV | 222 μV | 261 μV | 309 μV | |
157 μV | 174 μV | 200 μV | 232 μV | 267 μV | 329 μV | |
171 μV | 191 μV | 220 μV | 244 μV | 279 μV | 365 μV | |
254 μV | 279 μV | 320 μV | 377 μV | 418 μV | 550 μV | |
523 μV | 595 μV | 680 μV | 743 μV | 864 μV | 1.13 mV | |
1.04 mV | 1.14 mV | 1.29 mV | 1.43 mV | 1.6 mV | 1.96 mV | |
1.32 mV | 1.45 mV | 1.67 mV | 1.97 mV | 2.29 mV | 2.97 mV | |
5.01 mV | 5.5 mV | 6.48 mV | 7.55 mV | 8.53 mV | 10.3 mV | |
125 GS/s, QuietChannel Setting = QC7 | ||||||
Vertical scale (full scale) | Channel bandwidth (GHz), BW Filter Optimized for Flatness | |||||
8 | 10 | 13 | 16 | 20 | 25 | |
153 μV | 172 μV | 193 μV | 218 μV | 257 μV | 321 μV | |
153 μV | 172 μV | 193 μV | 218 μV | 257 μV | 321μV | |
154 μV | 170 μV | 195 μV | 218 μV | 262 μV | 321μV | |
155 μV | 171 μV | 197 μV | 231 μV | 270 μV | 324μV | |
213 μV | 231 μV | 277 μV | 309 μV | 361 μV | 445μV | |
396 μV | 438 μV | 488 μV | 534 μV | 615 μV | 767μV | |
1.13 mV | 1.23 mV | 1.41 mV | 1.63 mV | 1.89 mV | 2.35 mV | |
3.75 mV | 4 mV | 4.58 mV | 5.25 mV | 5.78 mV | 6.54 mV | |
125 GS/s, Quiet Channel = QC4 | ||||||
Vertical scale (full scale) | Channel bandwidth (GHz), BW Filter Optimized for Flatness | |||||
8 | 10 | 13 | 16 | 20 | 25 | |
158 μV | 177 μV | 199 μV | 225 μV | 267 μV | - | |
158 μV | 177 μV | 199 μV | 225 μV | 267 μV | - | |
159 μV | 175 μV | 201 μV | 225 μV | 262 μV | - | |
164 μV | 181 μV | 207 μV | 232 μV | 282 μV | - | |
229 μV | 246 μV | 291 μV | 333 μV | 411 μV | - | |
438 μV | 480 μV | 536 μV | 631 μV | 808 μV | - | |
1.21 mV | 1.3 mV | 1.48 mV | 1.76 mV | 2.18 mV | - | |
4.14 mV | 4.38 mV | 5.02 mV | 5.92 mV | 7.33 mV | - | |
62.5 GS/s, QuietChannel Setting = Off | ||||||
|---|---|---|---|---|---|---|
Vertical scale (full scale) | Channel bandwidth (GHz), BW Filter Optimized for Flatness | |||||
8 | 10 | 13 | 16 | 20 | 25 | |
158 μV | 177 μV | 199 μV | 225 μV | 265 μV | 327 μV | |
158 μV | 177 μV | 199 μV | 225 μV | 265 μV | 327 μV | |
163 μV | 180 μV | 206 μV | 238 μV | 275 μV | 339 μV | |
189 μV | 210 μV | 240 μV | 267 μV | 305 μV | 394 μV | |
296 μV | 324 μV | 369 μV | 423 μV | 494 μV | 640 μV | |
645 μV | 730 μV | 830 μV | 904 μV | 1.08 mV | 1.38 mV | |
1.27 mV | 1.4 mV | 1.58 mV | 1.75 mV | 1.98 mV | 2.47 mV | |
1.51 mV | 1.66 mV | 1.96 mV | 2.23 mV | 2.6 mV | 3.39 mV | |
6.19 mV | 6.78 mV | 7.95 mV | 9.24 mV | 10.5 mV | 12.6 mV | |
62.5 GS/s, QuietChannel Setting = QC7 | ||||||
Vertical scale (full scale) | Channel bandwidth (GHz), BW Filter Optimized for Flatness | |||||
8 | 10 | 13 | 16 | 20 | 25 | |
155 μV | 174 μV | 194 μV | 220 μV | 259 μV | 324 μV | |
155 μV | 174 μV | 194 μV | 220 μV | 259 μV | 324μV | |
157 μV | 174 μV | 198 μV | 221 μV | 265 μV | 327μV | |
163 μV | 180 μV | 204 μV | 239 μV | 278 μV | 337μV | |
235 μV | 260 μV | 291 μV | 329 μV | 380 μV | 479μV | |
467 μV | 510 μV | 560 μV | 589 μV | 684 μV | 867μV | |
1.23 mV | 1.33 mV | 1.49 mV | 1.72 mV | 1.95 mV | 2.54 mV | |
4.46 mV | 4.7 mV | 5.3 mV | 5.99 mV | 6.5 mV | 7.39 mV | |
62.5 GS/s, Quiet Channel = QC4 | ||||||
Vertical scale (full scale) | Channel bandwidth (GHz), BW Filter Optimized for Flatness | |||||
8 | 10 | 13 | 16 | 20 | 25 | |
160 μV | 179 μV | 200 μV | 227 μV | 270 μV | - | |
160 μV | 179 μV | 200 μV | 227 μV | 270 μV | - | |
162 μV | 178 μV | 203 μV | 228 μV | 267 μV | - | |
175 μV | 191 μV | 217 μV | 243 μV | 291 μV | - | |
256 μV | 272 μV | 310 μV | 359 μV | 437 μV | - | |
523 μV | 567 μV | 625 μV | 692 μV | 966 μV | - | |
1.33 mV | 1.42 mV | 1.6 mV | 1.89 mV | 2.44 mV | - | |
4.99 mV | 5.22 mV | 5.91 mV | 6.96 mV | 9.17 mV | - | |
Channel-to-channel isolation
Assumes two channels with the same bandwidth setting and set to 20 mV/div. The limits apply up to the bandwidth of the particular instrument. Channel-to-channel isolation is measured with QuietChannel in the off state.
DPO714AX:
>60 dB up to 25 GHz for all channel combinations
>70 dB up to 15 GHz for all channel combinations
DPO718AX:
>60 dB up to 25 GHz for CH1/5 to all other channels, CH2/6 to all other channels, CH3/7 to all other channels, and CH4/8 to all other channels
>70 dB up to 15 GHz for CH1/5 to all other channels, CH2/6 to all other channels, CH3/7 to all other channels, and CH4/8 to all other channels
>50 dB up to 15 GHz for all channel combinations
>40 dB up to 25 GHz for all channel combinations
Analog DC
Offset range
Input signal cannot exceed maximum input voltage.
Vertical scale (mV/div) | Offset range (V) |
1 to <100 | ±1 |
100 to 500 | ±5 |
Position range
±5 divisions
Offset accuracy ✓
Vertical scale | Offset accuracy |
|---|---|
<4 mV/div | ± (0.003 × |offset – position| + 0.7 mV + 0.13 div × vertical scale) |
4 mV/div to <100 mV/div | ± (0.003 × |offset – position| + 0.7 mV + 0.087 div × vertical scale) |
≥100 mV/div | ± (0.005 × |offset – position| + 3.5 mV + 0.087 div × vertical scale) |
DC voltage measurement accuracy ✓
Average acquisition mode.
Measurement type | DC accuracy |
Average of ≥16 waveforms | ±((DC Gain Accuracy) × |reading - (offset - position)| + Offset Accuracy + digitizer nonlinearity + CVR nonlinearity) |
Delta volts between any two averages of ≥16 waveforms acquired with the same oscilloscope setup and ambient conditions | ±(DC Gain Accuracy × |reading| + 2 × (digitizer nonlinearity + CVR nonlinearity)) |
Calibrated Voltage Reference (CVR) nonlinearity is assumed to be negligeable (zero) since it is factory calibrated across the full CVR range. CVR nonlinearity term is left in the equation for completeness but it has negligeable effect on this specification.
Offset, position, and the constant offset term must be converted to volts by multiplying by the appropriate vertical setting.
Digitizer nonlinearity
Derate all specifications above by 0.1 DL/°C.
Analog AC
Bandwidth option | Maximum analog bandwidth |
|---|---|
BW-25000 | 25 GHz |
BW-20000 | 20 GHz |
BW-16000 | 16 GHz |
BW-13000 | 13 GHz |
BW-10000 | 10 GHz |
BW-8000 | 8 GHz |
Frequency response tolerance (flatness)
±0.6 dB from DC to ≤ 65% of rated bandwidth for all acquisition modes except peak detect
±1.0 dB from 65% to 90% of rated bandwidth for all acquisition modes except peak detect
Valid for all QuietChannel settings. If the QuietChannel setting is QC1, QC2, QC3 or QC4, the bandwidth will be limited to ≤ 20 GHz.
Gain tolerance temperature is derated from factory adjust temperature.
Frequency (GHz) | Gain tolerance derating (dB/°C) |
25 | ±0.08 |
20 | ±0.06 |
16 | ±0.04 |
13 | ±0.03 |
10 | ±0.02 |
8 | ±0.02 |
Frequency response tolerance (flatness) with P7625 Probe
±0.9 dB from DC to 80% of rated bandwidth when used with P76CA-292 (2.92 mm TriMode tip)
Not valid while using peak detect or envelope mode. Valid for probe modes A, B, and D.
Frequency response tolerance (flatness) with P7720 Probe
±0.9 dB from DC to 80% of rated bandwidth when used with P77C292MM (SMA probe tip)
Not valid while using peak detect or envelope mode. Valid for probe modes A, B, and D.
Phase flatness
<3° within any 10 GHz span up to 70% of bandwidth setting.
<5° from DC to 70% of bandwidth setting.
QuietChannel settings
Each setting from QC1 to QC7 provides specific frequency response.
Calculated transition time
10% to 90% transition time = 0.4/(rated bandwidth)
20% to 80% transition time = 0.3/(rated bandwidth)
Bandwidth option | Calculated transition time 10% to 90% (ps) | Calculated transition time 20% to 80% (ps) |
|---|---|---|
BW-25000 | 16.0 | 12.0 |
BW-20000 | 20.0 | 15.0 |
BW-16000 | 25.0 | 18.8 |
BW-13000 | 30.8 | 23.1 |
BW-10000 | 40.0 | 30.0 |
BW-8000 | 50.0 | 37.5 |
Step response settling errors
This specification does not apply to QuietChannel
Vertical scale (mV/div) | Step amplitude | Settling error after 150 ps | Settling error after 400 ps | Settling error after 3 ns | Settling error after 1 μs | Settling error after 1 ms |
5 | ≤5 div | <3.5% | <2.5% | <1.5% | <0.75% | <0.25% |
20 | ||||||
50 | ||||||
100 | ||||||
200 |
RF characteristics
Sensitivity (noise density)
-164 dBm/Hz at or below 20 GHz
-161 dBm/Hz above 20 GHz
Displayed Average Noise Level (DANL)
Frequency range | Vertical scale (mV/div) | DANL (dBm/Hz) |
|---|---|---|
10 MHz to <3 GHz | 4 | < -164 |
3 GHz to <8 GHz | < -165 | |
8 GHz to <12 GHz | < -165 | |
12 GHz to <18 GHz | < -163 | |
18 GHz to 25 GHz | < -161 |
Frequency range | Vertical scale (mV/div) | DANL (dBm/Hz) |
|---|---|---|
10 MHz to <3 GHz | 4 | < -163 |
3 GHz to <8 GHz | < -165 | |
8 GHz to <12 GHz | < -164 | |
12 GHz to <18 GHz | < -163 | |
18 GHz to 25 GHz | < -161 |
Noise figure
Frequency range | Vertical scale (mV/div) | Noise figure (dB) |
|---|---|---|
10 MHz to <3 GHz | 4 | ≤10 |
3 GHz to <8 GHz | ≤9 | |
8 GHz to <12 GHz | ≤9 | |
12 GHz to <18 GHz | ≤11 | |
18 GHz to 25 GHz | ≤13 |
Frequency range | Vertical scale (mV/div) | Noise figure (dB) |
|---|---|---|
10 MHz to <3 GHz | 4 | ≤10.25 |
3 GHz to <8 GHz | ≤9 | |
8 GHz to <12 GHz | ≤9.5 | |
12 GHz to <18 GHz | ≤11 | |
18 GHz to 25 GHz | ≤13 |
Signal-to-noise ratio (SNR) (dynamic range)
Center frequency (GHz) | SNR (dB) | Details |
1 | ≥111 | 0 dBm instrument input range, 100 MHz span, 1 kHz RBW, measured ±20 MHz from center |
10 | ≥106 |
Phase noise
Frequency offset | Phase noise at 1 GHz (dBc/Hz) | Phase noise at 10 GHz (dBc/Hz) |
10 kHz | ≤-118 | ≤-102 |
100 kHz | ≤-124 | ≤-109 |
1 MHz | ≤-134 | ≤-119 |
10 MHz | ≤-142 | ≤-131 |
Error Vector Magnitude (EVM)
Conditions | EVM (relative to reference vector power) | |
|---|---|---|
RMS normalization | Peak normalization | |
10 GHz, 256 QAM, 100 MHz BW | ≤1.06% | ≤0.66% |
7 GHz, 256 QAM, 7 GHz BW | ≤1.20% | ≤0.73% |
Spurious Free Dynamic Range (SFDR)
Conditions | SFDR (dBc) |
|---|---|
2.35 GHz sine, -4 dBm, 2.35 GHz CF, 1.5 GHz span, ≤100 kHz RBW | ≤-80 |
3 GHz sine, -4 dBm, 3 GHz CF, 5 GHz span, ≤100 kHz RBW | ≤-62 |
Conditions | SFDR (dBc) |
|---|---|
2.35 GHz sine, -4 dBm, 2.35 GHz CF, 1.5 GHz span, ≤100 kHz RBW | ≤-78 |
3 GHz sine, -4 dBm, 3 GHz CF, 5 GHz span, ≤100 kHz RBW | ≤-60 |
S
Vertical scale (mV/div) | Frequency range | | S | VSWR |
|---|---|---|---|
<100 | ≤9 GHz | ≤14 | 1.50 |
>9 GHz to ≤15 GHz | ≤11 | 1.79 | |
>15 GHz to ≤25 GHz | ≤9 | 2.10 | |
≥100 | ≤9 GHz | ≤14 | 1.50 |
>9 GHz to ≤25 GHz | ≤10 | 1.93 |
2
Fundamental frequency (GHz) | 2 | 3 |
1 | ≤-60 | ≤-60 |
10 | ≤-60 | - |
For 2nd and 3rd harmonic distortion tests:50 mV full scale (5 mV/div), -28 dBm input signal (~50% of full scale) at 100 kHz RBW | ||
2
Frequency (tone 1) (GHz) | 2 | 3 |
3.5 | ≤-50 | ≤-60 |
10 | ≤-50 | ≤-62 |
18 | ≤-50 (single sided) | ≤-45 |
23 | ≤-50 (single sided) | ≤-45 |
For 2nd and 3rd order intermodulation tests: Two sine waves, 10 MHz spacing, 5 mV/div, -29 dBm/tone | ||
Horizontal system
Record length range
Minimum : 50 pointsMaximum : 500 Mpoints (1 Gpoints, 2 Gpoints optional)Increment : 1 point
Horizontal scale range
400 fs/div to 1000 s/div (auto-mode)
Record length | Horizontal scale range |
|---|---|
50 points | 400 fs/div to 8 ms/div |
1 kpoints | 8 ps/div to 160 ms/div |
10 kpoints | 80 ps/div to 1.6 s/div |
100 kpoints | 800 ps/div to 16 s/div |
1 Mpoints | 8 ns/div to 160 s/div |
10 Mpoints | 80 ns/div to 1000 s/div |
100 Mpoints | 800 ns/div to 1000 s/div |
500 Mpoints | 4 μs/div to 1000 s/div |
1 Gpoints (optional) | 8 μs/div to 1000 s/div |
2 Gpoints (optional) | 16 μs/div to 1000 s/div |
Aperture uncertainty (sample jitter)
Time duration | Aperture uncertainty RMS (mean + 3σ) (fs) | |||||||
Internal reference | External reference stable 15 ppm | External reference tracking 1000 ppm | External sample clock | |||||
125 GS/s | 62.5 GS/s | 125 GS/s | 62.5 GS/s | 125 GS/s | 62.5 GS/s | 125 GS/s | 62.5 GS/s | |
<100 ns | ≤50 | ≤60 | ≤50 | ≤60 | ≤50 | ≤60 | ≤40 | ≤60 |
1 μs | ≤60 | ≤60 | ≤60 | ≤60 | ≤100 | ≤100 | Follows jitter of 7.8125 GHz source with floor at ≤40 fs | Follows jitter of 7.8125 GHz source with floor at ≤60 fs |
10 μs | ≤70 | ≤70 | ≤70 | ≤70 | ≤200 | ≤200 | ||
100 μs | ≤70 | ≤70 | ≤70 | ≤70 | ≤400 | ≤400 | ||
1 ms | ≤70 | ≤70 | ≤70 | ≤70 | ≤600 | ≤600 | ||
Jitter Noise Floor (JNF)
N
SR = slew rate around the measurement
t
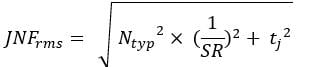
The interpolated sample rate of the waveform must be at least 25 times the bandwidth of the signal being measured.
For this example, we calculate the jitter noise floor of the oscilloscope to verify whether it is suitable to measure the PCIe Gen4 100 MHz RefClk (RMS phase jitter ≤ 500 fs RMS) using the following signal characteristics.
Frequency = 100 MHz
Slew rate = 3.0 V/ns = 3 x 10
9 V/s (SR)Amplitude (single ended) = 300 mV
Bandwidth setting = 10 GHz
BW Filter = Optimized for Flatness
Vertical scale = 50 mV/div or 500 mV full scale
Vertical offset = 125 mV
Sample rate = 125 GS/s
QuietChannel = Off
Timebase reference = Internal
Random noise (125 GS/s, QuietChannel = Off, 50 mV/div, 10 GHz) = 595 µV = 595 x 10
-6 V (Ntyp )Aperture uncertainty (100 µS time period, Internal timebase) = 70 fs = 70 x 10
-15 s (tj )
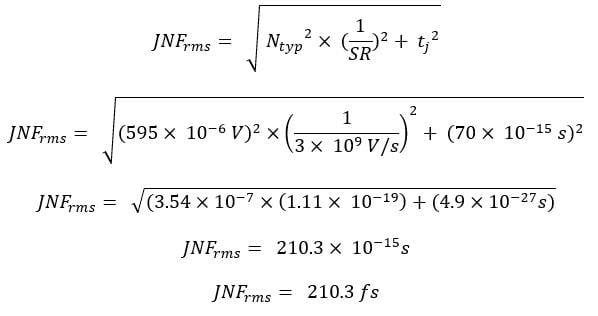
For this example, we calculate the jitter noise floor of the oscilloscope to verify whether it is suitable to measure the PCIe Gen4 16 Gbps (16 GT/s) transmitter using the following signal characteristics.
Frequency = 16 Gbps (16 GT/s)
Slew rate = 80.0 V/ns = 80 x 10
9 V/s (SR)Amplitude (single ended) = 800 mV
Bandwidth setting = 25 GHz
BW Filter = Optimized for Flatness
Vertical scale = 100 mV/div or 1 V full scale
Vertical offset = 0 mV
Sample rate = 125 GS/s
QuietChannel = Off
Timebase reference = Internal
Random noise (125 GS/s, QuietChannel = Off, 1 V full scale, 25 GHz) = 2.35 mV = 2.35 x 10
-3 V (Ntyp )Aperture uncertainty (100 µS time period, Internal timebase) = 70 fs = 70 x 10
-15 s (tj )
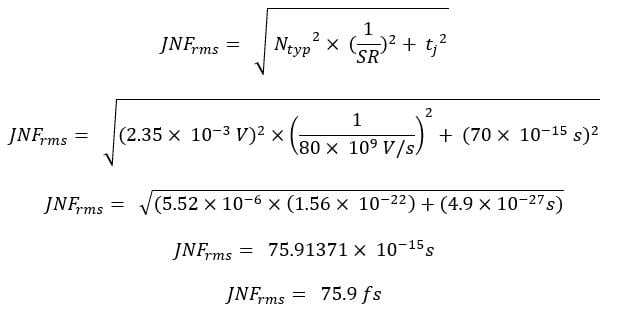
Timebase accuracy ✓
Description | Specification |
|---|---|
Factory tolerance | ≤12 ppb initial accuracy |
Temperature stability | ±20 ppb across the full operating range of 5 °C to 40 °C, after a sufficient soak time at temperature; tested at operating temperatures |
Aging | ≤2 ppb daily aging ≤300 ppb within first year aging ≤100 ppb for each year thereafter |
The instrument needs to soak at a fixed temperature for an extended period of time to ensure the timebase frequency is stable. The following is a worst case estimation for the frequency error versus the amount of time the instrument has been soaking at a temperature.
Max error (in ppb) = ±10^[log[100/soak time(in hours)]]
For example, a 1-hour soak will have a max frequency error of ±100 ppb, but a 10-hour soak will have a max frequency error of ±10 ppb.
Delta-time measurement accuracy
Specification:

Slew
Slew
t
TBA = Timebase accuracy including appropriate aging, fraction (see Timebase accuracy specification)
t
N
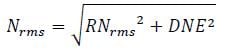
RN
DNE = Dynamic noise estimate, V, given by:
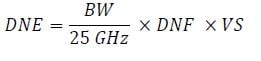
BW = Selected bandwidth for acquisition, Hz
VS = Selected vertical scale (one division), V
DNF = Dynamic noise factor, no units (see following table)
Sample rate (GS/s) | Bandwidth setting (GHz) | DNF (unitless) |
|---|---|---|
125 | <25 | 0.01971 |
25 | 0.01759 | |
62.5 | <25 | 0.02481 |
25 | 0.02215 |
For this example, we calculate the accuracy of a period measurement of one cycle of a 100 MHz PCIe timing clock generator (single ended). As this is a measurement of the time difference between 2 waveform events, the Delta Time measurement Accuracy (DTA) specification applies. For timebase accuracy, we will assume that the scope is 1 year past its previous factory adjust event.
Frequency = 100 MHz
Period = 10 ns (t
p )Slew Rate = 3.0 V/ns = 3 × 10
9 V/s (Slew1 and Slew2)Amplitude (single ended) = 300 mV
Bandwidth setting = 10 GHz (BW)
BW Filter = Optimized for Flatness
Vertical scale = 50 mV/div (VS)
Vertical offset = 125 mV
Sample Rate = 125 GS/s
Quiet Channel = Off
Timebase reference = Internal
First, identify the additional terms needed from specifications based on the specific oscilloscope settings:
Random noise (125 GS/s, Optimized for Flatness, 50 mV/div, 10 GHz) = 595 μV (RN
rms )Timebase accuracy (1 year) = 300 ppb (300 × 10
-9 ) (TBA)Aperture Uncertainty (<100 ns time period, Internal timebase) = 50 fs (t
j )
Next, we find the Dynamic Noise actor (DNF) from the supplied table:
DNF (125 GS/s, <25 GHz) = 0.01971
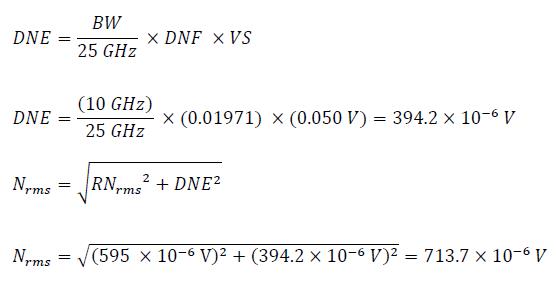
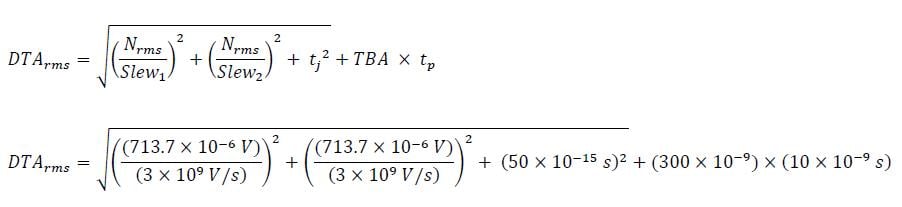
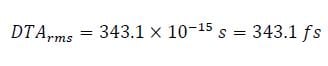
Timebase delay range
-10 divisions to 5000 s
Deskew range
-125 ns to +125 ns
Deskew resolution
10 fs
Skew between analog channels
≤2 ps for any two channels with the following conditions on the two channels:
Channels on the same instrument; signal amplitude at least 5 divisions; same bandwidth setting; QuietChannel setting = Off
Trigger system
Trigger sources
All analog channel inputs, Aux input, AC line
Trigger modes
Auto, Normal
Trigger coupling
DC, noise reject (reduces sensitivity)
Trigger holdoff range
0 ns to 20 s
Trigger holdoff resolution
2.048 ns
Trigger bandwidth
Trigger type | Trigger bandwidth |
Edge, Pulse (analog channels) | Bandwidth setting |
Edge (Aux In) | 8 GHz |
Edge-type trigger sensitivity
Trigger source | Vertical scale (mV/div) | Minimum sensitivity (peak-to-peak) |
|---|---|---|
Analog channels | 1 to <5 | ≤10 mV |
5 to <10 | ≤2 divisions | |
10 to 500 | ≤1 division | |
Aux In | 100 mV from DC to <1 GHz 175 mV from 1 GHz to <4 GHz 300 mV from 4 GHz to ≤8 GHz | |
Trigger level may need to be adjusted to account for trigger hysteresis.
AC Line trigger
Aux Out trigger latency
The delay from the trigger event to trigger signal output.
Trigger jitter
Analog channels (RMS)
125 GS/s sample rate: ≤ 10 fs
62.5 GS/s sample rate: ≤ 100 fs
Vertical scale: 50 mV/div
Horizontal trigger position: 50%
Trigger mode: Edge
Trigger level: 0 V
Input signal: 3 division peak-to-peak sine wave > 1 GHz
Aux In (peak-to-peak)
≤ 80 ps
Trigger level ranges
Trigger source | Trigger level range |
Analog channels | ±5 divisions from center of screen |
AC Line | Fixed near 50% of the line voltage |
Aux In | ±5 V |
Trigger types
Edge: Positive, negative, or either slope on any channel. Coupling includes DC and noise reject.
Pulse Width: Trigger on width of positive or negative pulses. Event can be time- or logic-qualified.
Cycle: Trigger on signals of specified frequency/period.
Dual Edge: Trigger on width of positive or negative pulses. Event can be time- or logic-qualified.
Timeout: Trigger on an event which remains high, low, or either, for a specified time period. Event can be logic-qualified.
Runt: Trigger on a pulse that crosses one threshold but fails to cross a second threshold before crossing the first again. Event can be time- or logic-qualified.
Window: Trigger on an event that enters, exits, stays inside, or stays outside of a window defined by two user-adjustable thresholds. Event can be time- or logic-qualified.
Rise / Fall Time: Trigger on pulse edge rates that are faster or slower than specified. Slope may be positive, negative, or either. Event can be logic-qualified.
Sequence: Trigger on B event after a user specified time delay or N events after A trigger with a reset on C event. In general, A and B trigger events can be set to any trigger type with a few exceptions: logic qualification is not supported.
Visual: Qualifies standard triggers by scanning all waveform acquisitions and comparing them to on-screen areas (geometric shapes). An unlimited number of areas can be defined with In, Out, or Don't Care as the qualifier for each area. A boolean expression can be defined using any combination of visual trigger areas to further qualify the events that get stored into acquisition memory. Shapes include rectangle, triangle, trapezoid, hexagon and user-defined.
Time Range for time qualified triggers
The minimum to maximum time, in seconds, to which the instrument can be set for discriminating Pulse Widths, Timeout, Time-qualified Runt, Time-qualified Window, and Transition Time Trigger.
Trigger type | Triggers condition | Minimum time | Maximum time |
|---|---|---|---|
Pulse Width, Runt, Rise/Fall time | < Limit, > Limit | 32 ps | 20 s |
= Limit, ≠ Limit | 320 ps | ||
Pulse Width | Inside range, Outside range | 32 ps | |
Cycle | < Limit, > Limit, Inside range, Outside range | 64 ps | |
= Limit, ≠ Limit | 640 ps | ||
Timeout | Stays high, Stays low, Either | 32 ps | |
Window | Inside > Limit, Outide > Limit | 32 ps |
Trigger level accuracy
For signals having rise and fall times ≥10 ns and using a single trigger level, the limits are as follows:
Source | Range |
|---|---|
Any input channel | ±0.20 div ±(10% × | trigger threshold level - offset |) + (3.5% × full scale) + offset accuracy |
Aux In | Not specified |
Time accuracy for pulse width and timeout triggering
±(16 ps + (Timebase Accuracy × Setting))
Timebase Accuracy when locked to an external source is equivalent to the accuracy of the external source.
Pulse-type Trigger, Minimum Pulse, Re-arm Time, Transition Time
Pulse class | Minimum pulse width | Minimum rearm time |
|---|---|---|
Runt | 32 ps | 32 ps |
Time–qualified runt | ||
Width |
Trigger Time | Minimum transition time | Minimum rearm time |
|---|---|---|
Rise/Fall Time | 32 ps | 32 ps |
Pulse-type runt trigger sensitivities
≥2.0 division, at vertical scale ≥5 mV/div
Pulse-type trigger width sensitivities
≥2.0 division, at vertical scale ≥5 mV/div
B Trigger after events, minimum pulse width, and maximum event frequency
B Trigger, minimum time arm and trigger
32 ps
For trigger after time, this is the time between the end of the time period and the B trigger event.
For trigger after events, this is the time between the last A trigger event and the first B trigger event.
B Trigger after time
B Trigger after events, event range
1 event to 20 Gevents
Lowest frequency for successful operation of “Set Level to 50%” function
45 Hz
Triggered acquisition rate
For record/segment length = 1000 points, input frequency = 100 MHz
>550 per second
Error Detector (optional)
1 – 26.6 Gbps
When the Error Detector is running, Error Detector status and results will be displayed in the Error Detector badge. The bit that caused the error will be aligned with the horizontal trigger position indicator.
Results field | Description |
Displays the selected pattern which the incoming bit stream is being compared against by the Error Detector. | |
Displays the status of the Error Detector. Status can have the following values. | |
The total number of bits tested. | |
The total number of bit errors found. | |
The total time the Error Detector has been running. | |
The calculated Bit Error Rate. BER = Errors / Bits. | |
Calculated confidence level based on the number of bits acquired, the number of errors, and the user-specified Target BER. The reported range is 0% to 100%. Confidence Level is a statistical measure that tells you the probability that a system's true error rate is below a specified target value. Because error testing takes finite time, finding zero errors in a test only guarantees performance to a certain statistical certainty. Increasing the amount of time the Bit Error Rate Test runs error free increases the confidence level. |
The table below lists the standard PRBS patterns available in the Error Detector and the corresponding polynomials used to generate them.
Pattern | Polynomial |
PRBS7 | (x |
PRBS9 | (x |
PRBS11 | (x |
PRBS13 | (x |
PRBS15 | (x |
PRBS16 | (x |
PRBS20 | (x |
PRBS21 | (x |
PRBS23 | (x |
PRBS31 | (x |
Custom user-defined pattern files can be used to set the pattern the Error Detector will compare the incoming bit-stream. These pattern files are defined using a simple text file containing a pattern of 1’s and 0’s. Valid pattern files must meet the following requirements.
ASCII text file (.txt) containing only ‘1’ and ‘0’ characters and white space characters
Maximum pattern length of 2
16 x 80 bits (5.2 Mbit)The pattern length must be a multiple of 80 bits.
If the length of the pattern is not a multiple of 80 bits, the pattern will automatically be duplicated and concatenated enough times to produce a total pattern length that is a multiple of 80 bits.
If duplicating the pattern causes the pattern length to exceed the maximum pattern length limit, an out
of memory error will be reported.
The first 80-bits of the pattern must be unique. This ensures reliable Error Detector synchronization.
Acquisition system
Acquisition Modes
Acquisition mode | Description | |
|---|---|---|
Sample | Acquires sampled values | |
Peak Detect | Captures glitches as narrow as 32 ps at all sweep speeds | |
Envelope | Min-max envelope reflecting Peak Detect data over multiple acquisitions | |
Average | From 2 to 10,240 waveforms, default 16 waveforms | |
FastAcq™ | FastAcq optimizes the instrument for analysis of dynamic signals and capture of infrequent events. Maximum waveform capture rate: 150,000 wfms/s (62.5 GS/s) 100,000 wfms/s (125 GS/s) | |
FastFrame™ | Acquisition memory divided into segments. Maximum trigger rate >30,000,000 waveforms per second Minimum frame size = 50 points | |
Frame length | Frame count | |
50 | 1M | |
1K | 838.86K | |
10K | 200K | |
100K | 20K | |
1M | 2K | |
10M | 200 | |
Peak Detect or Envelope Mode Minimum Detectable Pulse
≤16 ps
Sample rate range
4 channels: 625 S/s to 125 GS/s (real time), 250 GS/s to 12.5 TS/s (
interpolated )
Channels 1-4 only: 625 GS/s to 125 GS/s
(real time ), 250 GS/s to 12.5 TS/s (interpolated )Any of Channels 5-8 enabled: 625 S/s to 62.5 GS/s (
real time ), 250GS/s to 12.5TS/s (interpolated )
Waveform measurements
Cursor types
Waveform, Vertical (V) Bars, Horizontal (H) Bars, V&H Bars, and Polar (XY/XYZ plots only)
Automatic measurements
36 types of time and amplitude measurements. An unlimited number can be displayed as either individual measurement badges or collectively in a measurement results table.
Amplitude measurements
Amplitude, Maximum, Minimum, Peak-to-Peak, Positive Overshoot, Negative Overshoot, Mean, RMS, AC RMS, Top, Base, and Area
Timing measurements
Period, Frequency, Unit Interval, Data Rate, Positive Pulse Width, Negative Pulse Width, Skew, Delay, Rise Time, Fall Time, Phase, Rising Slew Rate, Falling Slew Rate, Burst Width, Positive Duty Cycle, Negative Duty Cycle, Time Outside Level, Setup Time, Hold Time, Duration N-Periods, High Time, Low Time, Time to Minimum, and Time to Maximum
Jitter measurements (standard)
TIE and Phase Noise
Measurement statistics
Mean, Standard Deviation, Maximum, Minimum, Peak-to-Peak, and Population. Statistics are available on both the current acquisition and all acquisitions.
Reference levels
User-definable reference levels for automatic measurements can be specified in either percent or units. Reference levels can be set to global for all measurements, per source channel or signal, or unique for each measurement.
Gating
Screen, Cursors, Logic, Search, or Time. Specifies the region of an acquisition in which to take measurements. Gating can be set to Global (affects all measurements set to Global) or Local (all measurements can have a unique Time gate setting; only one Local gate is available for Screen, Cursors, Logic, and Search actions).
Measurement plots
Histogram, Time Trend, Spectrum, Eye Diagram (TIE measurement only), Phase Noise (Phase Noise measurement only)
Measurement limits
Pass/fail testing for user-definable limits on measurement values. Act on event for measurement value failures include Save Screen Capture, Save Waveform, System Request (SRQ), and Stop Acquisitions
Advanced Jitter Analysis (optional):
Jitter measurements (Jitter Summary, TIE,Phase, Noise, TJ@BER, RJ- δδ, DJ- δδ, PJ, RJ, DJ, DDJ, ISI, DCD, SRJ, J2, J9, NPJ, F/2, F/4, F/8, CC-Jitter)
Eye Measurements (Eye Height, Eye Height@BER, Eye Width, Eye Width@BER, Eye High, Eye Low, Q-Factor)
Amplitude Measurements (Bit High, Bit Low, Bit Amplitude, DC Common Mode, AC Common Mode (Pk-Pk), Differential Crossover, T/nT Ratio)
Time Measurements (Data Rate, Pattern Length, SSC Freq Dev, SSC Modulation Rate, SSC Slew Rate)
Eye Diagram, Composite Jitter Histogram, and Jitter Bathtub
Fast eye rendering: Shows the Unit Intervals (UIs) that define the boundaries of the eye along with a user specified number of surrounding UIs for added visual context
Complete eye rendering: Shows all valid Unit Intervals (UIs)
Pass/fail testing for user-definable limits on measurement values. Act on event for measurement value failures include Save Screen Capture, Save Waveform, System Request (SRQ), and Stop Acquisitions
Automated mask pass/fail testing with mask autofit and mask hit ratio
Waveform math
Number of math waveforms
Unlimited
Arithmetic
Add, subtract, multiply, and divide waveforms and scalars
Algebraic expressions
Define extensive algebraic expressions including waveforms, scalars, user-adjustable variables, and results of parametric measurements. Performs math on math waveforms using advanced equations. For example (Integral (CH1 - LOG(CH1)) × SQRT(2) × VAR1)
Math functions
Invert, Integrate, Differentiate, Square Root, Exponential, Log 10, Log e, Absolute value, Ceiling, Floor, Minimum, Maximum, Degrees, Radians, Sin, Cos, Tan, Sin
Relational
Boolean result of comparison >, <, ≥, ≤, =, and ≠
Logic
AND, OR, NAND, NOR, XOR, and EQV
User definable filters (standard)
Loading of user definable filters. Users specify a file containing the coefficients of the filter.
User definable filters (optional)
Filter types
Low pass, High pass, Band pass, Band stop, All pass, Hilbert, Differentiator, Raised-Cosine, Root-Raised-Cosine
Filter response types
Butterworth, Chebyshev I, Chebyshev II, Elliptical, Gaussian, Bessel-Thomson, and Custom
FFT functions
Spectral Magnitude and Phase, and Real and Imaginary Spectra
FFT vertical units
Magnitude: Linear (RMS voltage) and Log (dBm)
Phase: Degrees, Radians, and Group Delay
FFT window functions
Hanning, Rectangular, Hamming, Blackman-Harris, Kaiser-Bessel, Flattop2, Gaussian, and TekExp
Search
Search types
Search through long records to find all occurrences of user specified criteria including edges, pulse widths, cycles, timeouts, runt pulses, window violations, rise/fall times, and bus protocol events. Search results can be viewed in the Waveform View or in the Results table.
Number of searches
Unlimited
Save
Save
Save files directly to the oscilloscope or USB media, to a remote network drive, or to your TekDrive collaboration workspace.
Waveform type
Tektronix Waveform Data (.wfm), Comma Separated Values (.csv), MATLAB (.mat)
Waveform gating
Cursors, Screen, Resample (save every nth sample)
Screen capture type
Portable Network Graphic (*.png), 24-bit Bitmap (*.bmp), JPEG (*.jpg)
Setup type
Tektronix Setup (.set)
Report type
Adobe Portable Documents (.pdf)
Session type
Tektronix Session Setup (.tss)
Display
Display type
15.6 in. (395 mm) liquid-crystal TFT color display
Display resolution
1920 horizontal × 1080 vertical pixels (High Definition)
Display modes
Overlay: traditional oscilloscope display where traces overlay each other
Stacked: display mode where each waveform is placed in its own slice and can take advantage of the full ADC range while still being visually separated from other waveforms. Groups of channels can also be overlaid within a slice to simplify visual comparison of signals.
Zoom
Horizontal and vertical zooming is supported in all waveform and plot views.
Interpolation
Sin(x)/x and Linear
Waveform styles
Vectors, dots, variable persistence, and infinite persistence
Graticules
Movable and fixed graticules, selectable between Grid, Time, Full, and None
Color palettes
Normal and inverted for screen captures
Individual waveform colors are user-selectable
Fonts
Font size is user selectable from 12 to 20 (default is 15)
Format
YT, XY, and XYZ
Inverted display
Windows OS only
Local Language User Interface
English, Japanese, Simplified Chinese, Traditional Chinese, French, German, Italian, Spanish, Portuguese, Russian, Korean
Local Language Help
English, Japanese, Simplified Chinese
Arbitrary Function Generator (optional)
All of the specifications in this section apply to the AFG Out BNC connector on the rear panel. This output is only functional with the Arbitrary Functional Generator (AFG) option.
Modes of operation
Off, Continuous, Burst
Function types
Arbitrary, Sine, Square, Pulse, Ramp, DC Level, Gaussian, Lorentz, Exponential Rise, Exponential Decay, Sine(x)/x, Random Noise, Haversine, Cardiac
Output
Waveforms available on rear-panel AFG Out output
Amplitude range
Waveform | Amplitude range (peak-to-peak) | |
|---|---|---|
Load impedance = 50 Ω | Load impedance = High Z | |
Sine, Square, Pulse, Ramp, Noise, Haversine, Cardiac, Arbitrary | 10 mV to 2.5 V | 20 mV to 5.0 V |
Gaussian, Exponential rise, Exponential delay | 10 mV to 1.25 V | 20 mV to 2.5 V |
Lorentz | 10 mV to 1.2 V | 20 mV to 2.4 V |
Sin(x)/x | 10 mV to 1.5 V | 20 mV to 3.0 V |
DC | - | - |
Frequency range
Waveform | Frequency range |
Sine | 0.1 Hz to 100 MHz |
Square, Pulse, Arbitrary | 0.1 Hz to 50 MHz |
Ramp, Cardiac | 0.1 Hz to 1 MHz |
Sin(x)/x | 0.1 Hz to 4 MHz |
Gaussian, Haversine, Lorentz, Exponential rise, Exponential delay | 0.1 Hz to 10 MHz |
Noise, DC | - |
Frequency resolution
0.1 Hz
Frequency accuracy ✓
±130 ppm (frequency ≤ 10 kHz), ±50 ppm (frequency > 10 kHz)
Guaranteed for Sine and Ramp waveforms. Typical for Square and Pulse waveforms.
Sine waveform
Amplitude flatness
±0.5 dB (relative to 1 kHz level) at 30 MHz
±1.0 dB (relative to 1 kHz level) at 50 MHz
±1.5 dB (relative to 1 kHz level) at 100 MHz
±1.5 dB (relative to 1 kHz level) for amplitude (peak-to-peak) <20 mV at 30 MHz
±1.5 dB (relative to 1 kHz level) for amplitude (peak-to-peak) <20 mV at 50 MHz
±2.0 dB (relative to 1 kHz level) for amplitude (peak-to-peak) <20 mV at 100 MHz
Spurious free dynamic range
Frequency range | Amplitude range | |
|---|---|---|
20 mV to < 100 mV, Offset = 0 V | 100 mV to ≤ 2.5 V, Offset = 0 V | |
> DC to < 50 MHz | -30 dBc | -40 dBc |
50 MHz to 100 MHz | -25 dBc | -30 dBc |
Total harmonic distortion
Specified values are percent of fundamental signal amplitude.
Frequency range | Amplitude range | |
|---|---|---|
0.05 V to < 0.2 V | 0.2 V to ≤ 2.5 V | |
> DC to ≤ 25 MHz | ≤2.5% | ≤3% |
25 MHz to < 50 MHz | ≤3% | ≤4% |
50 MHz to 100 MHz | ≤5.5% | ≤4% |
Square and Pulse waveform
Duty cycle range
10% to 90% or 5 ns minimum pulse, whichever is larger
Minimum pulse time applies to both on and off time, so maximum duty cycle will reduce at higher frequencies to maintain 5 ns off time
Duty cycle resolution
0.1%
Minimum pulse width, typical
5 ns. This is the minimum time for either on or off duration.
Rise/Fall time
≤5 ns, 10% to 90%
Pulse width resolution
100 ps
Overshoot
<6 % of the signal amplitude (peak-to-peak) for signal steps greater than 100 mV
This applies to overshoot of the positive-going transition (+overshoot) and of the negative-going (-overshoot) transition
Asymmetry (duty cycle accuracy)
±(1% + 5 ns × frequency × 100%) at 50% duty cycle
Jitter
TIE
For amplitude
Ramp waveform
0% to 100%
Symmetry resolution
0.1%
Arbitrary
Memory depth
1 to 128 kS
Sample rate
250 MS/s
Amplitude accuracy
±[ (1.5% × peak-to-peak amplitude setting) + (1.5% × | DC offset setting |) + 1 mV ] at frequency = 1 kHz
Amplitude resolution
50 Ω : 500 μVHigh Z : 1 mV
DC offset range
50 Ω : ±1.25High Z : ±2.5 V
DC offset resolution
50 Ω : 500 μVHigh Z : 1 mV
DC offset accuracy
50 Ω : ±[ (1.5% × | offset voltage setting |) + 1 mV ]Add 1.5 mV of uncertainty per 10 °C change from 25 °C ambient.
High Z : ±[ (1.5% of | offset voltage setting |) + 2 mV ]Add 3 mV of uncertainty per 10 °C change from 25 °C ambient.
AFG Trigger Aux Out Frequency
The divided output frequency is dependent on the frequency of the AFG signal:
AFG signal frequency | Aux Out AFG trigger frequency |
≤ 4.9 MHz | Signal frequency |
>4.9 MHz to 14.7 MHz | Signal frequency / 3 |
>14.7 MHz to 24.5 MHz | Signal frequency / 5 |
>24.5 MHz to 34.3 MHz | Signal frequency / 7 |
>34.3 MHz to 44.1 MHz | Signal frequency / 9 |
>44.1 MHz to 53.9 MHz | Signal frequency / 11 |
>53.9 MHz to 63.7 MHz | Signal frequency / 13 |
>63.7 MHz to 73.5 MHz | Signal frequency / 15 |
>73.5 MHz to 83.3 MHz | Signal frequency / 17 |
>83.3 MHz to 93.1 Mhz | Signal frequency / 19 |
>93.1 MHz to 100 MHz | Signal frequency / 21 |
Trigger frequency counter (optional)
Resolution
11 digits
Accuracy
± (20 ppb + timebase accuracy)
From 10 Hz to channel bandwidth for analog channels.
From 10 Hz to 6.25 GHz for Aux In.
Frequency range
10 Hz to (2 × maximum channel bandwidth)
Amplitude (peak-to-peak) of the signal must be at least 8 mV or 3 div, whichever is greater.
(2 × maximum channel bandwidth) can be obtained by setting the trigger condition to either Rising or Falling.
Processor system
Host processor
AMD EPYC Embedded 3351 @ 3 GHz, 64-bit, 12-core processor, 96 GB System RAM
GPU
NVIDIA T1000
Operating system
Closed Embedded OS (Linux)
Microsoft Windows 10 LTSC 2021 (initial purchase option)
Solid State Drive (SSD)
≥1.6 TB removable NVMe SSD
Additional SSD (optional)
Option 7-LNX-UP: Removeable SSD with closed Embedded OS (Linux)
Option 7-WIN-UP: Removeable SSD with Microsoft Windows 10 LTSC 2021 (64-bit) operating system
Input and output ports (front panel)
Analog inputs
TekConnect interface and 2.92 mm Planar Crown(R) interface
Auxiliary input
TekConnect interface
DC probe calibration output
BNC connector for DC probe calibration (signal available only during probe calibration)
Differential Fast Edge output
Two 2.92 mm connectors
Frequency : 1 kHz ± 20%Amplitude (peak-to-peak) : 1200 mV differential into a 100 Ω loadCommon mode : -300 mVSkew : ≤0.8 psRise time : < 40 ps (20% to 80% measurement) directly into an analog input channelAberrations : Within ±1% of the final step amplitude after the first 500 ns following the edge transitionFor probe deskewing, it is recommended that a 50 Ω terminator be used in series with the deskew fixture to minimize high frequency aberrations
Unused differential output needs to be terminated with a 50 Ω resistive terminator cap or the used output will have significant aberrations and overshoot
Antistatic ground
Banana jack, 1 MΩ resistor to ground
Chassis ground
Banana jack, direct to chassis ground
USB interface
Three Type-A USB 3.0 SuperSpeed host ports
Input and output ports (rear panel)
LAN SFP+ 10G network interface
SFP+ (Enhanced Small Form Factor Pluggable) port, 10G Ethernet
LAN 1G RJ-45 network interface
8-pin, 10/100/1000BASE-T(X) Ethernet
USB interface
Four Type-A USB 3.0 SuperSpeed host ports
One Type-B USB 3.0 SuperSpeed device port providing USBTMC support
DisplayPort connector
20-pin DisplayPort connector maximum supported resolution:
Windows : 2560 x 1440 @ 60 HzLinux : 1920 x 1080 @ 60 Hz
HDMI connector
29-pin HDMI connector, maximum supported resolution:
Windows : 1920 x 1200 @ 60 HzLinux : 1920 x 1080 @ 60 Hz
Simultaneous displays
Up to 3 displays (including the internal display) with a maximum of 1 display per port.
Sample clock out
Connector : SMATermination : 50 ΩFrequency : 7.8125 GHz ± 7.9 MHzAmplitude
p-p: 1.3 V (6 dBm)
Sample clock in
Connector : SMATermination : 50 ΩFrequency : 7.8125 GHz ± 7.9 MHzAmplitude
p-p : 632 mV to 2 V (0 dBm to +10 dBm)
Sync out and Sync in
Reserved for future use.
External reference input
External oscilloscope reference clock input.
Connector : BNCTermination : 50 ΩHigh accuracy reference clock : 10 MHz ± 0.00015 MHz (±15 ppm)Low accuracy reference clock : 10 MHz ± 0.01 MHz (±1000 ppm)
External reference output
Internal oscilloscope reference clock output.
Connector : BNCTermination : 50 ΩFrequency : 10 MHzAmplitude
p-p : ≥1.0 V (+4 dBm)
Auxiliary output
Acquisition Trigger Out and AFG Trigger Out.
Connector : BNCVoltage thresholds are listed in the following table:Characteristic
Limits
V
out (HI)≥ 2.5 V open circuit; ≥ 1.0 V into a 50 Ω load to ground
V
out (LO)≤ 0.7 V into a load of ≤ 4 mA; ≤0.25 V into a 50 Ω load to ground
AFG output
Connector : BNCAmplitude range
p-p : ±5 V
AFG+ and AFG- outputs
AFG+ and AFG– outputs are AC coupled differential. The single ended amplitudes are approximately 13 dB down from AFG amplitude setting.
Maximum amplitude
p-p : ≥ 300 mV (each single ended output)AFG settings : Waveform type = sine, Frequency = 100 MHz, Amplitude = 2.5 V, Load impedance = 50 Ω
Kensington-style security slot
Security slot connects to standard Kensington-style lock.
Power source
Power consumption
1600 W maximum
Source voltage
100 V to 240 V at 50 Hz to 60 Hz
Power input
IEC C20 inlet
Compatible with IEC C19 Connector, 20 Amp power cords
Physical characteristics
Dimensions
Instrument
Height : 327 mm (12.9 in)Width : 560 mm (22.1 in) handle to handle; 454 mm (17.9 in) without handlesDepth : 620 mm (24.4 in) from back of rear protector to TCA292D
HC7B transit case
Height : 448.3 mm (17.65 in)Width : 721.6 mm (28.4 in)Depth : 849.1 mm (33.43 in)
Palletized shipping box
Height : 712 mm (28.0 in)Width : 851 mm (33.5 in)Depth : 794 mm (31.3 in)
Weights
Instrument only
38.0 kg (83.7 lbs)
HC7B transit case
17.99 kg (39.66 lbs)
Instrument, HC7B, and accessories
58.6 kg (129 lbs)
Instrument, HC7B, accessories and palletized shipping box
76.8 kg (169 lbs)
Clearance requirements
51 mm (2.0 in) of clearance on the left and right side from the handles
102 mm (4.0 in) of clearance on the rear of the instrument
0 mm (0.0 in) of clearance on bottom with feet installed
20 mm (0.8 in) of clearance on the bottom with feet removed
Rackmount configuration
8U (7U instrument plus 1U with optional RM7 rackmount kit)
Environmental
Temperature
Operating: +5 °C to +40 °C (+41 °F to +104 °F)Non-operating: -20 °C to +60 °C (-4 °F to +140 °F)
Humidity
Operating: 5% to 90% relative humidity at temperatures up to +40°CNon-operating: 5% to 90% relative humidity at temperatures up to +60°C, non-condensing, and as limited by a maximum wet-bulb temperature of +39°C
Altitude
Operating: Up to 3000 meters (9800 feet)Non-operating: Up to 12,000 meters (39,300 feet)
Compliance, environmental, and safety
Product related safety and compliance
For complete safety, environmental, and compliance statements for this product,see the Safety Information section in the 7 Series DPO Performance Oscilloscope Help manual, available online at
Software
IVI driver
Provides a standard instrument programming interface for common applications such as LabVIEW, LabWindows/CVI, Microsoft .NET, and MATLAB. Compatible with Python, C/C++/C# and many other languages through VISA.
e*Scope®
Enables control of the oscilloscope over a network connection through a standard web browser. Simply enter the IP address or network name of the oscilloscope and a web page will be served to the browser. Transfer and save settings, waveforms, measurements, and screen images or make live control changes to settings on the oscilloscope directly from the web browser. Optionally configure e*Scope authentication to password protect access to control and view the oscilloscope. Embedded OS (Linux) only.
TekHSI
A high-speed interface (HSI) framework, based on the gRPC framework, that allows data movement from the oscilloscope to the PC at speeds up to 20x faster when compared to current VXI-11 ethernet (VISA) connections. TekHSI
TekDrive
Upload, store, organize, search, download, and share any file type from any connected device. TekDrive is natively integrated into the instrument for seamless sharing and recalling of files - no USB stick is required. Analyze and explore standard files like .wfm, .isf, .tss, and .csv, directly in a browser. Visit
SignalVu-PC
Advanced vector signal analysis software that can run directly on your 7 Series DPO or on a separate Windows PC. Requires Connect license (CON7xx-SVPC) installed on SignalVu-PC. xx represents NL for Node Locked license or FL for Floating License.
LXI
LXI Web interface
Connect to the oscilloscope through a standard Web browser by simply entering the oscilloscope's IP address or network name in the address bar of the browser. The Web interface enables viewing of instrument status and configuration, status and modification of network settings, and instrument control through the e*Scope web-based remote control.
Programming Examples
Programming with the 7 Series platform has never been easier. With a programmers manual and a GitHub site you have many commands and examples to help you get started remotely automating your instrument. See
Ordering information
Use the following steps to select the appropriate instrument and options for your measurement needs.
Step 1
Start by selecting a model.
Model | TekConnect inputs | 2.92 mm Planar Crown |
DPO714AX | 4 | 0 |
DPO718AX | 4 | 4 |
Each model includes:
Accessory | Tektronix part number |
Hard carrying case for 7 Series | HC7B |
Five (5) TCA292D TekConnect to 2.92 mm adapters | TCA292D |
Four (4) Planar Crown | 131-4328-xx |
Five (5) backing wrench card tools for coax cables | 003-1972-xx |
Torque wrench, 8.0 in-lbs | 067-2787-xx |
50 Ω terminator with chain (2x) on Fast Edge (front) | 131-9650-xx |
50 Ω terminator with chain (2x) on Sample Clock (rear) | 131-9650-xx |
50 Ω terminator with chain (2x) on Sync In/Out (rear) | 131-9650-xx |
Static protection wrist strap, adjustable, 6 ft coiled cord | 006-3415-xx |
Safety & Compliance Information, multi-language | 071-3807-xx |
Removable SSD with embedded OS (7-LNX) | - |
AOMEI OneKey Recovery Professional License | - |
Embedded Help (this operating manual also available as a downloadable PDF on tek.com) | 077-1859-xx |
Front cover | 200-5406-xx |
Power cord | Depends on power option selected |
Calibration certificate documenting traceability to National Metrology Institute(s) and ISO9001/ISO17025 quality system registration | - |
One-year warranty covering all parts and labor on the instrument and included accessories. | - |
Step 2
Choose the bandwidth you need today by choosing one of these bandwidth options. You can upgrade it later by purchasing a bandwidth option with greater bandwidth.
Bandwidth option | Bandwidth |
7-BW-8000 | 8 GHz |
7-BW-10000 | 10 GHz |
7-BW-13000 | 13 GHz |
7-BW-16000 | 16 GHz |
7-BW-20000 | 20 GHz |
7-BW-25000 | 25 GHz |
Step 3
This can be ordered as an option with the instrument (factory installed) or separately (field upgrade), unless otherwise noted.
Factory-installed on an instrument that is on same order (only node-locked can be factory installed), order: | DPO714AX 7- AFG |
Not factory-installed on the instrument that is on the same order (both node-locked and floating available), order: | 7-AFG |
For later installation on an existing instrument (field upgrade) (both node-locked and floating available), order: | 7-AFG-FL |
Each option in the table below is permanently licensed and available in either node-locked or floating, unless otherwise noted:
Instrument option | Built-in instrument functionality | Node-locked (no suffix) | Floating (-FL suffix) |
7-RL-1 | Extend record length from 500 Mpts/channel to 1 Gpts/channel | ✓ | ✓ |
7-RL-2 | Extend record length from 500 Mpts/channel to 2 Gpts/channel | ✓ | ✓ |
7-RL-1T2 | Extend record length from 1 Gpts/ch to 2 Gpts/ch | ✓ | ✓ |
7-AFG | Add Arbitrary Function Generator | ✓ | ✓ |
7-WIN | Add optional removable SSD with Microsoft Windows 10 operating system license (initial purchase) | N/A | N/A |
7-LNX-UP | Add additional removable SSD with embedded OS (one included standard with instrument) (field upgrade) | N/A | N/A |
7-WIN-UP | Add optional removable SSD with Microsoft Windows 10 operating system license (field upgrade) | N/A | N/A |
Step 4
This can be ordered as an option with the instrument (factory installed) or separately (field upgrade), unless otherwise noted.
Factory-installed on an instrument that is on same order (only node-locked can be factory installed), order: | DPO714AX 7- DJA |
Not factory-installed on the instrument that is on the same order (both node-locked and floating available), order: | 7-DJA |
For later installation on an existing instrument (field upgrade) (both node-locked and floating available), order: | 7-DJA-FL |
Each option in the table below is permanently licensed and available in either node-locked or floating, unless otherwise noted:
Instrument option | Optional measurement analysis capabilities | Node-locked (no suffix) | Floating (-FL suffix) |
7-DJA | Advanced jitter and eye analysis | ✓ | ✓ |
7-DJAN | Advanced Jitter plus Noise Analysis; requires option 7-DJA | ✓ | ✓ |
7-SIM | Signal Integrity Modeling; Base License; includes de-embedding, embedding, and core analysis tools | ✓ | ✓ |
7-SIMA | Signal Integrity Modeling; Advanced License; includes de-embedding, embedding, Tx/Rx equalization modeling (pre-emphasis, de-emphasis, CTLE, FFE, DFE), and clock data recovery (CDR) | ✓ | ✓ |
7-SIM-UP | Signal Integrity Modeling; Upgrade License from SIM to SIMA to Enable Equalization and CDR; requires existing SIM license | ✓ | ✓ |
7-MTM | Mask and limit testing | ✓ | ✓ |
7-UDFLT | User defined filter creation tool | ✓ | ✓ |
7-TDR | Time Domain Reflectometry (TDR) Analysis | ✓ | ✓ |
Add RF vector signal analysis
SignalVu-PC is a stand-alone application that can be run on a 7 Series oscilloscope or on a separate Windows PC to provide advanced RF vector signal analysis. In order to run SignalVu-PC on your 7 Series, the following options are required.
To run the application on the instrument, the Windows SSD (option 7-WIN) needs to be installed in the 7 Series oscilloscope.
To run the application on the instrument or on a separate PC, the Connect (CON7NL-SVPC or CON7FL-SVPC) license needs to be installed in SignalVu-PC to enable base features of the application, which includes 16+ RF measurements and displays.
Step 5
These are not options to the instrument (not factory installed); only available as a standalone product to install on a networked Windows 10 or Windows 11 PC, unless otherwise noted.
Standalone product | Clarius compliance automation test software |
AT-LPDDR4-TX | LPDDR4 Tx Automation Software |
AT-USB4-TX | USB4 and Thunderbolt Generation 3/4 Tx Automation Test Software |
AT-USB42-TX | USB4v2 Tx Automation Test Software |
RXSW-PCEI4 | PCIe Gen3/4 RX Base and CEM Automation Test Software |
This can be ordered as an option with the instrument (factory installed) or separately (field upgrade), unless otherwise noted.
Factory-installed on an instrument that is on same order (only node-locked can be factory installed), order: | DPO714AX 7- CMPCIE1234 |
Not factory-installed on the instrument that is on the same order (both node-locked and floating available), order: | 7-CMPCIE1234 |
For later installation on an existing instrument (field upgrade) (both node-locked and floating available), order: | 7-CMPCIE1234-FL |
Each option in the table below is permanently licensed and available in either node-locked or floating, unless otherwise noted:
Instrument option | Optional protocol triggering, decode, and search capabilities | Node-locked (no suffix) | Floating (-FL suffix) |
|---|---|---|---|
7-CMAPHY | Automotive SerDes (MIPI APHY) Test Automation Software using TekExpress framework; Requires option 7-WIN | ✓ | ✓ |
7-CMCPHY20 | MIPI C-PHY 1.0 C-PHY 1.1 C-PHY 2.O Transmitter Test(Tx) Automated Compliance Solution using TekExpress Framework; Requires options 7-DJA and 7-WIN | ✓ | ✓ |
7-CMDDR5SYS | DDR5 System Transmitter Test (Tx) Automated Compliance Solution using TekExpress Framework; Requires options 7-DJA and 7-WIN | ✓ | ✓ |
7-CMDP21 | DisplayPort 2.1 Transmitter Test (Tx) Automated Compliance Solution using TekExpress Framework; Requires option 7-WIN | ✓ | ✓ |
7-CMDPHY21 | MIPI D-PHY 1.2 and D-PHY 2.1 Transmitter Test (Tx) Automated Compliance Solution using TekExpress Framework; Requires options 7-DJA and 7-WIN | ✓ | ✓ |
7-CMHD21 | HDMI2.1 Transmitter Test (Tx) Automated Compliance Solution using TekExpress Framework; Requires options 7-DJA and 7-WIN | ✓ | ✓ |
7-CMHD22 | HDMI2.2 Transmitter Test (Tx) Automated Compliance Solution using TekExpress Framework; Requires options 7-DJA, 7-CMHD21, and 7-WIN | ✓ | ✓ |
7-CMLPDDR5SYS | LPDDR5 and 5x System Transmitter Test (Tx) Automated Compliance Solution using TekExpress Framework; Requires options 7-DJA and 7-WIN | ✓ | ✓ |
7-CMPCIE1234 | PCIe Gen1 Gen2 Gen3 Gen4 Tx Automated Compliance Solution using TekExpress Framework; Requires option 7-WIN | ✓ | ✓ |
7-CMUSB3 | USB 3.2 Thunderbolt 3 and 4 Transmitter Test (Tx) Automated Compliance Solution using TekExpress Framework: Requires option 7-WIN | ✓ | ✓ |
7-CMUSB4V1 | USB4V1 Tx Automated Compliance Solution using TekExpress Framework; Requires option 7-WIN | ✓ | ✓ |
7-SWX-PCIE | Switch Matrix support for PCIe Tx; requires option 7-CMPCIE1234 | ✓ | ✓ |
Step 6
Can be ordered as an option with the instrument (factory installed) or separately (field upgrade), unless otherwise noted.
Factory-installed on an instrument that is on same order (only node-locked can be factory installed), order: | DPO714AX 7- SRPCIE4 |
Not factory-installed on the instrument that is on the same order (both node-locked and floating available), order: | 7- SRPCIE4 |
For later installation on an existing instrument (field upgrade) (both node-locked and floating available), order: | 7- SRPCIE4-FL |
Each option in the table below is permanently licensed and available in either node-locked or floating, unless otherwise noted:
Instrument option | Optional protocol triggering, decode, and search capabilities | Node-locked (no suffix) | Floating (-FL suffix) |
|---|---|---|---|
7-SRNRZ | NRZ protocol decode and search | ✓ | ✓ |
7-SR128B132B | 128b132b protocol decode and search | ✓ | ✓ |
7-SR64B66B | 64b66b protocol decode and search | ✓ | ✓ |
7-SR8B10B | 8b10b protocol decode and search | ✓ | ✓ |
7-SRAERO | Aerospace protocol hardware triggering and analysis (MIL-STD-1553, ARINC429) | ✓ | ✓ |
7-SRAUDIO | Audio protocol hardware triggering and analysis (I2S, LJ, RJ, TDM) | ✓ | ✓ |
7-SRAUTO | Automotive protocol hardware triggering and analysis (CAN, LIN, FlexRay) | ✓ | ✓ |
7-AUTOEN-SS | Automotive Ethernet Signal Separation | ✓ | ✓ |
7-SRAUTOEN1 | Automotive Ethernet protocol decode and search (100Base-T1) | ✓ | ✓ |
7-SRAUTOSEN | Automotive sensor protocol hardware triggering and analysis (SENT) | ✓ | ✓ |
7-SRCOMP | Computer protocol hardware triggering and analysis (RS-232/422/485/UART) | ✓ | ✓ |
7-SRCPHY | MIPI C-PHY CSI/DSI protocol decode and search (Version 2.0/1.1/1.0) | ✓ | ✓ |
7-SRCXPI | CXPI protocol decode and search | ✓ | ✓ |
7-SRDPHY | DPHY CSI/DSI protocol decode and search (Version 2.0/1.2) | ✓ | ✓ |
7-SREMBD | Embedded protocol hardware triggering and analysis (I2C, SPI) | ✓ | ✓ |
7-SRENET | Ethernet protocol hardware triggering and analysis (10BASE-T, 100BASE-TX) | ✓ | ✓ |
7-SRESPI | eSPI protocol decode and search | ✓ | ✓ |
7-SRETHERCAT | Ethercat protocol decode and search | ✓ | ✓ |
7-SREUSB2 | eUSB2 protocol decode and search | ✓ | ✓ |
7-SRI3C | I3C protocol decode and search (I3C) | ✓ | ✓ |
7-SRMANCH | Manchester protocol decode and search | ✓ | ✓ |
7-SRMDIO | MDIO protocol decode and search, No Hardware Trigger | ✓ | ✓ |
7-SRONEWIRE | One Wire (1-Wire) protocol decode and search | ✓ | ✓ |
7-SRPCIE321 | PCIe Gen1 Gen2 Gen3 protocol decode and search and trigger | ✓ | ✓ |
7-SRPCIE4 | PCIe Gen 4 protocol decode and search and trigger | ✓ | ✓ |
7-SRPM | Power management protocol hardware triggering and analysis (SPMI) | ✓ | ✓ |
7-SRPSI5 | PSI5 protocol decode and search, No Hardware Trigger | ✓ | ✓ |
7-SRSDLC | Synchronous Data Link Control protocol decode and search | ✓ | ✓ |
7-SRSMBUS | SMBUS protocol decode and search | ✓ | ✓ |
7-SRSPACEWIRE | SPACEWIRE protocol decode and search | ✓ | ✓ |
7-SRSVID | SVID protocol decode and search | ✓ | ✓ |
7-SRUSB2 | USB2 protocol hardware triggering and analysis (USB 2.0 LS, FS, HS) | ✓ | ✓ |
7-SRUSB3 | USB3.2 protocol hardware triggering and analysis (USB 3.0, 3.1 Gen 1, 2, 3.2 Gen 1,2 ) | ✓ | ✓ |
Third-party applications are available that provide serial bus decode and analysis capabilities for use on the 7 Series. Use of the third-party applications require a Windows 10 SSD (option 7-WIN).
Serial bus | Third party contact information |
|---|---|
Embedded Multi-media Controller (eMMC) memory |
Prodigy Technovations |
Quad Serial Peripheral Interface (QSPI) - 2 enhanced IO lines for SPI | |
Secure Digital Input Output (SDIO) |

Step 7
Add additional recommended probes and adapters:
Recommended probe / adapter | Interface | Description |
P7725 | TekConnect | 25 GHz TriMode differential probe |
P7720 | TekConnect | 20 GHz TriMode differential probe |
P7716 | TekConnect | 16 GHz TriMode differential probe |
P7713 | TekConnect | 13 GHz TriMode differential probe |
P7708 | TekConnect | 8 GHz TriMode differential probe |
P7633 | TekConnect | 33 GHz TriMode differential probe |
P7630 | TekConnect | 30 GHz TriMode differential probe |
P7625 | TekConnect | 25 GHz TriMode differential probe |
TCA292D | TekConnect | TekConnect to 2.92 mm 50 Ω, 33 GHz adapter |
TDP1500 | TekVPI | 1.5 GHz differential probe (requires TCA-VPI50 adapter for use with the 7 Series) |
Looking for other probes? Check out the probe selector tool at
Add additional recommended coax cables:
Recommended coax cable | Description |
|---|---|
PMCABLE1M | 2.92-to-2.92 mm cable pair, straight, 1.5 ps phase-matched, 1 m, 40 GHz |
174-6658-01 | SMP-to-SMP cable pair, right-angle, 2.5 ps phase-matched, 300 mm, 20 GHz |
174-6659-01 | SMP-to-SMP cable pair, right-angle, 2.5 ps phase-matched, 1000 mm, 20 GHz |
174-6663-01 | 2.92-to-2.92 mm cable pair, straight, 1.5 ps phase-matched, 500 mm, 40 GHz |
174-6664-01 | SMA-to-SMA cable pair, straight, 1.5 ps phase-matched, 200 mm, 20 GHz |
174-6665-01 | SMA-to-SMA, single cable, right-angle, 300 mm, 20 GHz |
174-6666-01 | SMA-to-SMA, single cable, right-angle, 500 mm, 20 GHz |
174-6667-01 | SMA-to-SMA, single cable, right-angle, 1.829 m, 20 GHz |
174-6978-00 | 2.92-to-2.92 mm cable pair, straight, 1.5 ps phase-matched, 2 m, 40 GHz |
For custom coax cable cables:

Step 8
Optional accessory | Description |
HC7B | Hard carrying (transit) case for the 7 Series The HC7B is included standard with all new DPO714AX and DPO718AX; order the HC7B if additional or replacements are needed. |
RM7 | Rackmount kit for the 7 Series |
GPIB to Ethernet adapter | Order model 4865B (GPIB to Ethernet to Instrument Interface) directly from ICS Electronics |
Step 9
Optional accessories | Description |
A0 | North America power plug (115 V, 60 Hz) |
A1 | Universal Euro power plug (220 V, 50 Hz) |
A2 | United Kingdom power plug (240 V, 50 Hz) |
A3 | Australia power plug (240 V, 50 Hz) |
A4 | North America power plug (240 V, 60 Hz) |
A5 | Switzerland power plug (220 V, 50 Hz) |
A6 | Japan power plug (100 V, 50/60 Hz) |
A10 | China power plug (50 Hz) |
A11 | India power plug (50 Hz) |
A12 | Brazil power plug (60 Hz) |
A99 | No power cord |
Step 10
Protect your investment and your uptime with a service package for your instrument.
Optimize the lifetime value of your purchase and lower your total cost of ownership with a calibration and extended warranty plan for your instrument. Plans range from standard warranty extensions covering parts, labor, and 2-day shipping to Total Product Protection with repair or replacement coverage from wear and tear, accidental damage, ESD or EOS. See the below table for specific service options available on the 7 Series family of products. Compare factory service plans
Additionally, Tektronix is a leading accredited calibration services provider for all brands of electronic test and measurement equipment, servicing more than 140,000 models from 9,000 manufacturers. With 100+ labs worldwide, Tektronix serves as a global partner, delivering tailored whole-site calibration programs with OEM quality at a market price. View whole site calibration service capabilities
Add extended service and calibration options
Service options | Description |
R4 | Standard Warranty Extended to 4 Years. Covers parts, labor and 2-day return shipping within country. All repairs include calibration and firmware updates. |
R6 | Standard Warranty Extended to 6 Years. Covers parts, labor and 2-day return shipping within country. All repairs include calibration and firmware updates. |
T4PLUS | Four (4) Year Total Protection Plan, includes all features of Extended Warranty Plan plus complete coverage against accidental damage (including electrostatic discharge and overstress), 4 accredited calibration events, 5-day calibration and 10-day-repair turnarounds. |
T6PLUS | Six (6) Year Total Protection Plan, includes all features of Extended Warranty Plan plus complete coverage against accidental damage (including electrostatic discharge and overstress), 6 accredited calibration events, 5-day calibration and 10-day-repair turnarounds. |
CD1 | Calibration with full data report service 1 year. Includes traceable calibration where applicable with full data report, for recommended calibrations. Coverage includes 1 calibration events over 1 year. |
CD3 | Calibration with full data report service 3 years. Includes traceable calibration where applicable with full data report, for recommended calibrations. Coverage includes 3 calibration events over 3 years. |
CD5 | Calibration with full data report service 5 years. Includes traceable calibration where applicable with full data report, for recommended calibrations. Coverage includes five calibration events over five years. |
D1 | Calibration data report. |
ISO | Single ISO 17025A Calibration delivered with New Product |
ACC3 | Accredited Calibration Service 3 years. Includes two ISO17025A calibration events during the three years following instrument shipment. For initial ISO17025A calibration on new products - MUST order ISO option |
ACC5 | Accredited Calibration Service 5 years. Includes four ISO17025A calibration events during the three years following instrument shipment. For initial ISO17025A calibration on new products - MUST order ISO option |
Bandwidth upgrades after purchase
The analog bandwidth of 7 Series instruments can be upgraded after initial purchase. Bandwidth upgrades are purchased based on the current bandwidth and the desired bandwidth. All bandwidth upgrades can be performed in the field by installing a software license and a new front panel label.
Oscilloscope model owned | Bandwidth upgrade product | Upgrade option | Upgrade option description |
|---|---|---|---|
DPO714AX | 7-BWAX4 | 7-BW80T100-AX4 | Upgrade from 8 GHz to 10 GHz bandwidth on a (4) Channel AX model |
7-BW80T130-AX4 | Upgrade from 8 GHz to 13 GHz bandwidth on a (4) Channel AX model | ||
7-BW80T160-AX4 | Upgrade from 8 GHz to 16 GHz bandwidth on a (4) Channel AX model | ||
7-BW80T200-AX4 | Upgrade from 8 GHz to 20 GHz bandwidth on a (4) Channel AX model | ||
7-BW80T250-AX4 | Upgrade from 8 GHz to 25 GHz bandwidth on a (4) Channel AX model | ||
7-BW100T130-AX4 | Upgrade from 10 GHz to 13 GHz bandwidth on a (4) Channel AX model | ||
7-BW100T160-AX4 | Upgrade from 10 GHz to 16 GHz bandwidth on a (4) Channel AX model | ||
7-BW100T200-AX4 | Upgrade from 10 GHz to 20 GHz bandwidth on a (4) Channel AX model | ||
7-BW100T250-AX4 | Upgrade from 10 GHz to 25 GHz bandwidth on a (4) Channel AX model | ||
7-BW130T160-AX4 | Upgrade from 13 GHz to 16 GHz bandwidth on a (4) Channel AX model | ||
7-BW130T200-AX4 | Upgrade from 13 GHz to 20 GHz bandwidth on a (4) Channel AX model | ||
7-BW130T250-AX4 | Upgrade from 13 GHz to 25 GHz bandwidth on a (4) Channel AX model | ||
7-BW160T200-AX4 | Upgrade from 16 GHz to 20 GHz bandwidth on a (4) Channel AX model | ||
7-BW160T250-AX4 | Upgrade from 16 GHz to 25 GHz bandwidth on a (4) Channel AX model | ||
7-BW200T250-AX4 | Upgrade from 20 GHz to 25 GHz bandwidth on a (4) Channel AX model |
Oscilloscope model owned | Bandwidth upgrade product | Upgrade option | Upgrade option description |
|---|---|---|---|
DPO718AX | 7-BWAX8 | 7-BW80T100-AX8 | Upgrade from 8 GHz to 10 GHz bandwidth on a (8) Channel AX model |
7-BW80T130-AX8 | Upgrade from 8 GHz to 13 GHz bandwidth on a (8) Channel AX model | ||
7-BW80T160-AX8 | Upgrade from 8 GHz to 16 GHz bandwidth on a (8) Channel AX model | ||
7-BW80T200-AX8 | Upgrade from 8 GHz to 20 GHz bandwidth on a (8) Channel AX model | ||
7-BW80T250-AX8 | Upgrade from 8 GHz to 25 GHz bandwidth on a (8) Channel AX model | ||
7-BW100T130-AX8 | Upgrade from 10 GHz to 13 GHz bandwidth on a (8) Channel AX model | ||
7-BW100T160-AX8 | Upgrade from 10 GHz to 16 GHz bandwidth on a (8) Channel AX model | ||
7-BW100T200-AX8 | Upgrade from 10 GHz to 20 GHz bandwidth on a (8) Channel AX model | ||
7-BW100T250-AX8 | Upgrade from 10 GHz to 25 GHz bandwidth on a (8) Channel AX model | ||
7-BW130T160-AX8 | Upgrade from 13 GHz to 16 GHz bandwidth on a (8) Channel AX model | ||
7-BW130T200-AX8 | Upgrade from 13 GHz to 20 GHz bandwidth on a (8) Channel AX model | ||
7-BW130T250-AX8 | Upgrade from 13 GHz to 25 GHz bandwidth on a (8) Channel AX model | ||
7-BW160T200-AX8 | Upgrade from 16 GHz to 20 GHz bandwidth on a (8) Channel AX model | ||
7-BW160T250-AX8 | Upgrade from 16 GHz to 25 GHz bandwidth on a (8) Channel AX model | ||
7-BW200T250-AX8 | Upgrade from 20 GHz to 25 GHz bandwidth on a (8) Channel AX model |
7 Series Investment Protection Program (IPP)
As signals get faster and new standards are developed, your investment in a 7 Series oscilloscope can evolve with your needs. You can upgrade the bandwidth of the oscilloscope you own today. You can take advantage of 7 Series performance improvements by upgrading your existing MSO/DPO70000DX or DPO70000SX oscilloscope to a new 7 Series oscilloscope. Contact your local Tektronix representative to discuss the full range of options available with the 7 Series Investment Protection Program (IPP) to ensure you have the best tools you need for your next project.