Introduction
A function generator is a test instrument that can generate and output standard waveforms, such as sine and square waves. Function generators allow a user to quickly switch between waveforms and change their characteristics. Typical characteristics include frequency, amplitude, and offset; however, waveforms with more complex timing may need additional user inputs. Desired capabilities will vary across different applications; thus, establishing the needs of the application is paramount. For example, you may need accurate voltage control for testing sensors or simulating power supply disturbances. Conversely, a custom output may prove useful for battery cycling or replicating a biomedical signal. Prior to selecting a function generator and instrument utilization, one must first properly identify the required capabilities for the application at hand. Now that we have defined the capabilities of a function generator, we can observe how this behavior is replicated on an interactive source measure unit (SMU) – such as the Keithely Series 2450, 2460, 2461, or 2470 – using the AFG TSP App.
Generating a Waveform on an SMU
To generate functions on an SMU, we must create a way to control frequency, amplitude, offset, etc. The simplest way to control amplitude is to store voltage or current values in a source configuration list. Once a list is populated with values, it can be recalled and output at any time. Utilizing a config list is essential to function generation on an SMU. Unlike function generators, an SMU does not have pre-loaded waveforms that can immediately be sourced. Instead, an SMU must generate or build a signal before it can be output. This allows us to create continuous and burst functions by repeatedly sourcing the config list.
While the SMU allows for a user to define both source and measure configuration lists, we will focus on the former. The source config list will hold source values that define the incremental levels at which the output will be set, in other words, the amplitude. Each amplitude point in the source config list is defined by using a formula similar to what is shown in Figure 1. Note that in the following figures, we will use a sine wave to explain this concept.
Figure 1. Amplitude control during sine wave generation.
An offset is the amount of displacement of the source signal it has from its zero-crossing point. Offset can effortlessly be accounted for by modifying the values before they are stored in the list. Adjusting each individual index of the list afterwards would nearly double the time it takes to create a waveform; therefore, modifying the values as they are stored in the list speeds up the generation process.

Figure 2. Offset control during sine wave generation.
Frequency control is more challenging, as the SMU instrument may not have originally been designed with this capability in mind. At first, one may suggest taking advantage of a time delay command. In other words, if we wait a specified amount of time between each sourced point, we can achieve frequency control. This is not desirable, as it would create a step function if the time delay was large enough.

Figure 3. Frequency control using time delay.
To achieve smooth waveforms and avoid this behavior, we must output points in the list as fast as possible. Thus, we must control frequency in another way: by increasing or decreasing the number of points in the list. For example: If it takes one second to individually source 1000 points, we can theoretically produce a 2 Hz waveform using 500 points. The app uses this concept to generate and output arbitrary functions. Note that as we increase the frequency of the waveform, the number of points will eventually lead to one. With one point, we can only source a constant voltage/ current. Different waveforms will require a minimum number of points to be produced; this minimum number of points is directly related to the frequency limits on the SMU.

Figure 4. Frequency control during sine wave generation.
With this process, waveforms requiring amplitude, offset, and frequency can be controlled. Other waveforms may require time delays or additional features to produce. However, the three previous controls provide a general description of generating most waveforms.
Using the AFG TSP App
The AFG TSP App simplifies this function generation process and equips the user with the ability to quickly change waveforms and settings. Please reference “Specifications” in the appendix at the end of this document to view the app’s function generation capabilities. To use the app, download the smuafg .tspa file from tek.com and place it into the root directory of your USB drive. Next, insert the drive on the instrument’s front panel. Press the “MENU” button followed by selecting the “Apps” to go to the Apps Manager page. You will now see the app, which can be run directly from the USB or saved to the instrument. Touch “Run” to start the app.
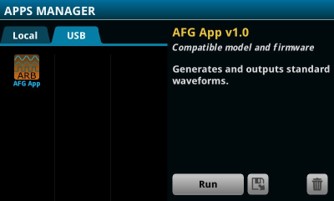
Figure 5. Apps Manager page.
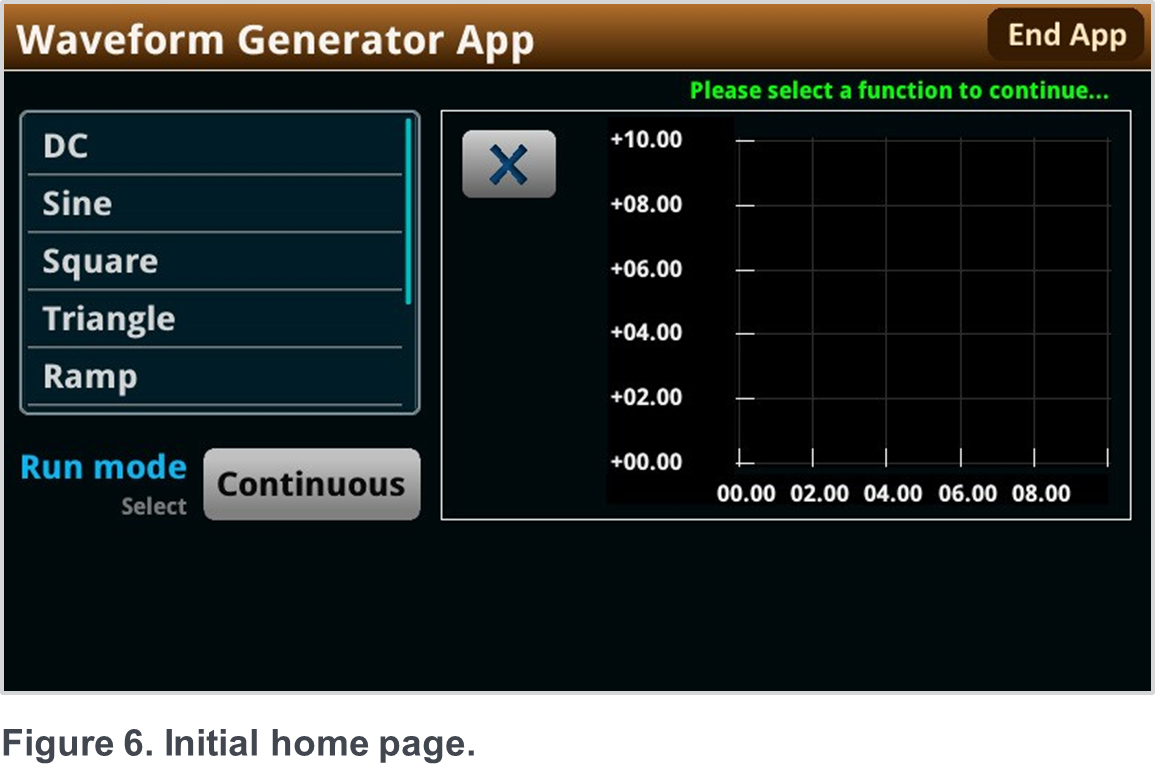
The app will open to the home page, which provides the user with a list of available functions, as well as a run mode option. Generated functions will be displayed in the graphing area.
Navigate through the list to find your desired waveform. Tap the option to open a menu with specific settings for the selected waveform. Here, you may select between voltage and current sourcing, triggering options, and waveform characteristics. Figure 7 shows settings used for a 5 V sine wave with a frequency of 2 Hz.
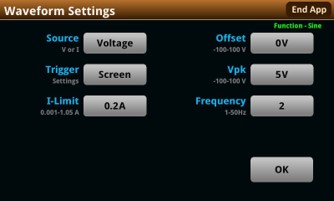
Figure 7. Waveform Settings page.
After all desired settings have been selected, touch “OK.” The app will recognize that a user has set up a waveform and return you to the home screen. A “Generate” button will then be made available on the screen.
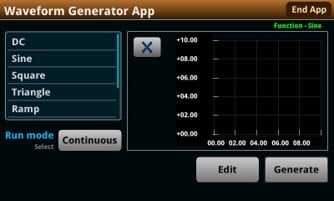
Figure 8. Function ready to generate.
As previously mentioned, the SMU must generate one cycle of a waveform before being able to output it. Tapping “Generate” will begin the process of generating a function. The time for generation will vary based off the number of data points required to generate the waveform. In general, a lower frequency will result in a longer generation time. The app will display the “Generate” button whenever a change in waveform settings has created the need to develop a new config list.
At this point, the app will perform a final check for invalid settings (such as an amplitude setting outside the instrument’s limits). If an invalid setting is found, the app will display a warning notice on the screen. If a notice occurs, check your input settings and modify as needed.
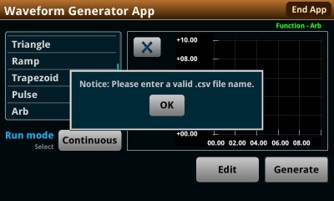
Figure 9. Example warning notice.
If all input settings are valid, the app will begin to build the function. Because generating and graphing takes some time, the “Generate” button will turn into a “Wait” button. Note that this button does not have any functionality and merely serves as a notice to the user. The graph will update as values are stored in the buffer, serving as a loading bar for this process.

Figure 10. Generating a function.
When the generation process is complete, one cycle of the waveform will be displayed on the graph, allowing the user to check waveform characteristics.
Using the AFG TSP App with Screen Trigger
Screen triggering is enabled through the waveform settings and setting the trigger option to “Screen”. This trigger option should be used when external triggering is not necessary, as it allows the
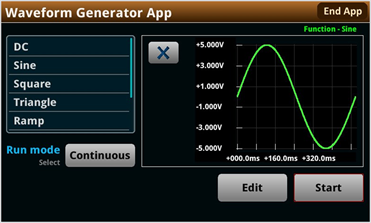
Figure 11. Function ready to output.
Touching the “Start” button (after configuration) will enable the waveform to run for the specified number of cycles, which is determined by the “Run Mode” setting. “Continuous” mode will output the waveform indefinitely, while “Burst” mode will output for a defined number of cycles. This “Run Mode” setting may be changed without needing to generate a new config list; simply select the desired option and press “Start”.
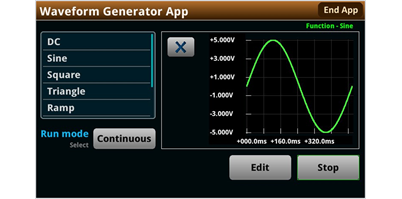
Figure 12. Output on.
With the output turned on, the “Start” button text will then be replaced by “Stop”. The app constantly checks for this button’s input and will interrupt the output at the end of the cycle if it is pressed. To maximize frequency settings, the output will only be interrupted at the end of the cycle. If this introduces any problems, please note that the output can always be immediately shut off using the “OUTPUT” button on the front panel. When the desired number of cycles is completed (or the user taps the “Stop” button), the app will revert to the output ready state shown in Figure 11.

Figure 13. Trigger model ready to initiate.
With the function generated and displayed in the plot area, the trigger model is set up to wait for the selected trigger.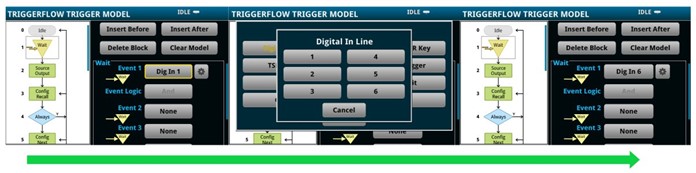
Figure 14. Changing a trigger event.
By default, the external trigger is set to digital input line 1.
However, this setting may be changed by pressing the
“MENU” button and navigating to Trigger->Configure. Select Block 1 (the Wait block) and change Event 1 as necessary.
Note that the function and trigger model must be generated prior to editing. When all settings have been adjusted as needed, you can return to the home screen by pressing the “HOME” button. Tapping “Initiate” will start the trigger model, changing the “Initiate” button text into “Wait”. This indicates that the trigger model is running.
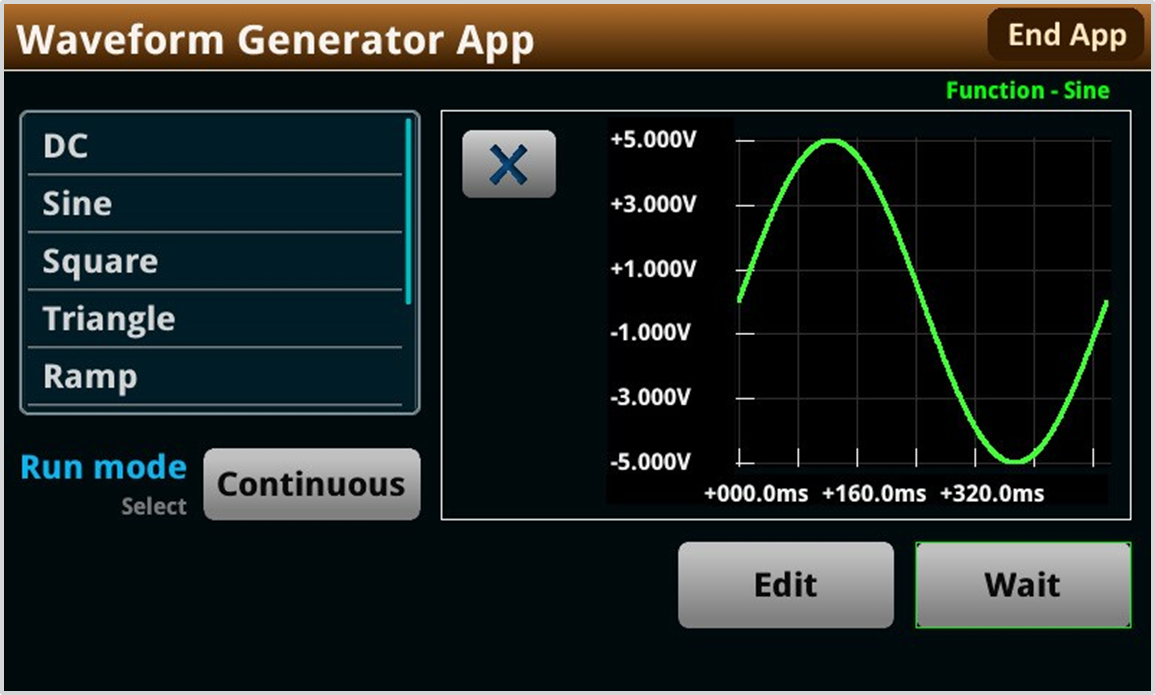
Figure 15. Trigger model is running.
This trigger model cannot be interrupted while running. An app restart is necessary if the trigger is not set up correctly at this stage. To avoid disruption in your test flow, ensure that your trigger event is set up correctly prior to starting the output. When the trigger model has been executed, the app will return to the initiate stage shown in Figure 13.
App Features
This app was designed with usability in mind. Multiple features were added to make the waveform generation process simple for new users. Please keep them in mind while you use the app.
- Current Waveforms: The app can generate current waveforms in addition to voltage. When the app sources voltage or current, it will limit the complementary setting.
- Preview Waveform: One cycle of the waveform will be displayed in the preview box once it has been generated. This preview will update its units and scale as needed. Note that after one cycle of the waveform is displayed in the preview, the signal is ready to send to the output. This enables the preview to also serve as a waveform generation progress bar.
- Settings Tracking: The “Generate” button in the bottom right corner changes based off various user inputs and settings. First, the app automatically detects when a new signal needs to be generated and replaces the text on the button to “Generate”. This avoids unnecessary builds and user errors. Additionally, the button color will change based on the current state of the app. The colors and buttons adhere to the following flow diagrams.
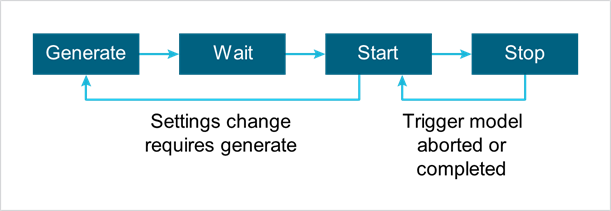
Figure 16. Screen trigger state diagram.
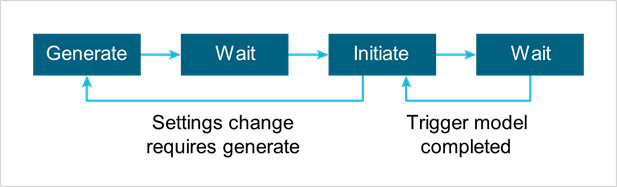
Figure 17. Setup trigger state diagram.
- Arbitrary Waveform Generation: The app supports arbitrary waveform generation. To use this feature, create a .csv file with a voltage value on each line (up to 10,000 lines). For example:
|
1 |
|
1.002 |
|
1.004 |
|
… |
Table 1. Example of arbitrary waveform defined in a CSV file.
Save this file into the root directory of a USB flash drive and insert it into the instrument’s front panel. Select “Arb” as the desired function and input the file path into the “File name” string input (the input should follow the format: “/usb1/your_file_name.csv”).
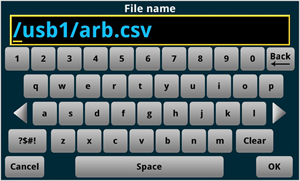
Figure 18. Arbitrary waveform setup.
After these steps, the waveform can be generated and output. The waveform should be tested to obtain the desired frequency.
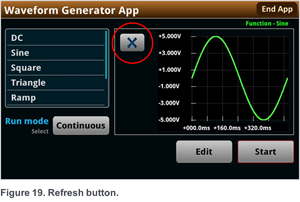
- Refresh Check Button: A check button on the screen enables the user to refresh the screen.

Figure 19. Refresh button.
Conclusion
Measuring electrical signals allows a user to observe their device’s behavior, store data, etc. However, the desired input signal is not always readily available and must be provided externally. Thus, the use of a function generator is needed to provide an input to the system. The AFG app for the Keithley 2450, 2460, 2461, and 2470 interactive source measure units broadens the instrument’s sourcing capabilities, enabling the SMU to fill this important role when required. Please visit tek.com for additional information and to download the app.