Introduction
Bode plots are commonly used in analyzing the frequency response of a system. They provide a graphical representation of magnitude and phase over a range of frequencies that can be used to analyze and understand the behavior of circuits. Overall, Bode plots are a powerful tool for circuit analysis, as they provide a clear and intuitive representation of a circuit’s frequency response characteristics, aiding in design, optimization, and troubleshooting of electronic systems.
Bode plots can be generated manually by collecting data on magnitude and phase values at different input signal frequencies; the values can then be manually plotted on graph paper to generate a Bode plot. If many data points are collected, software such as Excel, MATLAB or Python can be leveraged to plot the data.
The 2 Series MSO, with option 2-SOURCE OR 2-ULTIMATE,offers a built-in function generator and a Bode plot feature.
On the 4/5/6 Series MSO, the Bode plot feature requires the power measurement and analysis option (PWR). It is under the Control Loop Response Analysis measurement.
Select Tektronix oscilloscopes offer a built-in function generator and a Bode plot feature, enabling users to more easily and accurately analyze and explore their circuit design. This built-in feature allows users to automatically vary the function generator output frequency based on user selection, capture both the input and the output signals and generate Bode plots.
Understanding Bode Plots
Bode plots contain two plots: magnitude response (gain) plot and phase response plot. They visualize how a system responds to different frequencies and provide insight into the gain and phase characteristics of a system.
The gain plot, displayed in logarithmic scale, shows the magnitude response of a system as a function of frequency. By using a logarithmic scale, the frequency axis can span several orders of magnitude without sacrificing resolution. The logarithmic scale compresses the higher frequencies towards the right side of the plot, allowing a more uniform representation of the entire frequency range.
The phase plot, displayed in degrees, indicates the amount and direction of the phase shift. The phase response can vary from –180° to +180°. The phase plot shows how the system affects the timing and synchronization of signals at different frequencies. It also complements the magnitude plot in providing a comprehensive view of the system’s frequency response.
Insights from Bode Plots
Bode plots provide several insights for circuit analysis,including the following:
1. Gain and Attenuation
Bode plots show the gain or attenuation of a circuit at different frequencies. The magnitude plot indicates how the circuit amplifies or attenuates signals at different frequencies. This information is crucial for understanding the overall gain or loss in a circuit and identifying its frequency response characteristics.
2. Bandwidth
Bandwidth refers to the range of frequencies over which the circuit operates effectively. By examining the magnitude plot, you can identify the frequency range where the gain is within a specified range (e.g., –3 dB), representing the circuit’s usable bandwidth.
3. Filter Analysis
Bode plots provide valuable insights into filter circuits, such as low-pass, high-pass, band-pass, and band-stop filters. They show the cutoff frequencies, roll-off rates, and passband/stopband characteristics. Bode plots help visualize how the circuit selectively allows or rejects certain frequency components, aiding in filter design and analysis.
4. Phase Response
Bode plots also display the phase response of a circuit. The phase plot indicates the phase shift introduced by the circuit at different frequencies. This information is crucial when analyzing systems with time delays or phase-sensitive applications like audio signal processing and feedback control systems.
5. Stability Analysis
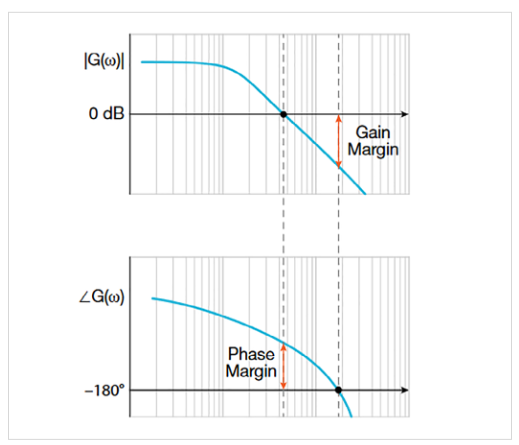
Bode plots are used to analyze the stability of feedback control systems. Breaking the loop in stability analysis, commonly known as “opening the loop” or “opening the feedback loop”, is a technique used to simplify the analysis of a complex control system by considering only the openloop transfer function. This can be especially helpful when using a Bode plot to analyze stability. By examining the magnitude and phase plots of the open-loop transfer function, engineers can determine stability margins, such as gain and phase margins. These margins indicate the system’s stability and the degree of robustness against disturbances and variations.
6. Resonance and Frequency Selectivity
Bode plots help identify resonant frequencies and frequency selectivity in circuits, especially in systems involving reactive components like capacitors and inductors. The magnitude plot shows peaks or resonant frequencies, while the phase plot indicates the phase shift around those frequencies.
Generating Bode Plots with the 2 Series MSO
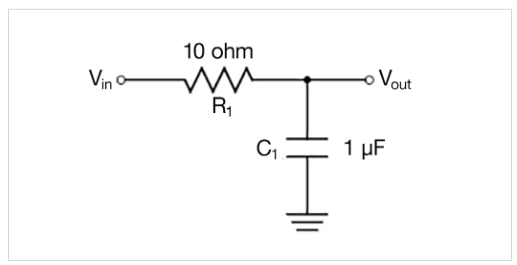
To demonstrate how to generate Bode plots on the 2 Series MSO, the following example will be using a simple firstdegree low pass filter. It is a passive filter that only consists of a capacitor and resistor in series.
The RC network is using a 10 ohm resistor and 1 µF capacitor.
Use the formula below to calculate cutoff frequency.
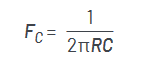
The cutoff frequency is around 16 kHz.
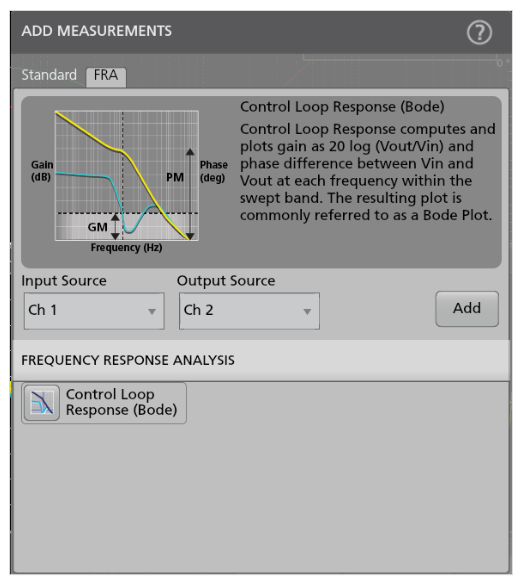
To launch Bode plots in the 2 Series MSO, add a new measurement by pressing the Measure button. Bode plots are under the FRA tab. See Figure 3.
To configure the Bode plots, use either the built in AFG or an external Tektronix AFG (AFG31000). See Figure 4. The built in AFG supports up to 50 MHz signal generation.
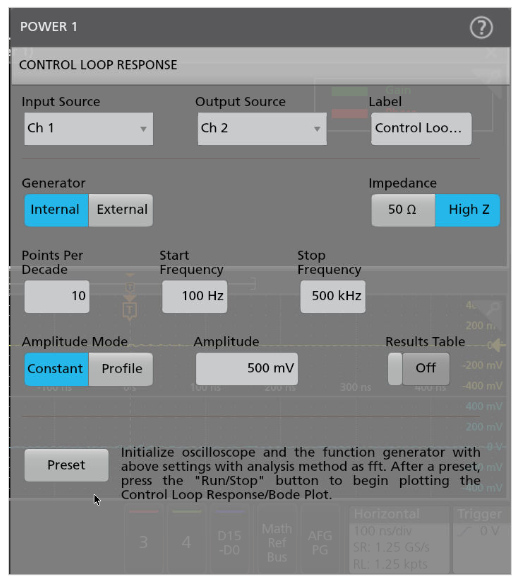
Setup the Start and Stop frequency to configure the sweeping frequency range. Points per decade represents the spacing or density of data. A reasonable range for the number of points per decade is between 5 to 10. The default setting is 10 points per decade.
After everything is setup, press the Preset button to apply the setup for the AFG and initialize the oscilloscope.
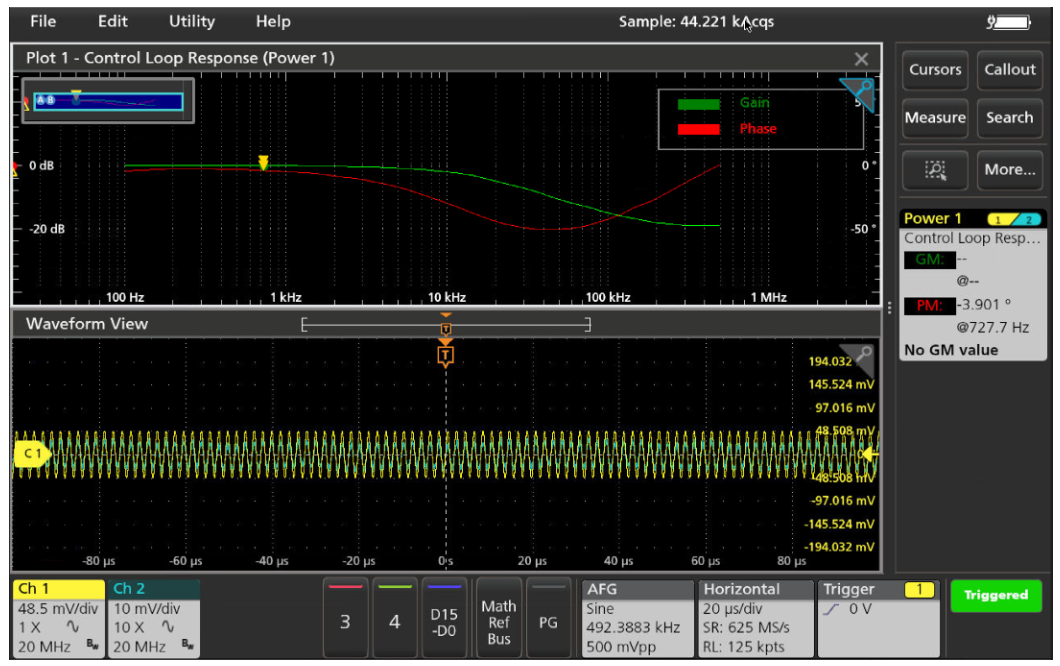
To start the capture and the plot the data, press the Run/ Stop button on the front panel or click on the Run/Stop Status on screen button located in the lower right corner.
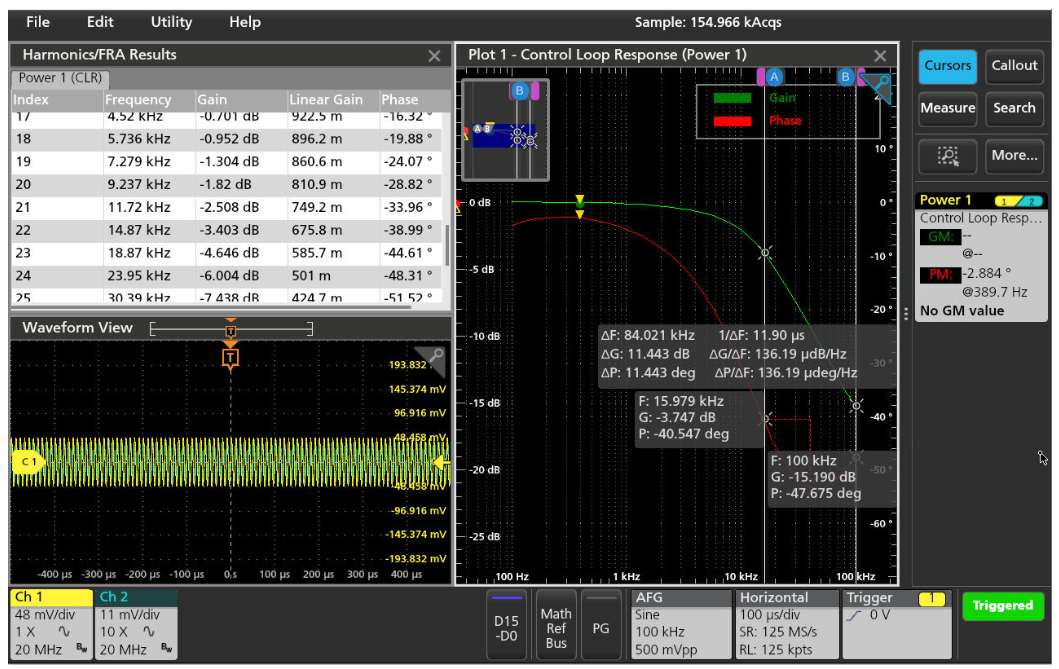
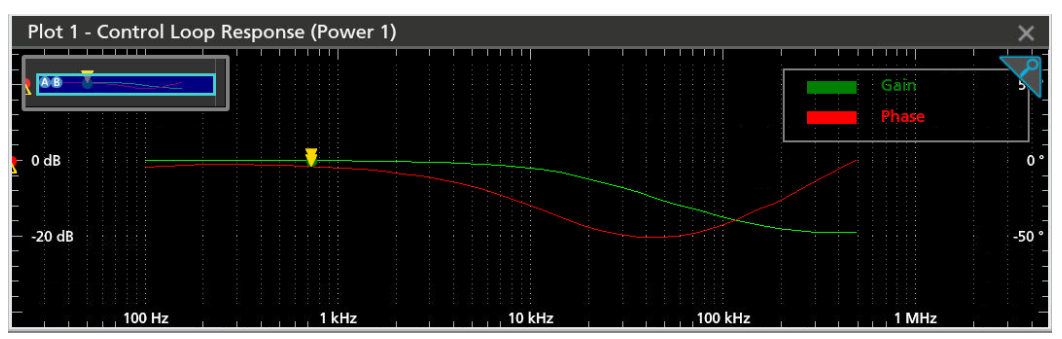
Use cursors and the results table to look up more details from the Bode plots. In Figure 7, for the simple RC network with a 10 ohm resistor and 1 µF capacitor (discussed earlier) with cutoff frequency around 16 kHz, which matches our calculation, the phase plot shows about –40°, which is close to the ideal phase angle of -45° for that cutoff frequency. You can also detect the cutoff frequency has a higher roll off from the gain plot.
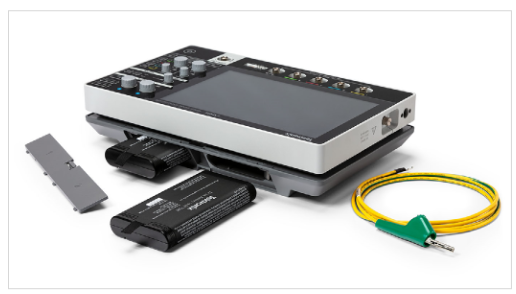
Discover insights and optimize your circuits with the flexibility of the 2 Series MSO. Its small and portable form factor, optional battery power, and built-in features like Bode plots enable measurements anywhere and data analysis on the go.
Find more valuable resources at TEK.COM
Copyright © Tektronix. All rights reserved. Tektronix products are covered by U.S. and foreign patents, issued and pending. Information in this publication supersedes that in all previously published material. Specification and price change privileges reserved. TEKTRONIX and TEK are registered trademarks of Tektronix, Inc. All other trade names referenced are the service marks, trademarks or registered trademarks of their respective companies.
092023 48W-74034-0