Contact us
Call us at
Available 6:00 AM – 5:00 PM (PST) Business Days
Download
Download Manuals, Datasheets, Software and more:
Feedback
RF Recording and Playback Solutions
RF Recording and Playback Solutions
Introduction
Spectrum management, RF interference analysis, signal acquisition, product testing and validation, RF system design, communication security and academic research all routinely perform or can benefit from the ability to continuously capture signal activity “off-the-air” over long periods, digitize and store it, and play it back. High-performance, real-time spectrum and signal analyzers are excellent equipment for capturing signal information over short periods, digitizing it with high fidelity, and storing it. However, when long-term signal capture is required, most spectrum analyzers can be used only as the “front end” of recording because of limited internal storage (size dependent on SSD). Thus, recording and playback solutions that can continuously record and store signal capture data for hours or days are necessary. The function generators or arbitrary waveform generators will be used as the playback components.
This application note describes the basic knowledge of RF recording and the playback system containing the recording components, and storage and playback components.It also illustrates the benefits of Tektronix real-time spectrum analyzers when they are considered as the capture components of recording and playback systems. The advantages of SignalVu- PC and DataVu-PC software for software playback are described. Two solutions from Tektronix are then provided.
Why Do We Need Recording and Playback Systems?
For field testing, the requirements to record real-world signal environments with high fidelity and replay the environment to test products in the lab are significant.Also, for spectrum management, rather than using spectrum analyzers with limited internal storage, recording and playback systems with large storage capacities can record a long-term signal for hours or days based on the requirements.
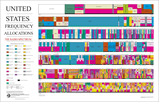
Furthermore, the process of finding signals in dense electromagnetic environments is difficult. As seen in Figure 1, this is due to the proliferation of wireless communication services, especially below 6 GHz. The most appealing frequencies between 150 MHz and 3 GHz are full. In this environment, finding a signal originating from someone whose goal is to avoid detection is difficult, especially if it is weaker than other signals at the same frequency.
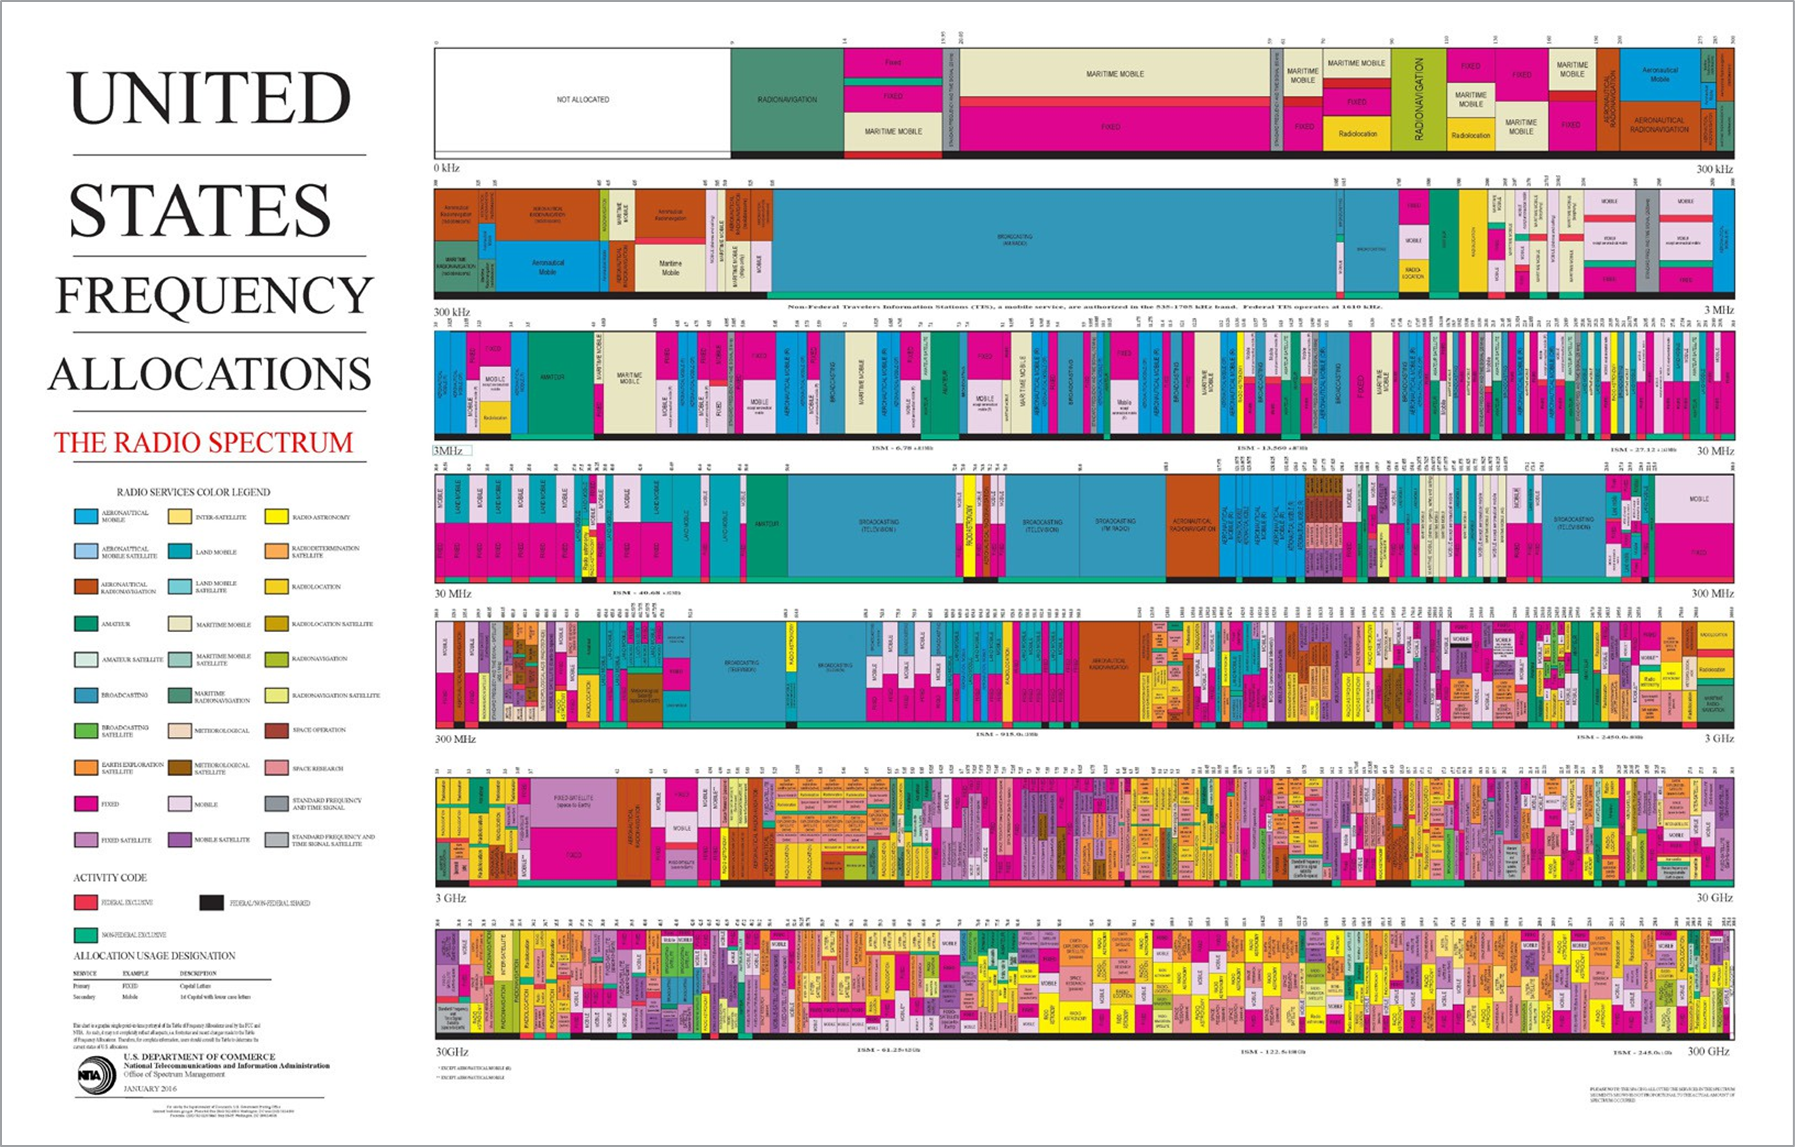
Figure 1. A frequency spectrum chart that shows the dense packing of RF and microwave allocations.
Thus, a system that includes an extremely sensitive receiver to regenerate the original fidelity of the captured signal is the key to meet the challenges faced in recording and playback.
Besides the hardware components, the system also requires analysis software that can playback a recording file for hours or days, find a signal of interference, remove it from its spectral environment and “zoom-in” to determine what it is.
What Are Recording and Playback Systems?
A recording and playback system has three elements: signal capture, signal recording and signal playback. A block diagram of the system is shown in Figure 2.
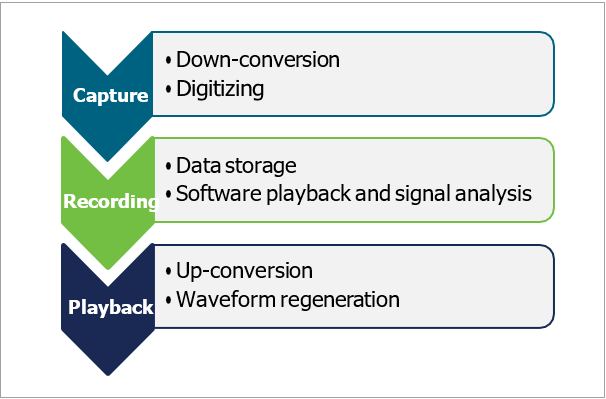
Figure 2. The diagram of a general recording and playback system.
Signal capture (top of Figure 2) forms the receiving front end and downconverter which transforms input signals into a digital sample stream. The data stream will be stored either internally or externally, depending on the capacity of capture storage and the length of the captured signal. Software can be used as software playback to analyze the stored data. For hardware playback, the recorder will convert the digital I/Q samples to analog I/Q data, and then streams the data to an external source for remodulation and retransmission.
Application Examples
Three examples where recording and playback systems can be used are presented as follows.
Interference Hunting
As wireless service has become critical to our daily lives, the population of wireless devices (cell phones, microwave ovens, poorly shielded power lines, fluorescent and neon lights or dimmer switches) keeps increasing. One of the drawbacks of having many electronic devices is that they emit electronic signals which disrupt other radio and wireless signals. The “noise” created by these signals causes interference with other nearby signals and disrupts transmissions—a significant issue for engineers and spectrum managers.
Figure 3. Interference hunting.
Distributed Antenna System (DAS)
Due to the ever-growing demands for access to wireless communication and data systems, DAS is a perfect solution. A DAS network provides many spatially separated antennas connected to a common source. DAS can split the transmitted power among different antenna elements in the same area as a single antenna but with reduced total power and improved reliability. Figure 4 compares a single antenna system to DAS.
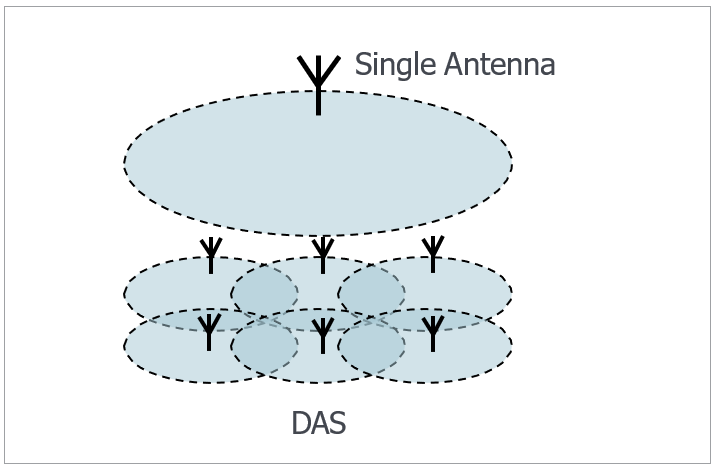
Figure 4. A single antenna versus a distributed antenna system.
Wearable Technology and the Internet of Things
Wearable technology has dramatically evolved in recent years, which is a hot topic related to the Internet of Things (IoT). Wearables such as fitness trackers, smartwatches, hearables, and smart glasses are changing the way that customers interact with their environment. Also, they make data connection and processing more efficient. Searching for interference among the equipment is an essential problem. Figure 5 describes how wearable technology affects our daily lives.
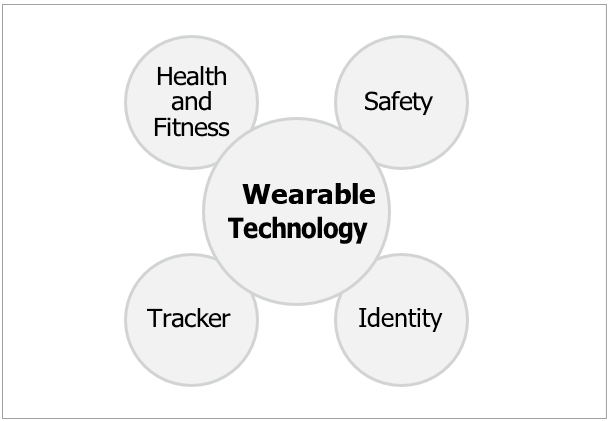
Figure 5. Wearable technology will change the way of our daily life.
Recording and Playback Systems
System Description
Due to the intermittence and transiency of interference, engineers or researchers may take minutes, hours or days to capture the signal. Thus, capturing data without gaps is significant when doing signal analysis. Figure 6 describes the process of capture, record, and playback, and its relationship with hardware and software. Based on different requirements, software or hardware playback can be chosen.
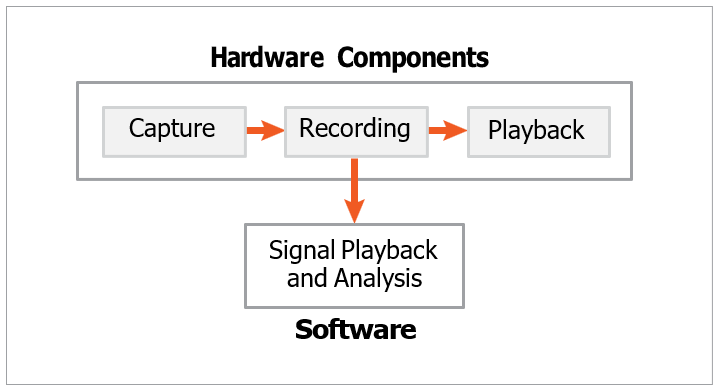
Figure 6. A typical recording and playback system includes both hardware and software.
Recording and playback systems use real-time spectrum analyzers such as the RSA300/500/600 Series or RSA7100 Series. They are used as the receiving front end that provides digital I/Q sample streams to the recorder. The data is stored by the recorder either internally or externally for software playback by SignalVu-PC or DataVu-PC software. For hardware playback, the recorder transfers the I/Q samples to a playback device for remodulation and retransmission. The playback device can be either the AWG5200 or AWG70000 Series, based on the requirement of carrier frequency.
Types of Systems
There are two types of recording and playback systems.
All-in-one Device
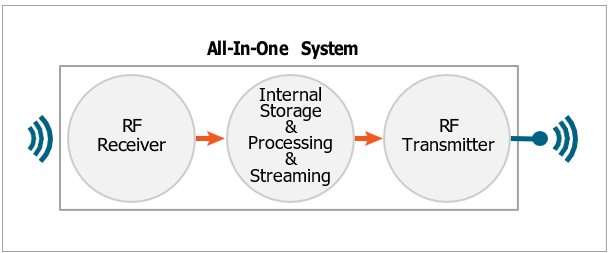
Figure 7. All-in-one device contains the RF receivers, storage and processing components, and RF transmitters in one box.
The all-in-one device is a fully self-contained recording and playback system with a box that has very high fidelity to easily capture signals in complex environments and playback a real- world environment in the laboratory. This system can be controlled directly from a front panel touch screen, laptop, tablet or PC.
One device is enough because this system comprises of a built- in RF receiver, internal storage components and a built-in RF transmitter, which will decrease the cost of field test for customers.
RF Receiver, I/Q Data Generator and RF Generator
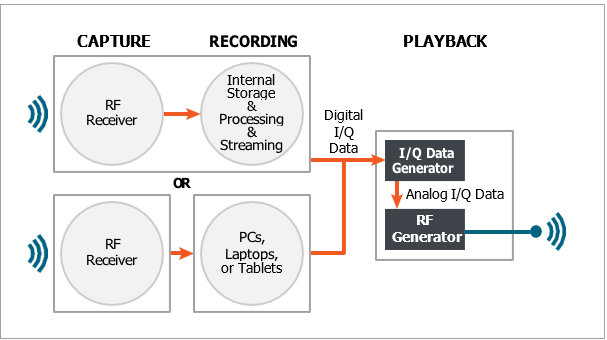
Figure 8. There are two types of RF receivers in this system. The first type of receivers contains built-in storage components so that the external storage components are unneeded. The second type can be controlled by PCs, laptops or tablets with USB 3.0 so that the streaming data will be saved in these controlling devices.
In this case, there are two types of receivers: the first type of receivers, such as RSA7100 series, contains built-in storage components so that the external storage components are unneeded; the second type of receivers, such as RSA300/500/600 series, can be controlled by PCs, laptops or tablets with a USB 3.0 connection so that the streaming I/Q data will be saved in these controlling devices.
Signal Capture and Analysis
Signal capture is used for receiving, downconverting, digitalizing and analyzing signals of interest. The features of real-time processing and trigger are the crucial functions to signal capture and analysis.
Real-Time Processing and DPX Mode
The term “real-time” is derived from early work on digital simulations of physical systems. Real-time spectrum analyzers perform their processing speed fast enough to keep pace with changes in the captured signal. Meanwhile, they perform all computations continuously and fast enough that the output of the analysis keeps up with the change in the input signal.
The architecture of the real-time spectrum analyzers is designed to overcome the measurement limitations of swept spectrum analyzers or vector signal analyzers. As well, real-time spectrum analyzers better address the challenges with transient and dynamic interferences, and discover events that are invisible to other architectures to trigger on those events, allowing their selective capture into memory. Once stored, the data can be analyzed either internally or externally based on the length.
DPX technology is designed to identify and measure transient signals. It additionally helps customers to continuously observe wide bandwidth in real time. The main performance parameter for DPX technology in real- time spectrum analyzers is the minimum duration for a 100 percent probability of intercept (POI) of a single event (i.e., the minimum duration of a signal that can be accurately measured and observed with 100 percent probability when the spectrum of that signal is higher than the noise floor level of the instrument).
Three major factors determine the 100% POI value: Span, RBW and FFT length. Table 1 gives a brief example (based on the RSA7000 series) that shows how these factors affect POI specification.
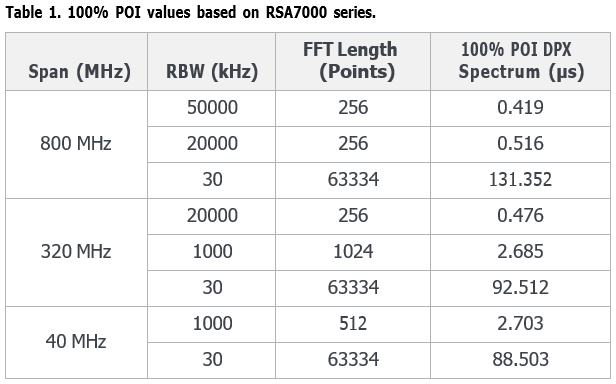
Three observations can be made from Table 1:
- Increasing Span will simultaneously increase the 100% POI value with the same RBW and FFT Length.
- Increasing RBW will decrease 100% POI value with the same Span and FFT Length.
- Increasing FFT Length will increase the 100% POI value if RBW is kept the same.
Trigger
When searching for signals of interest, triggers can make the difference between detection and failure. They make possible the identification of specific points in a seamless I/Q capture record, making these points far easier to find, especially when the file contains data recorded over a long period. The trigger types described below are unique to Tektronix real-time spectrum analyzers.
Other triggering techniques can detect signals that exceed an amplitude threshold. However, they cannot find a signal at a specific frequency if another signal of higher amplitude is randomly present at the same frequency. Runt triggering addresses some but not all signal-under-signal cases. Only the Tektronix DPX density trigger can discriminate signals within a specific range of amplitudes and frequencies.Besides where the signal might show up on the display, the operator does not have to know other characteristics of the target signal.
When a target signal appears, the density value increases. And as the trigger system monitors the density measurement, it activates a trigger whenever the density value exceeds the adjustable density threshold. The threshold need only be set to a level between the normal density readings and the density caused by the offending signal. The instrument software can also compute the threshold value automatically. If a wideband modulated signal such as a chirp is present and another signal of lesser amplitude is beneath it, both are seen because the latter signal occupies the frequency all the time and the chirp sweeps through it infrequently.
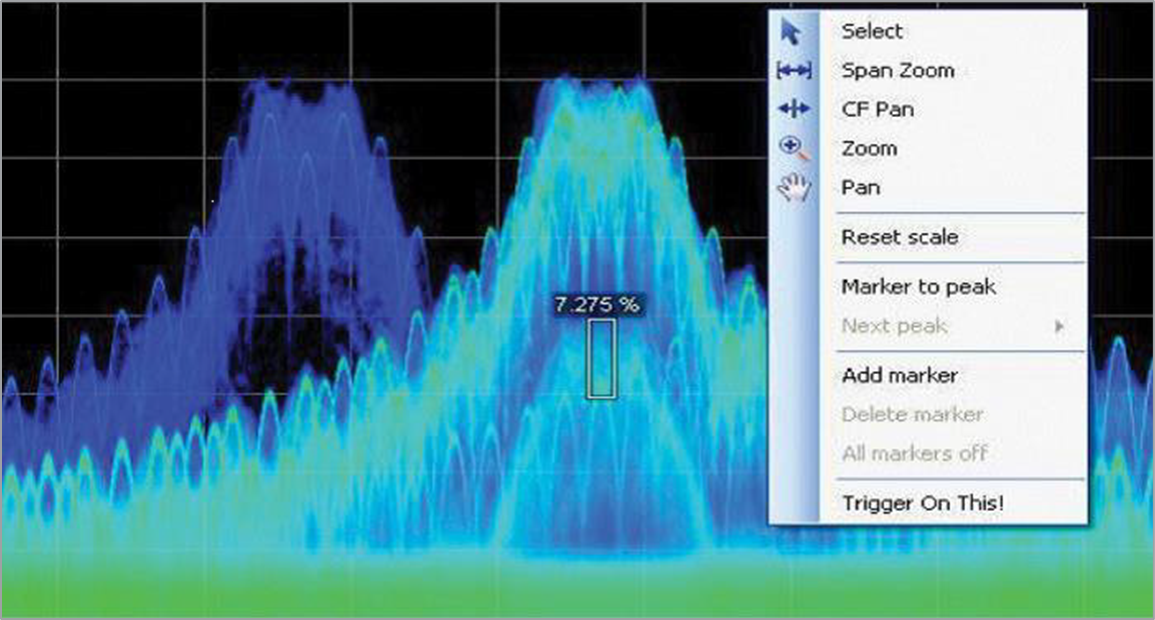
Figure 9. DPX density trigger activated by the “Trigger on This” allows the RSA to trigger on signals underneath other signals when separated by time or distinguished by their density of occurrence.
Frequency mask triggering, also known as frequency domain triggering, compares the spectrum shape on the display to a user-defined mask so that the instrument can trigger on changes in a spectrum shape. This ability makes it possible to trigger on weak signals in the presence of stronger ones, a useful feature when trying to detect random or intermittent signals in the presence of intermodulation products, transient signals, interference and suspect emitters. The mask is created by defining a set of frequency points in their amplitudes, point by point, either graphically or with a mouse. Points can even be automatically drawn based on user-defined amplitude and frequency offsets from a given spectrum trace. Triggers can be set to occur when a signal outside the mask enters within its bounds or when a signal inside the mask boundary exceeds it.
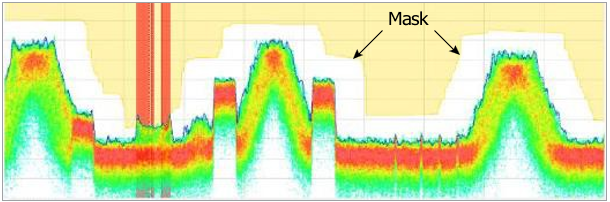
Figure 10. A mask can be created on the DPX spectrum display with actions taken upon every violation, including stop, save a picture, save acquisition or send an audible alert.
Recording and Storage
There are two ways to save I/Q data for later signal playback or analysis: I/Q block and I/Q streaming.
I/Q Block
Three types of files are provided to save I/Q data by block (time frame): TIQ for acquisition data with setup, and CSV (comma- separated value) and MAT (MATLAB format) for acquisition data exports.
I/Q Streaming and Storage
I/Q streaming means the digital I/Q data will be streamed to disk for long-term seamless recording. Figure 11 describes the difference between I/Q block storage and I/Q streaming storage.
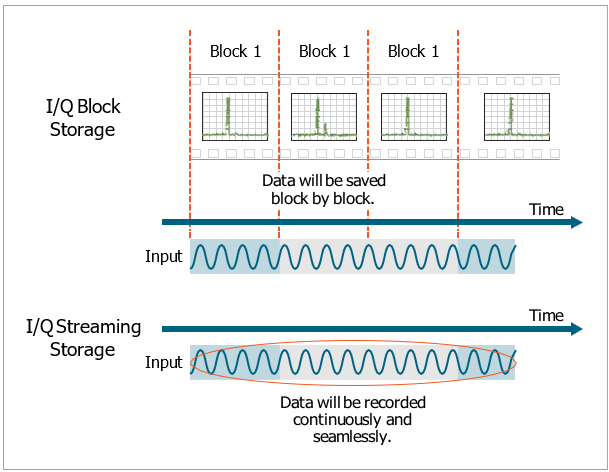
Figure 11. I/Q block storage versus I/Q streaming storage.
The RSA300/500/600 series of USB analyzers offer streaming RF recording capacity over a USB 3.0 port. RF signals over a 40 MHz bandwidth at the analyzer’s center frequency can be seamlessly streamed to disk in the host PC. An SSD is requiredto perform the streaming to keep up with the high-speed writing rate of approximately 13 GB per minute. The RF streaming can be performed simultaneously with other analysis displays up and running.
The benchtop RSA7100 Series of real-time spectrum analyzers can stream IQ data directly to disk for long-term seamless recording. The RSA7100 series can stream up to 800 MHz of bandwidth to a built-in RAID system. The RAID recording systems can record tens of terabytes of I/Q data, which can represent hours of seamless wideband RF recording. RF streaming can be performed simultaneously with real-time spectrum and signal analysis.
For the RSA300/500/600/7100 series, the devices can do the DPX analysis and recording process simultaneously. In Figure 13, the software analyzes the 92.3 MHz FM channel using DPX Spectrum with the signals from the FM channel recorded as I/Q data at once.
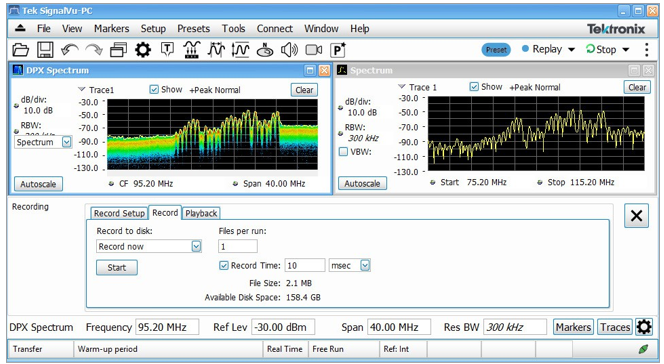
Figure 12. The recording of the 92.3 MHz FM channel with SignalVu-PC.
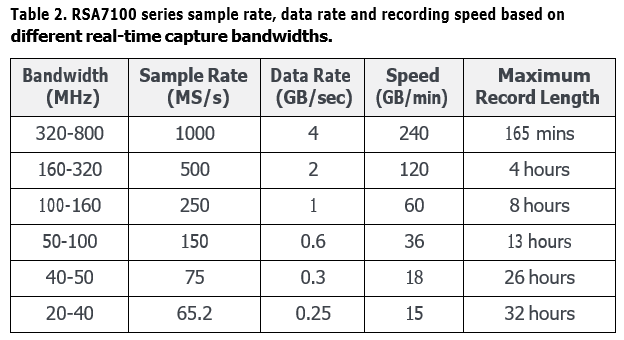
Table 2 presents the RSA7100 series sample rate, data rate and recording speed based on different real-time capture bandwidths.
Playback
Software Playback
Tektronix offers two different analysis software, SignalVu- PC and DataVu-PC, to support recording and playback solutions.
DataVu-PC analysis software is designed for recordings.It makes short work of searching through large datasets for signals of interest. Pulses can be measured and signals marked for export to other analysis programs, reducing time spent in post- capture analysis.
When a long-term signal is recorded for hours, DataVu-PC software can playback the large recorded file, which brings the ability to view spectrums versus time and amplitude versus time. As well, it can perform signal searches, pulse analysis and the ability to select time segments of interest for export to SignalVu- PC for deeper signal analysis. Figure 13 shows a 10 GHz (center frequency) pulse playback on DataVu-PC.
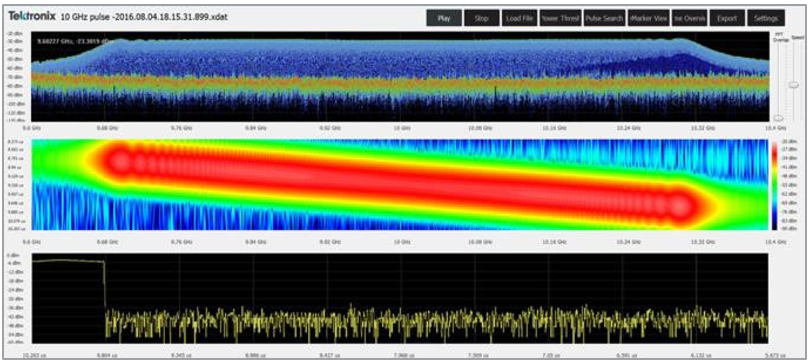
Figure 13. Playback of a 10 GHz pulse with DataVu-PC.
SignalVu-PC is the foundation of RF and vector signal analysis software that helps validate RF designs. It is supported on the RSA7100 Series of benchtop analysis and the RSA300/500/600 Series of USB analyzers. Analysis of acquisitions can now be moved off the instrument and elsewhere.
SignalVu-PC analysis software provides the option for playback of recorded files. Playback of recorded signals can reduce hours of watching for a spectral violation in recorded data to minutes. Recording length is limited only by storage media size, and recording is a basic feature included in SignalVu-PC. The playback function allows for complete analysis by all SignalVu-PC measurements, including DPX Spectrogram. Minimum signal duration specifications are maintained during playback. AM/FM audio demodulation can be performed. Variable span, resolution bandwidth, analysis length and bandwidth are also available.
Frequency mask testing can be done on recorded signals, with actions on mask violation including beep, stop, save trace, save picture and save data. Portions of the playback can be selected and looped for repeat examination of signals of interest. Playback can be skip-free, or time gaps can be inserted to reduce review time. A Live Rate playback ensures fidelity of AM/FM demodulation and provides a 1:1 playback versus actual time.
Clock time of the recording is displayed in the spectrogram markers for correlation to real-world events. Figure 14 displays the replaying of an FM band located at 92.3 MHz.
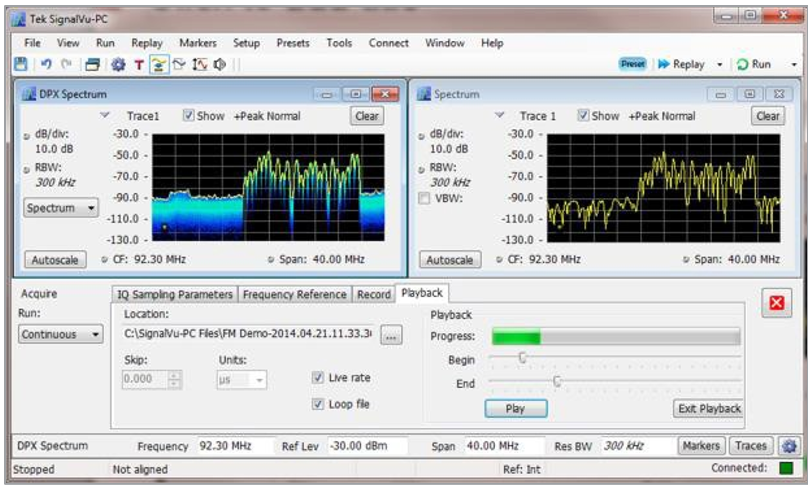
Figure 14. The playback of the 92.3 MHz FM channel with SignalVu-PC.
RF Hardware Playback
Hardware playback is also significant to recreate the complex environment under testing.
In Figure 15, the digital I/Q data is transmitted into the AWG5200 series for playback. For the AWG5200 series, the direct generation of wideband signals with carriers is up to 4 GHz.
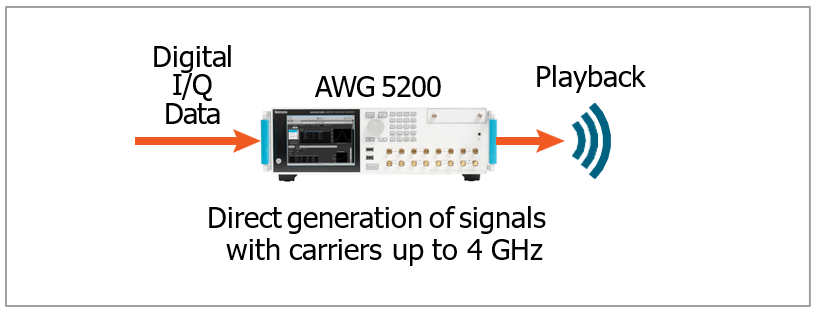
Figure 15. The hardware playback system based on the AWG5200 series.
The AWG70000 Series can also be used for hardware playback. In Figure 16, the direct generation of wideband signals with carriers is up to 20 GHz, which can remove the need for external RF conversion.
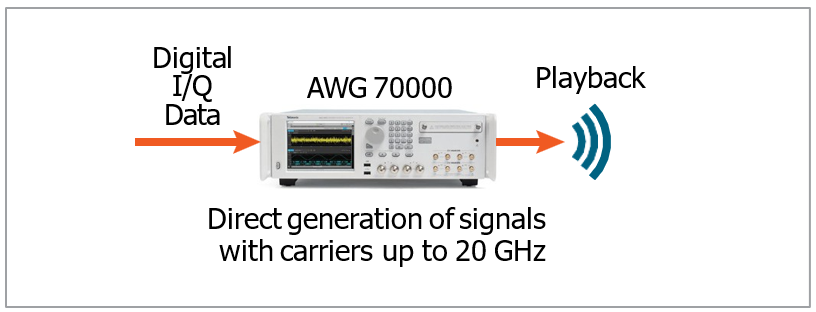
Figure 16. The hardware playback system based on the AWG70000 series.
Although a higher frequency of signals is required, AWG5200 or AWG71000 series can generate analog I/Q data of baseband and stream the signals to a VSG when the required frequency is higher than 20 GHz. If a higher DAC resolution is needed, choose AWG5200 (16-bit); if a wider I/Q baseband is needed, choose AWG70000.
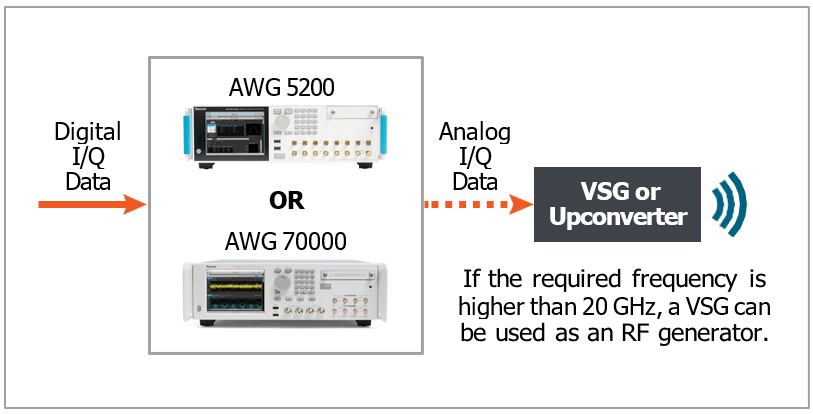
Figure 17. This setup is used for a system where the required frequency is higher than 20 GHz.
Tektronix Solutions
RSA+AWG+VSG
The RSA300/500/600 Series of USB analyzers or RSA7100 Series of benchtop analyzers can be employed as the capture devices. For the RSA300/500/600 Series, customers’ Windows laptops or tablets can be used as external storage devices. For the RSA7100 Series, streaming the capture to its built-in RAID system at full MHz bandwidth for up to two hours enables environment recording and analysis of long event sequences. Finally, the playback components are similar to the solution one.
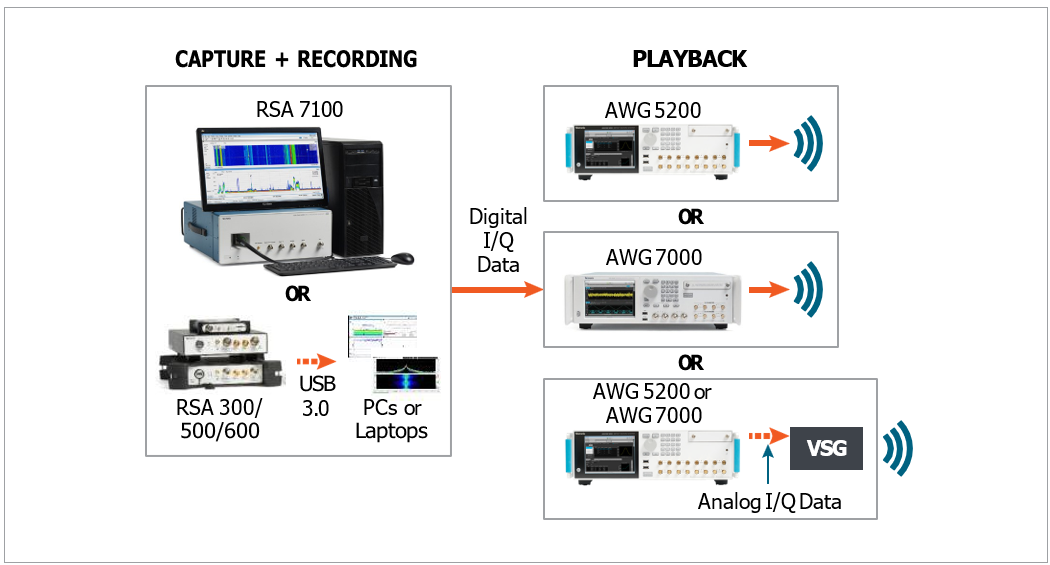
Figure 18. RSA300/500/600 series or RSA7100 series recording and playback solutions.
Summary
Tektronix provides solutions for recording and playback systems based on its real-time spectrum analyzers and arbitrary waveform generators. Designed for recording and playback, the DataVu-PC software makes searching through large datasets for signals of interest more efficient. Also, in the playback process, DataVu-PC software can select and export time segments of interest to SignalVu-PC for deeper signal analysis. The combination of hardware and software designed for recording and playback will make a great contribution to your success.