Contact us
Call
Call us at
Available 9 AM - 5 PM CET Business Days
Download
Download Manuals, Datasheets, Software and more:
Feedback
Spectrum Analyzers
RSA6000B Series Datasheet. (This product is no longer sold by Tektronix.)
The products on this datasheet are no longer being sold by Tektronix.
View Tektronix Encore for reconditioned test equipment.
Check support and warranty status for these products.
RSA6000B Series Datasheet. (This product is no longer sold by Tektronix.)
This datasheet covers models RSA6106B, RSA6114B and RSA6120B.
The RSA6000 Series gives you the functionality of a high-performance spectrum analyzer, wideband vector signal analyzer, and the unique trigger-capture-analyze capability of a real-time spectrum analyzer - all in a single package. A typical 20 dBm TOI and -151 dBm/Hz DANL at 2 GHz gives you the dynamic range you expect for challenging spectrum analysis measurements.
Notice to EU customers
This product is not updated to comply with the RoHS 2 Directive 2011/65/EU and will not be shipped to the EU. Customers may be able to purchase products from inventory that were placed on the EU market prior to July 22, 2017 until supplies are depleted. Tektronix is committed to helping you with your solution needs. Please contact your local sales representative for further assistance or to determine if alternative product(s) are available. Tektronix will continue service to the end of worldwide support life.
Key Performance Specifications
- 20 dBm 3rd order intercept at 2 GHz, typical
- Displayed average noise level –151 dBm/Hz at 2 GHz (–167 dBm/Hz, preamp on, typical) enables low-level signal search
- Revolutionary DPX displays transients with a minimum event duration of 3.7 μs
- Trigger on frequency edge or power level transients with a minimum event duration of 3.7 μs in the frequency domain, 9.1 ns in time domain
- Up to 7.15 s acquisitions at 110 MHz bandwidth can be directly stored as MATLAB™ compatible files
Key Features
- High-performance spectrum analysis
- Fully preselected and image free at all times for maximum dynamic range at any acquisition bandwidth
- Fastest high-resolution sweep speed: 1 GHz sweep in 10 kHz RBW in less than 1 second
- Internal preamp up to 20 GHz
- Discover
- DPX® spectrum processing provides an intuitive understanding of time-varying RF signals with color-graded displays based on frequency of occurrence
- Swept DPX spectrum enables unprecedented signal discovery over full instrument span
- Trigger
- DPX density™ trigger activated directly from DPX display
- Time-qualified and runt triggers trap elusive transients
- Frequency mask trigger captures any change in frequency domain
- Capture
- Gap-free DPX spectrogram records up to 4444 days of spectral information for analysis and replay
- Interfaces with TekConnect® probes for RF probing
- Analyze
- Time-correlated multidomain displays for quicker understanding of cause and effect when troubleshooting
- Standard power, spectrum, and statistics measurements help you characterize components and systems: channel power, ACLR, power vs. time, CCDF, OBW/EBW, and spur search
- AM/FM/PM modulation and audio measurements (Opt. 10)
- Phase noise and jitter measurements (Opt. 11)
- Settling time measurements, frequency, and phase (Opt. 12)
- Pulse measurements (Opt. 20): More than 30 pulse measurements, acquisition of more than 200,000 pulses possible for post analysis and cumulative statistics.
- General purpose digital modulation analysis (Opt. 21) provides vector signal analyzer functionality for over 20 modulation types
- Simple and complete APCO Project 25 transmitter compliance testing and analysis for Phase 1 (C4FM) and Phase 2 (TDMA) (Opt. 26)
- WLAN analysis for 802.11 a/b/g/j (Opt 23), 802.11n (Opt. 24), 802.11ac (Opt. 25)
- Noise figure and gain measurements (Opt. 14)
-
Bluetooth® Analysis (Opt. 27)
- Signal strength function provides audio tone and visual indication of received signal strength
-
LTE™ FDD and TDD Base Station (eNB) Transmitter RF measurements (Opt. 28)
Applications
- Spectrum management – find interference and unknown signals
- Radar/EW – full characterization of pulsed and hopping systems characterize radar and pulsed RF signals
- RF debug – components, modules, and systems
- Radio/Satellite communications – analyze time-variant behavior of cognitive radio and software-defined radio systems
- EMI diagnostics – increase confidence that designs will pass compliance testing
- Long Term Evolution (LTE), Cellular
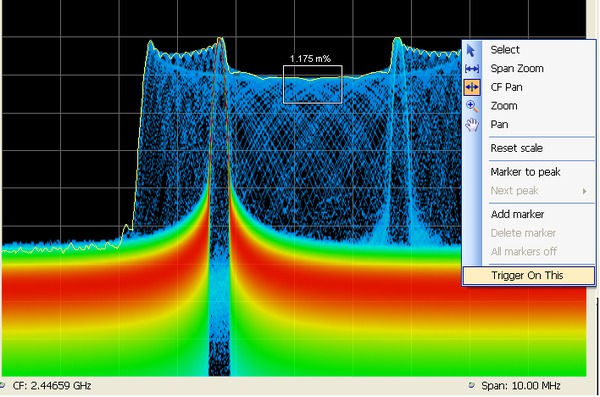
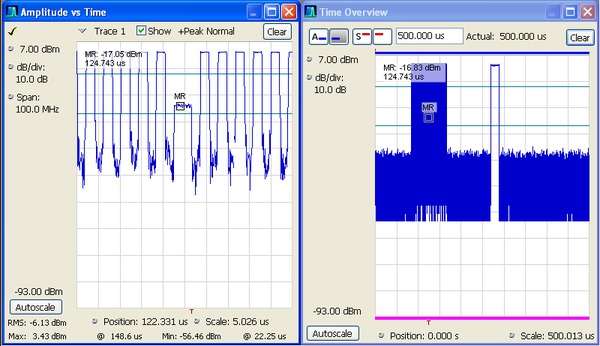
Revolutionary DPX ® spectrum display reveals transient signal behavior that helps you discover instability, glitches, and interference. Here, an infrequently occurring transient is seen in detail. The frequency of occurrence is color-graded, indicating the infrequent transient event in blue and the noise background in red. The DPX Density™ Trigger is activated, seen in the measurement box at the center of the screen, and Trigger On This™ has been activated. Any signal density greater than the selected level causes a trigger event.
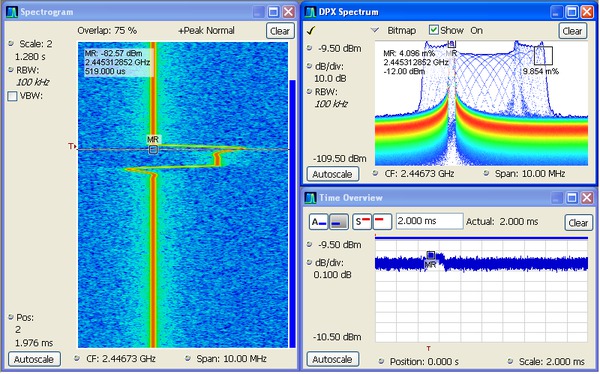
Trigger and Capture: The DPX Density™ Trigger monitors for changes in the frequency domain, and captures any violations into memory. The spectrogram display (left panel) shows frequency and amplitude changing over time. By selecting the point in time in the spectrogram where the spectrum violation triggered the DPX Density™ Trigger, the frequency domain view (right panel) automatically updates to show the detailed spectrum view at that precise moment in time.
High performance spectrum and vector signal analysis, and a lot more
The RSA6000 Series replaces conventional high-performance signal analyzers, offering the measurement confidence and functionality you demand for everyday tasks. A typical 20 dBm TOI and -151 dBm/Hz DANL at 2 GHz gives you the dynamic range you expect for challenging spectrum analysis measurements. All analysis is fully preselected and image free. The RSA6000 Series uses broadband preselection filters that are always in the signal path. You never have to compromise between dynamic range and analysis bandwidth by 'switching out the preselector'.
A complete toolset of power and signal statistics measurements is standard, including Channel Power, ACLR, CCDF, Occupied Bandwidth, AM/FM/PM, and Spurious measurements. Available Phase Noise and General Purpose Modulation Analysis measurements round out the expected set of high-performance analysis tools.
But, just being a high-performance signal analyzer is not sufficient to meet the demands of today’s hopping, transient signals.
The RSA6000 Series will help you to easily discover design issues that other signal analyzers may miss. The revolutionary DPX®spectrum display offers an intuitive live color view of signal transients changing over time in the frequency domain, giving you immediate confidence in the stability of your design, or instantly displaying a fault when it occurs. Once a problem is discovered with DPX®, the RSA6000 Series spectrum analyzers can be set to trigger on the event, capture a contiguous time record of changing RF events, and perform time-correlated analysis in all domains. You get the functionality of a high-performance spectrum analyzer, wideband vector signal analyzer, and the unique trigger-capture-analyze capability of a real-time spectrum analyzer - all in a single package.
Discover
The patented DPX®spectrum processing engine brings live analysis of transient events to spectrum analyzers. Performing up to 292,968 frequency transforms per second, transients of a minimum event duration of 3.7 μs in length are displayed in the frequency domain. This is orders of magnitude faster than swept analysis techniques. Events can be color coded by rate of occurrence onto a bitmapped display, providing unparalleled insight into transient signal behavior. The DPX spectrum processor can be swept over the entire frequency range of the instrument, enabling broadband transient capture previously unavailable in any spectrum analyzer. In applications that require only spectral information, the RSA6000 Series provides gap-free spectral recording, replay, and analysis of up to 60,000 spectral traces. Spectrum recording resolution is variable from 110 μs to 6400 s per line, allowing multiple days of recording time.
Trigger
Tektronix has a long history of innovative triggering capability, and the RSA Series spectrum analyzers lead the industry in triggered signal analysis. The RSA6000 Series provides unique triggers essential for troubleshooting modern digitally implemented RF systems. Trigger types include time-qualified power, runt, density, and frequency mask.
Time qualification can be applied to any internal trigger source, enabling capture of'the short pulse' or 'the long pulse'in a pulse train, or only triggering when a frequency domain event lasts for a specified time. Runt triggers capture troublesome infrequent pulses that either turn on or turn off to an incorrect level, greatly reducing time to fault.
DPX Density™ Trigger works on the measured frequency of occurrence or density of the DPX display. The unique Trigger On This™ function allows the user to simply point at the signal of interest on the DPX display, and a trigger level is automatically set to trigger slightly below the measured density level. You can capture low-level signals in the presence of high-level signals at the click of a button.
The Frequency Mask Trigger (FMT) is easily configured to monitor all changes in frequency occupancy within the acquisition bandwidth.
A Power Trigger working in the time domain can be armed to monitor for a user-set power threshold. Resolution bandwidths may be used with the power trigger for band limiting and noise reduction. Two external triggers are available for synchronization to test system events.
Capture
Capture once - make multiple measurements without recapturing. All signals in an acquisition bandwidth are recorded into the RSA6000 Series deep memory. Record lengths vary depending upon the selected acquisition bandwidth - up to 7.15 seconds at 110 MHz, 343.5 seconds at 1 MHz, or 6.1 hours at 10 kHz bandwidth with Deep Memory (Opt. 53). Real-time capture of small signals in the presence of large signals is enabled with 73 dB SFDR in all acquisition bandwidths, even up to 110 MHz (Opt. 110). Acquisitions of any length can stored in MATLAB™ Level 5 format for offline analysis.
Most spectrum analyzers in the market use narrowband tunable band pass filters, often YIG tuned filters (YTF) to serve as a preselector. These filters provide image rejection and improve spurious performance in swept applications by limiting the number of signals present at the first mixing stage. YTF's are narrow band devices by nature and are usually limited to bandwidths less than 50 MHz. These analyzers bypass the input filter when performing wideband analysis, leaving them susceptible to image responses when operating in modes where wideband analysis is required such as for real time signal analysis.
Unlike spectrum analyzers with YTF's, Tektronix Real Time Signal Analyzers use a wideband image-free architecture guaranteeing that signals at frequencies outside the band to which the instrument is tuned do not create spurious or image responses. This image-free response is achieved with a series of input filters designed such that all image responses are suppressed. The input filters are overlapped by greater than the widest acquisition bandwidth, ensuring that full-bandwidth acquisitions are always available. This series of filters serves the purpose of the preselector used by other spectrum analyzers, but has the benefit of always being on while still providing the image-free response in all instrument bandwidth settings and at all frequencies.
Analyze
The RSA6000 Series offers analysis capabilities that advance productivity for engineers working on components or in RF system design, integration, and performance verification, or operations engineers working in networks, or spectrum management. In addition to spectrum analysis, spectrograms display both frequency and amplitude changes over time. Time-correlated measurements can be made across the frequency, phase, amplitude, and modulation domains. This is ideal for signal analysis that includes frequency hopping, pulse characteristics, modulation switching, settling time, bandwidth changes, and intermittent signals.
Performance you can count on
Depend on Tektronix to provide you with performance you can count on. In addition to industry-leading service and support, this product comes backed by a one-year warranty as standard.
Measurement functions
The measurement capabilities of the RSA6000 series and available options and software packages are summarized below:
| Measurements | Description |
|---|---|
| Spectrum analyzer measurements | Channel power, adjacent channel power, multicarrier adjacent channel Power/Leakage ratio, occupied bandwidth, xdB bandwidth, dBm/Hz marker, dBc/Hz marker, spectrum emissions mask |
| Time domain and statistical measurements | RF IQ vs. Time, Power vs. Time, Frequency vs. Time, Phase vs. Time, CCDF, Peak-to-Average Ratio |
| Spur search measurement | Up to 20 frequency ranges, user-selected detectors (Peak, Average, QP), filters (RBW, CISPR, MIL), and VBW in each range. Linear or Log frequency scale. Measurements and violations in absolute power or relative to a carrier. Up to 999 violations identified in tabular form for export in .CSV format |
| Analog modulation measurements | % amplitude modulation (+Peak, –Peak, RMS, mod. depth) Frequency modulation (±Peak, +Peak to –Peak, RMS, Peak-Peak/2, frequency error) Phase modulation (±Peak, RMS, +Peak to –Peak) |
| AM/FM/PM modulation and audio measurements (Opt. 10) | Carrier power, frequency error, modulation frequency, modulation parameters (±Peak, Peak-Peak/2, RMS), SINAD, modulation distortion, S/N, THD, TNHD |
| Phase noise and jitter measurements (Opt. 11) | Phase Noise vs. Frequency Offset Offset range 10 hz to 1 GHz. Measures carrier power, frequency error, RMS phase noise, integrated jitter, residual FM |
| Settling time (frequency and phase) (Opt. 12) | Measured frequency, settling time from last settled frequency, settling time from last settled phase, settling time from trigger. Automatic or manual reference frequency selection. User-adjustable measurement bandwidth, averaging, and smoothing. Pass/Fail mask testing with 3 user-settable zones |
| Noise Figure and Gain measurements (Opt. 14) | Measurement displays of noise figure, gain, Y-factor, noise temperature, and tabular results. Single-frequency metering and swept-trace results are available. Support for industry standard noise sources. Measures amplifiers and other non-frequency converting devices plus fixed local-oscillator up and down converters. Performs mask testing to user-defined limits. Built in uncertainty calculator. |
| Advanced pulse measurements suite (Opt. 20) | Pulse-Ogram™ waterfall display of multiple segmented captures, with amplitude vs time and spectrum of each pulse. Pulse frequency, Delta Frequency, Average on power, Peak power, Average transmitted power, Pulse width, Rise time, Fall time, Repetition interval (seconds), Repetition interval (Hz), Duty factor (%), Duty factor (ratio), Ripple (dB), Ripple (%),Droop (dB), Droop (%), Overshoot (dB), Overshoot (%), Pulse- Ref Pulse frequency difference, Pulse- Ref Pulse phase difference, Pulse- Pulse frequency difference, Pulse- Pulse phase difference, RMS frequency error, Max frequency error, RMS phase error, Max phase error, Frequency deviation, Phase deviation, Impulse response (dB), Impulse response (time), Time stamp. |
| General purpose digital modulation analysis (Opt. 21) | Error vector magnitude (EVM) (RMS, peak, EVM vs. time), modulation error ratio (MER), magnitude error (RMS, peak, mag error vs. time), phase error (RMS, peak, phase error vs. time), origin offset, frequency error, gain imbalance, quadrature error, Rho, constellation, symbol table |
| DPX Density Measurement | Measures % signal density at any location on the DPX spectrum display and triggers on specified signal density |
| RSAVu analysis software | W-CDMA, HSUPA. HSDPA, GSM/EDGE, CDMA2000 1x, CDMA2000 1xEV-DO, RFID, Phase Noise, Jitter, IEEE 802.11 a/b/g/n WLAN, IEEE 802.15.4 OQPSK (Zigbee), audio analysis |
| Mapping and signal strength (Opt. MAP) | Both manual and automatic drive test are supported by built-in mapping software. Commercial off-the-shelf 3rd party GPS receiver supported via USB or Bluetooth connection. Supports MapInfo format and scanned version maps. Also supports exporting to popular Google Earth and MapInfo map format for post analysis. Signal strength measurement provides both a visual indicator and audible tone of signal strength. |
| Flexible OFDM Analysis (Opt. 22) | OFDM Analysis for WLAN 802.11a/g/j/p and WiMAX 802.16-2004 |
| WLAN 802.11a/b/g/j/p measurement application (Opt. 23) | All of the RF transmitter measurements as defined in the IEEE standard, as well as a wide range of additional measurements including Carrier Frequency error, Symbol Timing error, Average/peak burst power, IQ Origin Offset, RMS/Peak EVM, and analysis displays, such as EVM and Phase/Magnitude Error vs. time/frequency or vs. symbols/ subcarriers, as well as packet header decoded information and symbol table. |
| WLAN 802.11n measurement application (Opt. 24) | |
| WLAN 802.11ac measurement application (Opt. 25) | |
| APCO P25 compliance testing and analysis application (Opt. 26) | Complete set of push-button TIA-102 standard based transmitter measurements with pass/fail results including ACPR, transmitter power and encoder attack times, transmitter throughput delay, frequency deviation, modulation fidelity behavior, as well as HCPM transmitter logical channel peak ACPR, off slot power, power envelope and time alignment. |
| Bluetooth Basic LE TX SIG measurements (Opt. 27) | Presets for transmitter measurements defined by Bluetooth SIG for Basic Rate and Bluetooth Low Energy. Results also include Pass/Fail information. Application also provides packet header field decoding and can automatically detect the standard, including Enhanced Data Rate. |
| LTE Downlink RF measurements (Opt. 28) | Presets for Cell ID, ACLR, SEM, Channel Power and TDD Toff Power. Supports TDD and FDD frame format and all base stations defined by 3GPPTS version 12.5. Results include Pass/Fail information. Real-Time settings make the ACLR and the SEM measurements fast, if the connected instrument has required bandwidth. |
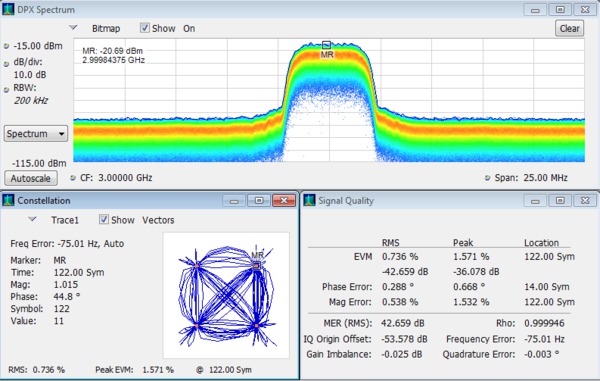
Multi-domain views provide a new level of insight into design or operational problems not possible with conventional analysis solutions. Here vector modulation quality and constellation (Opt. 21) are combined with the continuous monitoring of the DPX® spectrum display.

Spurious Search - Up to 20 noncontiguous frequency regions can be defined, each with their own resolution bandwidth, video bandwidth, detector (peak, average, quasi-peak), and limit ranges. Test results can be exported in .CSV format to external programs, with up to 999 violations reported. Spectrum results are available in linear or log scale.
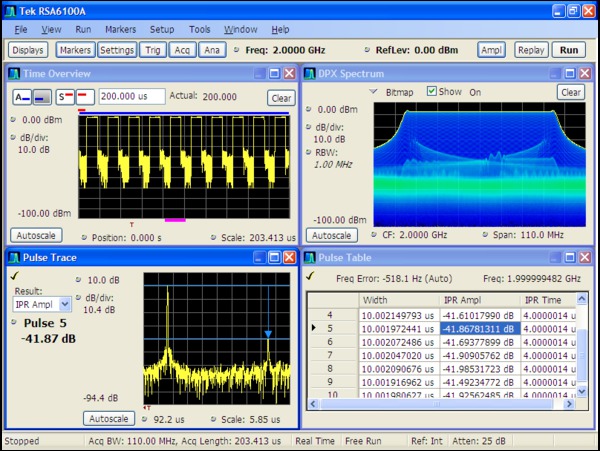
Advanced Signal Analysis package (Opt. 20) offers over 20 automated pulse parameter calculations on every pulse. Easily validate designs with measurements of peak power, pulse width rise time, ripple, droop, overshoot, and pulse-to-pulse phase. Gain insight into linear FM chirp quality with measurements such as Impulse Response and Phase Error. A pulse train (upper left) is seen with automatic calculation of pulse width and impulse response (lower right). A detailed view of the Impulse Response is seen in the lower left, and a DPX®display monitors the spectrum on the upper right.
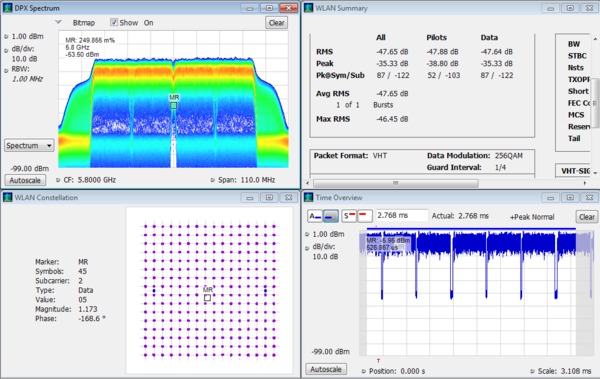
Analysis options for 802.11 standards are available. Here, an 802.11ac 80 MHz signal is analyzed, with displays of constellation, amplitude vs. time, summary of WLAN measurements, and the DPX spectrum of the analyzed signal. The density of the 'shoulders' of the WLAN signal are clearly seen in the DPX display, and a marker was placed on the suppressed center carrier of the signal. An EVM of -47.65 dB and other signal measurements are seen in the summary panel.
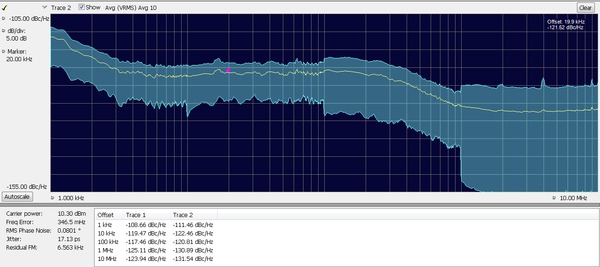
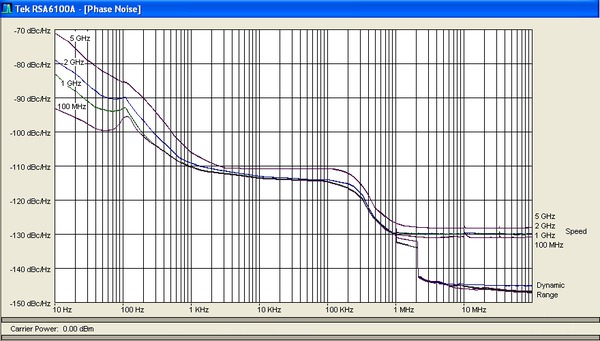
Phase noise and jitter measurements (Opt. 11) adds value to your RSA6000 Series by replacing a conventional phase noise tester for many applications. Phase noise can be measured at carrier offsets up to 1 GHz, and internal phase noise is automatically reduced by optimizing acquisition bandwidths and attenuator settings at each carrier offset for maximum dynamic range. For less critical measurements, speed optimization may be applied for faster results. Typical residual phase noise of -130 dBc/Hz at 1 MHz offset, 18 GHz carrier frequency gives sufficient measurement margin for many applications.
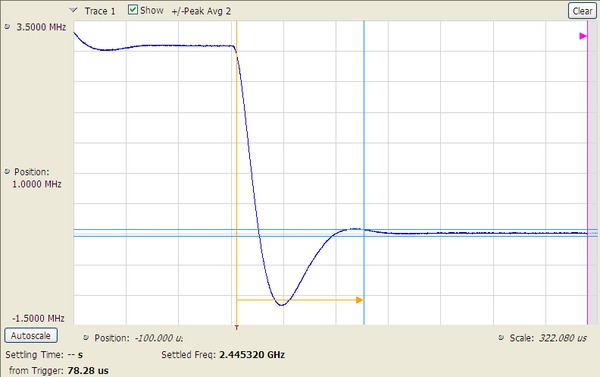
Settling time measurements (Opt. 12) are easy and automated. The user can select measurement bandwidth, tolerance bands, reference frequency (auto or manual), and establish up to 3 tolerance bands vs. time for Pass/Fail testing. Settling time may be referenced to external or internal trigger, and from the last settled frequency or phase. In the illustration, frequency settling time for a hopped oscillator is measured from an external trigger point from the device under test.
Swept DPX combines the revolutionary DPX Density™ Trigger with the ability to trigger on runt pulses and apply time qualification to any trigger. The runt trigger seen here can be used to track down nonconforming pulses in a pulse train, greatly reducing time to insight. Time qualification can be used to separate ranging pulses from higher resolution pulses in a radar signal, or trigger only on signals that remain on longer than a specified time.
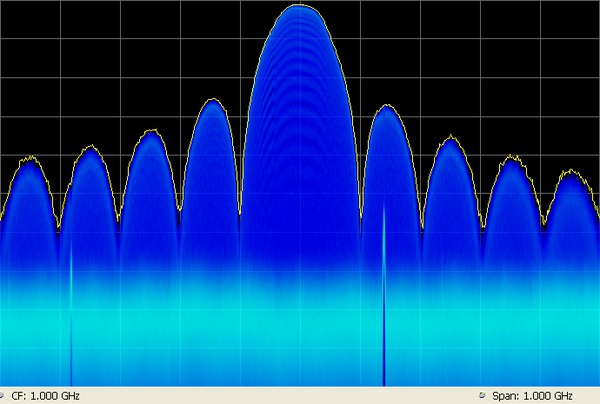
Swept DPX re-invents the way swept spectrum analysis is done, and is included in the base instrument. The DPX engine collects hundreds of thousands of spectrums per second over a 110 MHz bandwidth. Users can now sweep the DPX across the full input range of the RSA6000 Series, up to 20 GHz. Here, we see a DPX sweep of 1 GHz span, revealing two narrow-band spurious under the level of the main pulse signal. In the time a traditional spectrum analyzer has captured one spectrum, the RSA6000 Series has captured orders of magnitude more spectrums. This new level of performance reduces the chance of missing time-interleaved and transient signals during broadband searches.
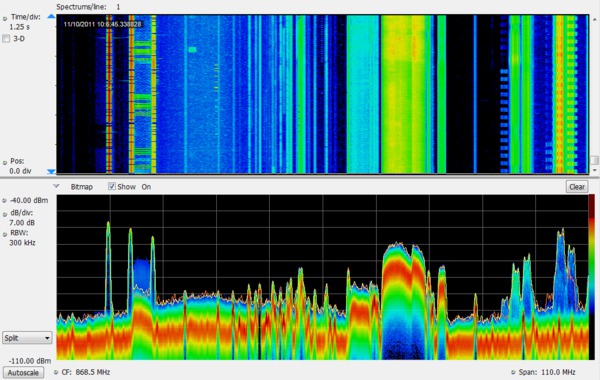
DPX Spectrograms provide gap-free spectral monitoring for up to days at a time. 60,000 traces can be recorded and reviewed, with resolution per line adjustable from 110 μs to 6400 s.
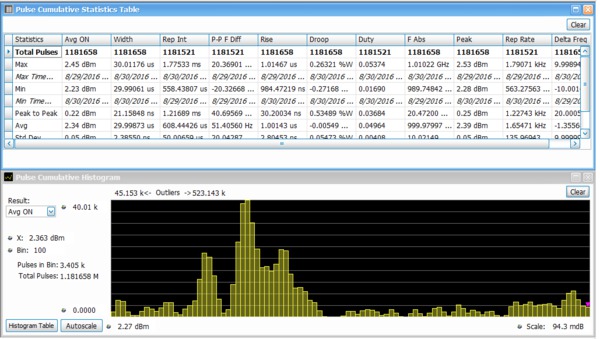
Cumulative statistics provides timestamps for Min, Max values as well as Peak to Peak, Average and Standard deviation over multiple acquisitions, further extending the analysis. Histogram shows you outliers on the right and left.
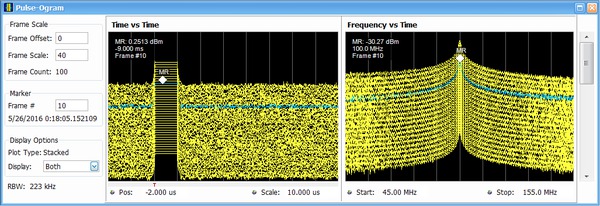
Pulse-Ogram displays a waterfall of multiple segmented captures, with correlated amplitude vs time and spectrum of each pulse. Can be used with an external trigger to show target range and speed.
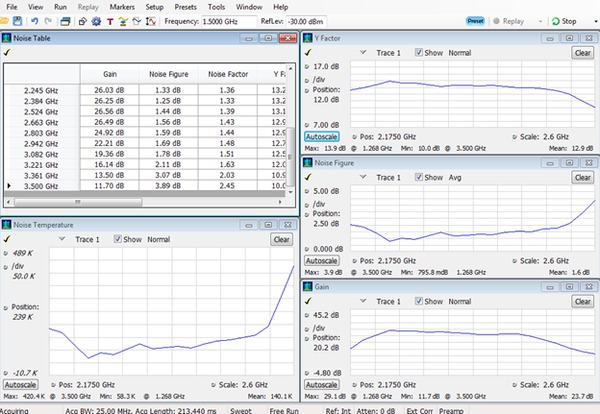
Noise Figure and Gain measurements (Option 14) help you to quickly and easily measure your device using the RTSA and a noise source. This image shows the measurement summary table with graphs of noise temperature, gain, noise figure and Y-factor.
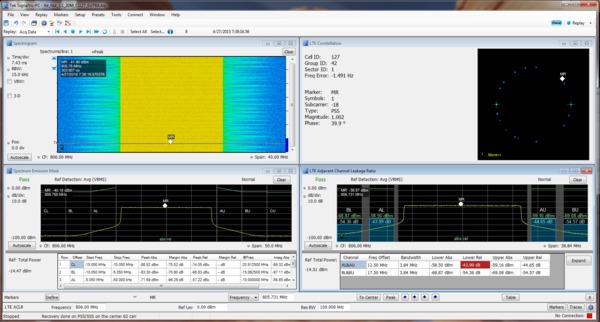
Fast validation of LTE base station transmitter with push button preset, and pass/fail information
Specifications
All specifications are guaranteed unless noted otherwise. All specifications apply to all models unless noted otherwise.
Model overview
For optional displays and measurements, see the individual options sections
-
- DPX®-based measurements on real-time data
-
DPX Spectrum display (live RF color-graded spectrum)
DPX Spectrogram (Live spectrograms)
DPX amplitude vs. time
DPX frequency vs. time
DPX phase vs. time
- Displays and Measurements from acquisition data
-
Spectrum (amplitude vs linear or log frequency)
Spectrogram (amplitude vs. frequency over time of acquisition data)
Spurious (amplitude vs linear or log frequency)
Amplitude vs. time
Frequency vs. time
Phase vs. time
Amplitude modulation vs. time
Frequency modulation vs. time
Phase modulation vs. time
RF IQ vs. time
Time overview
CCDF
Peak-to-Average ratio
- Frequency offset measurement
- Signal analysis can be performed either at center frequency or the assigned measurement frequency up to the limits of the instrument's acquisition and measurement bandwidths
- Acquisition replay
- Replay entire contents of acquisition memory or subset of acquisitions and frames. history can collect up to 64,000 acquisitions (each containing one or more frames) or 1 GB of sample data, including DPX spectrogram data, whichever limit is reached first
Frequency characteristics
- Center frequency setting resolution
- 0.1 Hz
- Frequency marker readout accuracy
-
±(RE × MF + 0.001 × Span + 2) Hz
(RE = Reference frequency error)
(MF = Marker frequency (Hz))
- Span accuracy
- ±0.3% (auto mode)
- Reference frequency
-
- Initial accuracy at cal
- 1 × 10 -7 (after 10 minute warm-up)
- Aging per day
- 1 × 10 -9 (after 30 days of operation)
- Aging per year
- 5 × 10 -8 (first year of operation)
- Aging per 10 years
- 3 × 10 -7 (after 10 years of operation)
- Temperature drift
- 2 × 10 -8 (0 to 50 °C)
- Cumulative error (temperature + aging)
- 4 × 10 -7 (within 10 years after calibration, typical)
- Reference output level
- >0 dBm (internal reference selected)
- Reference output level (loopthrough)
- 0 dB nominal gain from Ext Ref In to Ref Output, +15 dBm max output
- External reference input frequencies
- 1 to 25 MHz (1 MHz steps) + 1.2288 MHz, 4.8 MHz, 19.6608 MHz, 31.07 MHz
- External reference input requirements
-
- Frequency accuracy
- Within ±3 × 10 -7 of a valid listed input frequency
- Spurious
- < -80 dBc within 100 kHz offset to avoid on-screen spurious
- Input level range
- -10 dBm to +6 dBm
Trigger related characteristics
- Trigger event source
- RF input, Trigger 1 (front panel), Trigger 2 (rear panel), Gated, Line
- Trigger setting
- Trigger position settable from 1 to 99% of total acquisition length
- Trigger combinatorial logic
- Trigger 1 AND trigger 2 / gate may be defined as a trigger event
- Trigger actions
- Save acquisition and/or save picture on trigger
Power level trigger
- Level range
- 0 dB to –100 dB from reference level
- Accuracy
- For trigger levels >30 dB above noise floor, 10% to 90% of signal level
- Level ≥ –50 dB from reference level
- ±0.5 dB
- From < –50 dB to –70 dB from reference level
- ±1.5 dB
- Trigger bandwidth range
- At maximum acquisition BW
- Standard
- 4 kHz to 20 MHz + wide open
- Opt. 110
- 11 kHz to 60 MHz + wide open
- Trigger position timing uncertainty
-
- 40 MHz acquisition BW, 20 MHz BW
- Uncertainty = ±15 ns
- 110 MHz acquisition BW, 60 MHz BW (Opt 110)
- Uncertainty = ±5 ns
- Trigger re-arm time, minimum (fast frame on)
-
- 10 MHz acquisition BW
- ≤25 μs
- 40 MHz acquisition BW
- ≤10 μs
- 110 MHz acquisition BW (Opt. 110)
- ≤5 μs
Frequency mask trigger (Opt. 52)
- Mask shape
- User defined
- Mask point horizontal resolution
- <0.12% of span
- Level range
- 0 dB to –80 dB from reference level
- Level accuracy1
-
- 0 to –50 dB from reference level
- ±(Channel response + 1.0 dB)
- –50 dB to –70 dB from reference level
- ±(Channel response + 2.5 dB)
1For masks >30 dB above noise floor.
- Span range
-
100 Hz to 40 MHz
100 Hz to 110 MHz (Opt. 110)
- Minimum signal duration for 100% probability of trigger at 100% amplitude
- Events lasting less than minimum event duration specification will result in degraded frequency mask trigger accuracy.
- Opt. 110 SPAN = 110 MHz
-
FMT RBW Minimum even duration (μs) Std. Opt. 09 10 MHz 17.3 3.7 1 MHz 19.5 5.8 100 KHz 37.6 37.6 - Std. SPAN = 40 MHz
-
FMT RBW Minimum even duration (μs) Std. Opt 09 5 MHz 17.5 3.9 1 MHz 19.5 5.8 300 KHz 25.1 11.4 100 KHz 37.7 30.9
- Trigger position uncertainty
-
Acquisition bandwidth Opt. 52 (RBW = Auto) Opt. 52 plus Opt. 09 (RBW = Auto) 40 MHz ±12.6 μs ±5.8 μs 110 MHz ±9.8 μs ±3 μs
Advanced triggers
- DPX density trigger
-
- Density range
- 0 to 100% density
- Horizontal range
-
0.25 hz to 40 MHz
0.25 Hz to 110 MHz (Opt. 110)
- Runt trigger
-
- Runt definitions
- Positive, Negative
- Accuracy (for trigger levels >30 dB above noise floor, 10% to 90% of signal level)
-
±0.5 dB (level ≥ –50 dB from reference level)
±1.5 dB (from < –50 dB to –70 dB from reference level)
- Time qualified triggering
-
- Trigger types and source
- Time qualification may be applied to: Level, Frequency mask (Opt. 52), DPX density, Runt, Ext. 1, Ext. 2
- Time qualification range
-
T1: 0 to 10 seconds
T2: 0 to 10 seconds
- Time qualification definitions
-
Shorter than T1
Longer than T1
Longer than t1 AND shorter than T2
Shorter than t1 OR longer than t2
- Frequency edge trigger
-
- Range
- ±(1/2 × (Acq. BW or TDBW if active))
- Minimum event duration
-
25 ns for 40 MHz acquisition BW using no trigger RBW
50 ns for 40 MHz acquisition BW using 20 MHz trigger RBW
9.1 ns for 110 MHz Acq. BW using no RBW
16.7 ns for 110 MHz Acq. BW using 60 MHz trigger RBW
- Timing uncertainty
- Same as power trigger position timing uncertainty
- Holdoff trigger
-
- Range
- 20 ns to 10 seconds
Minimum signal duration
For 100% probability of intercept, full amplitude
- 110 MHz span
-
RBW FFT length Spectrums /sec Minimum event duration 100% POI (μs) Base unit Opt. 09 10000 1024 292,969 17.3 3.7 1000 1024 292,969 19.5 5.8 300 2048 146,484 28.5 14.8 100 4096 73,242 37.6 37.6 30 16384 18,311 134.6 134.6 20 32768 18,311 229.2 229.2
- 40 MHz span
-
RBW FFT length Spectrums /sec Minimum event duration 100% POI (μs) Base unit Opt. 09 5000 1024 292,969 17.5 3.9 1000 1024 292,969 19.4 5.8 300 1024 146,484 25 11.4 100 2048 73,242 37.6 30.8 30 4096 36,621 93.6 93.6 20 8192 18,311 147.3 147.3 10 16384 18,311 194.5 194.5
External trigger 1
- Level range
- -2.5 V to +2.5 V
- Level setting resolution
- 0.01 V
- Trigger position timing uncertainty (50 Ω input impedance)
-
- MHz acquisition BW, 40 MHz span
- Uncertainty = ±20 ns
- 110 MHz acquisition BW, 110 MHz span (Opt. 110)
- Uncertainty = ±12 ns
- Input impedance
- Selectable 50 Ω/5 kΩ impedance (nominal)
External trigger 2
- Threshold voltage
- Fixed, TTL
- Input impedance
- 10 kΩ (nominal)
- Trigger state select
- High, Low
Acquisition related
- A/D converter
- 100 MS/s 14 bit (optional 300 MS/s, 14 bit, Opt. 110)
- Minimum acquisition length
- 64 samples
- Acquisition length setting resolution
- 1 sample
- Fast frame acquisition mode1
- >Up to 1 Million records can be stored in a single acquisition (for pulse measurements and spectrogram analysis (with option 53))
1Exact number depends on Bandwidth, Sample Rate, Acquisition time. Achieved up to 200,000 pulses
- Memory depth (time) and minimum time domain resolution
-
Acquisition BW Sample rate (for I and Q) Record length Record length (Opt. 53) Time resolution 110 MHz (Opt. 110) 150 MS/s 1.79 s 7.15 s 6.6667 ns 60 MHz (Opt. 110) 75 MS/s 3.58 s 14.31 s 13.33 ns 40 MHz 50 MS/s 4.77 s 19.08 s 20 ns 20 MHz 25 MS/s 9.54 s 38.17 s 40 ns 10 MHz 12.5 MS/s 19.08 s 76.35 s 80 ns 5 MHz 6.25 MS/s 38.17 s 152.7 s 160 ns 2 MHz 1 3.125 MS/s 42.9 s 171.8 s 320 ns 1 MHz 1.56 MS/s 85.8 s 343.5 s 640 ns 500 kHz 781 kS/s 171.7 s 687.1 s 1.28 μs 200 kHz 390 kS/s 343.5 s 1374 s 2.56 μs 100 kHz 195 kS/s 687.1 s 2748 s 5.12 μs 50 kHz 97.6 kS/s 1374 s 5497 s 10.24 μs 20 kHz 48.8 kS/s 2748 s 10955 s 20.48 μs 10 kHz 24.4 kS/s 5497 s 21990 s 40.96 μs 5 kHz 12.2 kS/s 10955 s 43980 s 81.92 μs 2 kHz 3.05 kS/s 43980 s 175921 s 328 μs 1 kHz 1.52 kS/s 87960 s 351843 s 655 μs 500 Hz 762 S/s 175921 s 703687 s 1.31 ms 200 Hz 381 S/s 351843 s 1407374 s 2.62 ms 100 Hz 190 S/s 703686 s 2814749 s 5.24 ms
1In spans ≤2 MHz, higher resolution data is stored, reducing maximum acquisition time.
Bandwidth related
- Resolution bandwidth
-
- Resolution bandwidth range (spectrum analysis)
-
0.1 Hz to 8 MHz
0.1 Hz to 10 MHz (Opt. 110)
- Resolution bandwidth shape
- Approximately Gaussian, Shape factor 4.1:1 (60:3 dB) ±10%, typical
- Resolution bandwidth accuracy
- ±1% (auto-coupled RBW mode)
- Alternative resolution bandwidth types
- Kaiser window (RBW), –6 dB mil, CISPR, Blackman-Harris 4B window, Uniform (none) window, Flat-top (CW ampl.) window, Hanning window
- Video bandwidth
-
- Video bandwidth range
- 1 Hz to 10 MHz plus wide open
- RBW/VBW maximum
- 10,000:1
- RBW/VBW minimum
- 1:1 plus wide open
- Resolution
- 5% of entered value
- Accuracy (typical)
- ±10%
- Time domain bandwidth (amplitude vs. time display)
-
- Time domain bandwidth range
- At least 1/10 to 1/10,000 of acquisition bandwidth, 1 Hz minimum
- Time domain bandwidth shape
-
≤10 MHz, Approximately Gaussian, Shape factor 4.1:1 (60:3 dB), typical
20 MHz (60 MHz, Opt. 110), Shape factor< 2.5:1 (60:3 dB) typical
- Time domain bandwidth accuracy
-
1 Hz to 10 MHz = 1% (auto-coupled)
20 MHz and 60 MHz = 10%
- Minimum settable spectrum analysis RBW vs. span
-
Frequency span RBW >10 MHz 100 Hz >1 MHz to 10 MHz 10 Hz >5 kHz to 1 MHz 1 Hz ≤5 kHz 0.1 Hz
- Spectrum display traces, detector, and functions
-
Characteristic Description Traces Three traces + 1 math waveform + 1 trace from spectrogram for spectrum display Detector Peak, –Peak, Average, ±Peak, Sample, CISPR (Avg, Peak, Quasi-peak, Average of logs) Trace functions Normal, Average, Max hold, Min hold, Average of logs Spectrum trace length 801, 2401, 4001, 8001, or 10401 points
- Minimum FFT length vs. Trace length (independent of span and RBW)
-
Trace length (points) Minimum FFT length 801 1024 2401 4096 4001 8192 10401 16384
- Resolution BW range vs. span (DPX®)
-
Acquisition bandwidth RBW (min) RBW (max) 110 MHz 20 kHz 10 MHz 55 MHz 10 kHz 5 MHz 40 MHz 10 kHz 3 MHz 20 MHz 5 kHz 2 MHz 10 MHz 2 kHz 1 MHz 5 MHz 1 kHz 500 kHz 2 MHz 500 Hz 200 kHz 1 MHz 200 Hz 100 kHz 500 kHz 100 Hz 50 kHz 200 kHz 50 Hz 20 kHz 100 kHz 20 Hz 10 kHz 50 kHz 10 Hz 5 kHz 20 kHz 5 Hz 2 kHz 10 kHz 2 Hz 1 kHz 5 kHz 0.1 Hz 500 Hz 2 kHz 0.1 Hz 200 Hz 1 kHz 0.1 Hz 100 Hz 500 Hz 0.1 Hz 50 Hz 200 Hz 0.1 Hz 20 Hz 100 Hz 0.1 Hz 10 Hz
- Minimum RBW, swept spans
- 10 kHz
DPX® related
- DPX® digital phosphor spectrum processing
-
- Spectrum processing rate (RBW = auto, trace length 801)
- 292,968/s
- DPX bitmap resolution
- 201 × 801
- DPX bitmap color dynamic range
- 8G (99 dB)
- Marker information
- Amplitude, frequency, and signal density on the DPX display
- Minimum signal duration for 100% probability of detection (Max-hold on)
- See table: Minimum signal duration for 100% probability of intercept, full amplitude
- Span range (continuous processing)
-
100 Hz to 40 MHz
(110 MHz with opt. 110)
- Span range (swept)
- Up to instrument frequency range
- Dwell time per step
- 50 ms to 100 s
- Trace processing
- Color-graded bitmap, +Peak, –Peak, Average
- Trace length
- 801, 2401, 4001, 10401
- Resolution BW accuracy
- 7%
- DPX® zero-span amplitude, frequency, phase performance (Nominal)
-
- Measurement bandwidth range
- 100 Hz to maximum acquisition bandwidth of instrument
- Time domain bandwidth (TDBW) range
- At least 1/10 to 1/10,000 of acquisition bandwidth, 1 Hz minimum
- Time domain bandwidth (TDBW) accuracy
- ±1%
- Sweep time range
-
100 ns (minimum)
1 s (maximum, measurement BW >60 MHz)
2000 s (maximum, measurement BW ≤60 MHz)
- Time accuracy
- ±(0.5 % + reference frequency accuracy)
- Zero-span trigger timing uncertainty (power trigger)
- +/-(Zero-span sweep time / 400) at trigger point, for S/N ratio ≥40 dB
- DPX frequency display range
- ±100 MHz maximum
- DPX phase display range
-
±200 degrees maximum, phase-wrapped
±500G degrees, phase-unwrapped
- DPX® spectrogram performance
-
- Span range
- 100 Hz to maximum acquisition bandwidth
- DPX spectrogram trace detection
- +Peak, –Peak, avg (VRMS)
- DPX spectrogram trace length
- 801 to 4001
- DPX spectrogram memory depth
-
Trace length = 801: 60,000 traces
Trace length = 2401: 20,000 traces
Trace length = 4001: 12,000 traces
- Time resolution per line
- 110 µs to 6400 s, user settable
- Maximum recording time vs. line resolution
- 6.6 seconds (801 points/trace, 110 μs/line) to 4444 days (801 points/trace, 6400 s/line)
Stability
- Residual FM
- <2 Hzp-p in 1 second (95% confidence, typical)
Phase noise sidebands
- dBc/Hz at specified center frequency
- CF = 1 GHz
-
Offset Specification Typical 100 Hz –86 –86 1 kHz –100 –106 10 kHz –106 –110 100 kHz –107 –113 1 MHz –128 –134 6 MHz –134 –142 10 MHz –134 –142 - CF = 2 GHz
-
Offset Specification Typical 100 Hz --- – 80 1 kHz --- –106 10 kHz --- –110 100 kHz --- –111 1 MHz --- –133 6 MHz --- –142 10 MHz --- –142 - CF = 6 GHz
-
Offset Specification Typical 100 Hz --- – 70 1 kHz --- –96 10 kHz --- –107 100 kHz --- –107 1 MHz --- –132 6 MHz --- –142 10 MHz --- –142 - CF = 10 GHz (RSA6114B)
-
Offset Specification Typical 100 Hz --- – 64 1 kHz --- –91 10 kHz --- –106 100 kHz --- –106 1 MHz --- –132 6 MHz --- –142 10 MHz --- –142 - CF = 10 GHz (RSA6120B)
-
Offset Specification Typical 100 Hz --- – 77 1 kHz --- –95 10 kHz --- –111 100 kHz --- –112 1 MHz --- –130 6 MHz --- –142 10 MHz --- –142 - CF = 18 GHz (RSA6120B)
-
Offset Specification Typical 100 Hz --- – 70 1 kHz --- –93 10 kHz --- –108 100 kHz --- –111 1 MHz --- –130 6 MHz --- –142 10 MHz --- –142 - Typical phase noise performance as measured by Opt. 11.

Amplitude
- Measurement range
- Displayed average noise level to maximum measurable input
- Input attenuator range
- 0 dB to 55 dB, 5 dB step
- Maximum safe input level
-
- Average continuous (RF ATT ≥10 dB, preamp off)
- +30 dBm
- Average continuous (RF ATT ≥10 dB, preamp on)
-
Option 50 preamp on: +20 dBm
Option 51 preamp on: +30 dBm
- Maximum measurable input level
-
- Average continuous
- +30 dBm (RF ATT: Auto)
- Pulsed RF
- 10 W (RF Input, RF ATT: Auto, PW <10 μs, 1% duty cycle repetitive pulses)
- Max DC voltage
- ±40 V
- Log display range
- 0.01 dBm/div to 20 dB/div
- Display divisions
- 10 divisions
- Display units
- dBm, dBmV, Watts, Volts, Amps, dBuW, dBuV, dBuA, dBW, dBV, dBV/m, and dBA/m
- Marker readout resolution, dB units
- 0.01 dB
- Marker readout resolution, Volts units
- Reference-level dependent, as small as 0.001 μV
- Reference level setting range
- 0.1 dB step, –170 dBm to +50 dBm (minimum ref. level –50 dBm at center frequency <80 MHz)
- Level linearity
- ±0.1 dB (0 to –70 dB from reference level)
Frequency response
-
- 18 °C to 28 °C, atten. = 10 dB, preamp off
-
Range Response 10 MHz - 3 GHz ±0.5 dB >3 GHz - 6.2 GHz ±0.8 dB >6.2 GHz - 14 GHz (RSA6114B) ±1.0 dB >6.2 GHz - 20 GHz (RSA6120B) ±1.0 dB - 5 °C to 50 °C, all attenuator settings (Typical)
-
Range Response 9 kHz - 3 GHz ±0.7 dB >3 GHz - 6.2 GHz ±0.8 dB >6.2 GHz - 14 GHz (RSA6114B) ±2.0 dB >6.2 GHz - 20 GHz (RSA6120B) ±2.0 dB - RSA6106B Preamp (Opt. 50) On (Atten. = 10 dB)
-
Range Response 1 MHz - 6.2 GHz ±2.0 dB - RSA6114B and RSA6120B Preamp (Opt. 51) On (Atten. = 10 dB)
-
Range Response 100 kHz - 8 GHz ±1.5 dB 8 GHz - 14 GHz ±3 dB 14 GHz - 20 GHz (RSA6120B only) ±3 dB
Amplitude accuracy
Specifications excluding mismatch error.
- Absolute amplitude accuracy at calibration point
- ±0.31 dB (100 MHz, –10 dBm signal, 10 dB ATT, 18 °C to 28 °C)
- Input attenuator switching uncertainty
- ±0.2 dB
- Absolute amplitude accuracy at center frequency, 95% confidence1
-
- 10 MHz to 3 GHz
- ±0.5 dB
- 3 GHz to 6.2 GHz
- ±0.8 dB
- 6.2 GHz to 20 GHz
- ±1.5 dB
118 °C to 28 °C, Ref Level ≤ -15 dBm, Attenuator Auto-coupled, Signal Level -15 dBm to -50 dBm. 10 Hz ≤ RBW ≤ 1 MHz, after alignment performed.
- VSWR
- Atten. = 10 dB, preamp off, CF set within 200 MHz of VSWR test frequency
- 10 MHz to 4 GHz
- <1.5:1
- 4 GHz to 6.2 GHz
- <1.6:1
- 6.2 GHz to 14 GHz (RSA6114B only)
- <1.9:1
- 6.2 GHz to 20 GHz (RSA6120B only)
- <1.9:1
- VSWR with preamp
- Atten. = 10 dB, preamp on, CF set within 200 MHz of VSWR test frequency
- 10 MHz to 6.2 GHz (RSA6106B only)
- <1.5:1
- 10 MHz to 4 GHz
- <1.5:1
- 4 GHz to 6.2 GHz
- <1.6:1
- 6.2 GHz to 14 GHz (RSA6114B only)
- <1.9:1
- 6.2 GHz to 20 GHz (RSA6120B only)
- <1.9:1
Noise and distortion characteristics
- 3rd order intermodulation distortion, typical12
-
- RSA6106B, RSA6114B
-
Frequency 3rd order intermodulation distortion, dBc 3rd order intercept, dBm 9 kHz to 100 MHz -77 13.5 100 MHz to 3 GHz -80 15 3 GHz to 6.2 GHz -84 17 6.2 GHz to 14 GHz -84 17 - RSA6120B
-
9 kHz to 100 MHz -79 14.5 100 MHz to 3 GHz -90 20 3 GHz to 6.2 GHz -88 19 6.2 GHz to 20 GHz -88 19
1Each Signal Level -25 dBm, Ref Level -20 dBm, Attenuator = 0 dB, 1 MHz tone separation.
23rdorder intercept point is calculated from 3rdorder intermodulation performance.
- 2nd harmonic distortion
-
Frequency 2nd Harmonic Distortion, Typical 10 MHz to 3.1 GHz 1 < –80 dBc >3.1 GHz to 7 GHz (RSA6114B) 1 < –80 dBc >3.1 GHz to 10 GHz 2 (RSA6120B) < –80 dBc
1-40 dBm at RF input, Attenuator = 0, Preamp Off, typical.
2< -80 dBc, -25 dBm at RF input, Atten = 0, Preamp OFF, Maximize Dynamic Range "RF & IF Optimization" mode.
- Displayed average noise level, Preamp off1
-
- General
-
Frequency Specification Typical 9 kHz to 10 MHz -99 dBm/Hz -102 dBm/Hz >10 MHz to 100 MHz -149 dBm/Hz -151 dBm/Hz >100 MHz to 2.3 GHz -151 dBm/Hz -153 dBm/Hz >2.3 GHz to 4 GHz -149 dBm/Hz -151 dBm/Hz >4 GHz to 6.2 GHz -145 dBm/Hz -147 dBm/Hz - RSA6114B only
-
Frequency Specification Typical 6.2 GHz to 7 GHz -145 dBm/Hz -147 dBm/Hz 7 GHz to 10 GHz -137 dBm/Hz -139 dBm/Hz 10 GHz to 14 GHz -135 dBm/Hz -139 dBm/Hz - RSA6120B Only
-
Frequency Specification Typical >6.2 GHz to 8.2 GHz -145 dBm/Hz -147 dBm/Hz >8.2 GHz to 15 GHz -149 dBm/Hz -152 dBm/Hz >15 GHz to 17.5 GHz -145 dBm/Hz -147 dBm/Hz >17.5 GHz to 20 GHz -143 dBm/Hz -145 dBm/Hz
1Measured using 1 kHz RBW, 100 kHz span, 100 averages, Best Noise mode, input terminated, Average of Logs detection.
- Preamplifier performance RSA6106B (Opt. 50)
-
- Frequency range
- 1 MHz to 6.2 GHz
- Noise figure at 6.2 GHz
- <6 dB at 10 GHz
- Gain
- 20 dB at 2 GHz
- ESD protection level
- 1 kV (human body model)
- Preamplifier performance RSA6114B and RSA6120B (Opt. 51)
-
- Frequency range
-
100 kHz to 14 GHz (RSA6114B)
100 kHz to 20 GHz (RSA6120B)
- Noise figure at 10 GHZ
- <6 dB at 10 GHz
- Gain
- 30 dB at 10 GHz
- ESD protection level
- 500 V (Human Body Model)
- Displayed average noise level,1 preamp on (RSA6106B, Opt.50
-
Frequency Specification Typical 1 MHz to 10 MHz –159 dBm/Hz –162 dBm/Hz 10 MHz to 1 GHz –165 dBm/Hz –168 dBm/Hz 1 GHz to 4 GHz –164 dBm/Hz –167 dBm/Hz 4 GHz to 6.2 GHz –163 dBm/Hz –166 dBm/Hz
1Measured using 1 kHz RBW, 100 kHz span, 100 averages, Best Noise mode, input terminated, Average of Log detection.
- Displayed average noise level,1 preamp on (RSA6114B and RSA6120B, Opt. 51)
-
Frequency Specification Typical 100 kHz to 2 MHz –122 dBm/Hz –133 dBm/Hz 2 MHz to 5 MHz –140 dBm/Hz –151 dBm/Hz 5 MHz to 15 MHz –145 dBm/Hz –155 dBm/Hz 15 MHz 50 MHz –152 dBm/Hz –160 dBm/Hz 50 MHz to 150 MHz –160 dBm/Hz –166 dBm/Hz 150 MHz to 4 GHz –164 dBm/Hz –168 dBm/Hz 4 GHz to 14 GHz –162 dBm/Hz –166 dBm/Hz 14 GHz to 17.5 GHz –160 dBm/Hz –165 dBm/Hz 17.5 GHz to 20 GHz –159 dBm/Hz –163 dBm/Hz
1Measured using 1 kHz RBW, 100 kHz span, 100 averages, Best Noise mode, input terminated, Average of Logs detection.
- Residual response1
-
- 40 MHz to 200 MHz
- -90 dBm
- >200 MHz to 6.2 GHz (RSA6106B)
- -95 dBm -110 dBm (typical)
- >200 MHz to 14 GHz (RSA6114B)
- -95 dBm (typical)
- >200 MHz to 20 GHz (RSA6120B)
- -95 dBm -110 dBm (typical)
1Input terminated, RBW = 1 kHz, Attenuator = 0 dB.
- Image response1
-
- 9 kHz to 6.2 GHz
- < -80 dBc
- 6.2 GHz to 8 GHz (RSA6114B/RSA6120B)
- < -80 dBc
- >8 GHz to 14 GHz (RSA6114B)
- < -76 dBc
- >6.2 GHz to 20 GHz (RSA6120B)
- < -76 dBc
1Ref = -30 dBm, Attenuator = 10 dB, RF Input Level = -30 dBm, RBW = 10 Hz.
-
- Spurious response with signal1
-
Frequency Span ≤ 40 MHz Opt. 110 Swept spans >40 MHz 40 MHz < span ≤ 110 MHz Specification Typical Specification Typical 30 MHz to 6.2 GHz -73 dBc -78 dBc -73 dBc -75 dBc ≥6.2 GHz to 14 GHz (RSA6114B) -70 dBc -75 dBc -70 dBc -75 dBc >6.2 GHz to 20 GHz (RSA6120B) -70 dBc -75 dBc -70 dBc -75 dBc - Spurious response with signal at 4.75 GHz
-
< 62 dBc
(CF 9 kHz to 8 GHz, Ref = -30 dBm, Atten = 10 dB, RBW = 1 kHz)
Signal frequency range = 4.7225 to 4.7775 GHz, RF input level = -30 dBm
- Local oscillator feed-through to input connector
-
< -65 dBm
(typical, attenuator = 10 dB)
1RF Input Level = -15 dBm, Attenuator = 10 dB, Offset ≥400 kHz, Mode: Auto. Input signal at center frequency. Performance level for signals offset from center frequency typically the same.
- Adjacent channel leakage ratio dynamic range1
-
- 3GPP downlink, 1 DPCH
-
Measurement mode ACLR, typical Adjacent Alternate Uncorrected -70 dB -70 dB Noise corrected -79 dB -79 dB - 3GPP TM1 64 channel
-
Measurement mode ACLR, typical Adjacent Alternate Uncorrected -69 dB -69 dB Noise corrected -78 dB -78 dB
1Measured with test signal amplitude adjusted for optimum performance. (CF = 2.13 GHz)
-
- IF frequency response and phase linearity1
-
Frequency range (GHz) Acq. bandwidth Specification Amplitude/phase (typical, RMS) 0.01 to 6.2 2 ≤300 kHz ±0.10 dB 0.05 dB/0.1° 0.03 to 6.2 ≤40 MHz ±0.30 dB 0.20 dB/0.5° >6.2 to 14
(RSA6114B)≤300 kHz ±0.10 dB 0.05 dB/0.1° >6.2 to 14
(RSA6114B)≤40 MHz ±0.50 dB 0.40 dB/1.0° >6.2 to 20
(RSA6120B)≤300 kHz ±0.10 dB 0.05 dB/0.1° >6.2 to 20
(RSA6120B)≤40 MHz ±0.50 dB 0.40 dB/1.0° - Opt. 110
-
Frequency range (GHz) Acq. bandwidth Specification Amplitude/phase (typical, RMS) 0.07 to 3.0 ≤110 MHz ±0.50 dB 0.30 dB/1.0° >3 to 6.2 ≤110 MHz ±0.50 dB 0.40 dB/1.0° >6.2 to 14
(RSA6114B)≤80 MHz ±0.75 dB 0.70 dB/1.5° >6.2 to 14
(RSA6114B)≤110 MHz ±1.0 dB 0.70 dB/1.5° >6.2 to 20
(RSA6120B)≤80 mHz ±0.75 dB 0.70 dB/1.5°
0.05 dB/0.1°>6.2 to 20
(RSA6120B)≤110 MHz ±1.0 dB 0.70 dB/1.5°
1Amplitude flatness and phase deviation over the acquisition BW, includes RF frequency response. Attenuator Setting: 10 dB.
2High Dynamic Range mode selected.
Analog IF and Digital IQ output (Opt. 05)
- Analog IF
-
- Frequency
-
500 MHz
Output frequency varies±1 MHz with changes in center frequency. Sidebands may be frequency inverted from input, depending on center frequency
- Output level
- +3 to -10 dBm for peak signal level of -20 dBm at RF mixer (typical)
Characteristic Description Filter control Wide open (square top) or 60 MHz Gaussian Bandwidth (wide open) >150 MHz (typical) Bandwidth (Gaussian) 60 MHz, gaussian to –12 dB
- Digital IQ output
-
- Connector type
-
MDR (3M) 50 pin × 2
- Data output
- Data is corrected for amplitude and phase response in real time
Data format Specification I data 16 bit LVDS Q data 16 bit LVDS - Control output
- Clock: LVDS, 150 MHz - Acquisition Bandwidth >40 MHz, 50 MHz - Acquisition Bandwidth ≤40 MHz, DV (Data Valid), MSW (Most Significant Word) indicators, LVDS
- Control input
- IQ data output enabled, connecting GND enables output of IQ data
- Clock rising edge to data transition time (hold time)
- 8.4 ns (typical, standard), 1.58 ns (typical, Opt. 110)
- Data transition to clock rising edge (setup time)
- 8.2 ns (typical, standard), 1.54 ns (typical, Opt. 110)
AM/FM/PM and direct audio measurements (Opt. 10)
- Available displays
- Audio spectrum, Audio measurements summary
- Analog demodulation
-
- Carrier frequency range (for modulation and audio measurements)
- 9 kHz or (1/2 × Audio Analysis Bandwidth) to maximum input frequency. Distortion and noise performance reduced below 30 MHz
- Maximum audio frequency span
- 10 MHz
- Audio filters
-
- Low pass (kHz)
- 0.3, 3, 15, 30, 80, 300, and user-entered up to 0.9 × audio bandwidth
- High pass (Hz)
- 20, 50, 300, 400, and user-entered up to 0.9 × audio bandwidth
- Standard
- CCITT, C-Message
- De-emphasis (μs)
- 25, 50, 75, 750, and user-entered
- File
- User-supplied .TXT or .CSV file of amplitude/frequency pairs. Maximum 1000 pairs
- FM Modulation Analysis (Modulation Index >0.1)
-
- FM measurements
- Carrier Power, Carrier Frequency Error, Audio Frequency, Deviation (+Peak, -Peak, Peak-Peak/2, RMS), SINAD, Modulation Distortion, S/N, Total Harmonic Distortion, Total Non-harmonic Distortion, Hum and Noise
- Carrier power accuracy (10 MHz to 2 GHz, -20 to 0 dBm input power)
- ±0.85 dB
- Carrier frequency accuracy (deviation: 1 to 10 kHz)
- ±0.5 Hz + (transmitter frequency × reference frequency error)
- FM deviation accuracy (rate: 1 kHz to 1 MHz)
- ±(1% of (rate + deviation) + 50 Hz)
- FM rate accuracy (deviation: 1 to 100 kHz)
- ±0.2 Hz
- Residuals (FM) (rate: 1 to 10 kHz, deviation: 5 kHz)
-
- THD
- 0.10%
- Distortion
- 0.7%
- SINAD
- 43 dB
- AM modulation analysis
-
- AM measurements
-
Carrier Power, Audio Frequency, Modulation Depth (+Peak, –Peak, Peak-Peak/2, RMS), SINAD, Modulation Distortion, S/N, Total Harmonic Distortion, Total Non-harmonic Distortion, Hum and Noise
- Carrier power accuracy (10 MHz to 2 GHz, –20 to 0 dBm input power)
- ±0.85 dB
- AM depth accuracy (rate: 1 to 100 kHz, depth: 10% to 90%)
- ±0.2% + 0.01 × measured value
- AM rate accuracy (rate: 1 kHz to 1 MHz, depth: 50%)
- ±0.2 Hz
- Residuals (AM) (rate: 1 to 100 kHz, depth: 50%)
-
- THD
- 0.16%
- Distortion
- 0.13%
- SINAD
- 58 dB
- PM modulation analysis
-
- PM measurements
- Carrier Power, Carrier Frequency Error, Audio Frequency, Deviation (+Peak, -Peak, Peak-Peak/2, RMS), SINAD, Modulation Distortion, S/N, Total Harmonic Distortion, Total Non-harmonic Distortion, Hum and Noise
- Carrier power accuracy (10 MHz to 2 GHz, -20 to 0 dBm input power)
- ±0.85 dB
- Carrier frequency accuracy (deviation: 0.628 rad)
- ±0.02 Hz + (transmitter frequency × reference frequency error)
- PM deviation accuracy (rate: 10 to 20 kHz, deviation: 0.628 to 6 rad)
- ±100% × (0.005 + (rate / 1 MHz))
- PM rate accuracy (rate: 1 to 10 kHz, deviation: 0.628 rad)
- ±0.2 Hz
- Residuals (PM) (rate: 1 to 10 kHz, deviation: 0.628 rad)
-
- THD
- 0.1%
- Distortion
- 1%
- SINAD
- 40 dB
- Direct audio input
- Direct input (unmodulated) audio measurements are limited by the low-frequency input range of 9 kHz in the RSA6000 Series.
- Audio measurements
- Signal Power, Audio Frequency (+Peak, -Peak, Peak-Peak/2, RMS), SINAD, Modulation Distortion, S/N, Total Harmonic Distortion, Total Non-harmonic Distortion, Hum and Noise
- Direct input frequency range (for audio measurements only)
- 9 kHz to 10 MHz
- Maximum audio frequency span
- 10 MHz
- Audio frequency accuracy
- ±0.2 Hz
- Signal power accuracy
- ±1.5 dB
- Residuals (rate: 10 kHz, input level: 1.0 V)
-
- THD
- 0.1%
- Distortion
- 0.8%
- SINAD
- 42 dB
Phase noise and jitter measurements (Opt. 11)
- Available displays
- Phase noise vs. frequency, log-frequency scale
- Carrier frequency range
- 30 MHz to maximum instrument frequency – less selected frequency offset range
- Measurements
- Carrier power, Frequency error, RMS phase noise, Jitter (time interval error), Residual FM
- Residual Phase Noise
- See Phase noise specifications
- Phase noise and jitter integration bandwidth range
-
Minimum offset from carrier: 10 Hz
Maximum offset from carrier: 1 GHz
- Number of traces
- 2
- Trace and measurement functions
-
Detection: average or ±Peak
Smoothing Averaging
Optimization: speed or dynamic range
Settling time, frequency, and phase (Opt. 12)1
1Measured input signal level > -20 dBm, Attenuator: Auto.
- Available displays
- Frequency settling vs. time, Phase settling vs. time
- Settled frequency uncertainty, 95% confidence (typical), at stated measurement frequencies, bandwidths, and # of averages
-
- Measurement frequency: 1 GHz
-
Averages Frequency uncertainty at stated measurement bandwidth 110 MHz 10 MHz 1 MHz 100 kHz Single measurement 2 kHz 100 Hz 10 Hz 1 Hz 100 averages 200 Hz 10 Hz 1 Hz 0.1 Hz 1000 averages 50 Hz 2 Hz 1 Hz 0.05 Hz - Measurement frequency: 10 GHz
-
Averages Frequency uncertainty at stated measurement bandwidth 110 MHz 10 MHz 1 MHz 100 kHz Single measurement 5 kHz 100 Hz 10 Hz 5 Hz 100 averages 300 Hz 10 Hz 1 Hz 0.5 Hz 1000 averages 100 Hz 5 Hz 0.5 Hz 0.1 Hz - Measurement frequency: 20 GHz
-
Averages Frequency uncertainty at stated measurement bandwidth 110 MHz 10 MHz 1 MHz 100 kHz Single measurement 2 kHz 100 Hz 10 Hz 5 Hz 100 averages 200 Hz 10 Hz 1 Hz 0.5 Hz 1000 averages 100 Hz 5 Hz 0.5 Hz 0.2 Hz
- Settled phase uncertainty, 95% confidence (typical), at stated measurement frequencies, bandwidths, and # of averages
-
- Measurement frequency: 1 GHz
-
Averages Phase uncertainty at stated measurement bandwidth 110 MHz 10 MHz 1 MHz Single measurement 1.00° 0.50° 0.50° 100 averages 0.10° 0.05° 0.05° 1000 averages 0.05° 0.01° 0.01° - Measurement frequency: 10 GHz
-
Averages Phase uncertainty at stated measurement bandwidth 110 MHz 10 MHz 1 MHz Single measurement 1.5° 1.00° 0.50° 100 averages 0.20° 0.10° 0.05° 1000 averages 0.10° 0.05° 0.02° - Measurement frequency: 20 GHz
-
Averages Phase uncertainty at stated measurement bandwidth 110 MHz 10 MHz 1 MHz Single measurement 1.00° 0.50° 0.50° 100 averages 0.10° 0.05° 0.05° 1000 averages 0.05° 0.02° 0.02°
Gain and Noise Figure (Option 14)
- Measurements (tabular)
- Noise Figure, Gain, Y-Factor, Noise Temperature, P-Hot, P-Cold
- Measurements (displays)
- Noise Figure, Gain, Y-Factor, Noise Temperature, Uncertainty Calculator
- Single frequency measurements
- When Single Frequency mode is selected, each display acts as a meter and single-value readout for each selected trace in the measurement
- Measurement configurations
- Direct, Up-Converter, Down-Converter
- Frequency modes
- Single Frequency, Swept (Center+Span or Start-Stop), Frequency Table; 1 to 999 measurement points
- Noise source
- Constant ENR or tabular entry; entry fields for noise source model and type
- Noise sources supported
- NoiseCom NC346 series and similar models from other manufacturers
- Noise source control
- +28 V switched output, rear panel
- External gain/loss tables
- 3 tables or constants available for gain or loss
- Measurement control settings
- Source settling time, reference temperature, RBW(50 Hz to 10 MHz), Average count(1 to 100)
- Instrument input control settings
- Attenuator value, Preamp On/Off
- Trace controls
- 3 traces per display: Ave(VRMS), Max-hold, Min-hold trace functions
- Display scaling
- Auto or manual: Auto resets scale after each measurement
- Markers
- Up to 5 markers on any trace; Absolute and Delta marker functions
- Limit mask testing
- Positive and negative limits may be applied to noise figure, gain, Y-factor traces; limits and Pass/Fail indicated on screen
- Uncertainty calculator
- Provides noise figure and gain measurement uncertainty based on user-entered values for ENR, external preamp, external preamp, and spectrum analyzer parameters
- Application preset for Noise Figure and Gain
- Sets the analyzer to measure Gain, Noise Figure, and the Measurement Table. Sets attenuation to zero, preamplifier ON, and acquisition mode to best for minimum noise
- Performance
-
Specification Description Frequency range 10 MHz to maximum frequency of instrument (nominal) Noise figure measurement range 0 to 30 dB (nominal) Gain measurement range -10 to 30 dB (nominal) Noise figure and gain measurement resolution 0.01 dB (nominal) Noise figure measurement error ±0.1 dB (typical) 1 Gain measurement error ±0.1 dB (typical) 1 Note: These conditions for Noise Figure and Gain specifications apply: Operating temperature 18 to 28 deg. C, after 20 minute warmup with internal preamp ON, immediately after internal alignment. Specified error includes only the error of the spectrum analyzer. Uncertainty from errors in ENR source level, external amplifier gain, low SN ratio and measurement system mismatch are not included, and can all be estimated using the uncertainty calculator included in the software.
1For (ENR of noise source) > (measured noise figure + 4 dB)
Advanced measurement suite (Opt. 20)
- Available displays
- Pulse results table, Pulse trace (selectable by pulse number), Pulse statistics (trend of pulse results, FFT of trend, and histogram), Cumulative Statistics, Cumulative Histogram and Pulse-Ogram.
- Measurements
- Average on power, Peak power, Average transmitted power, Pulse width, Rise time, Fall time, Repetition interval (seconds), Repetition rate (Hz), Duty factor (%), Duty factor (ratio), Ripple (dB), Ripple (%), Droop (dB), Droop (%), Overshoot (dB), Overshoot (%), Pulse frequency, Delta frequency, Pulse-Ref Pulse frequency difference, Pulse-Ref Pulse Phase difference, Pulse-Pulse frequency difference, Pulse-Pulse phase difference, RMS frequency error, Max frequency error, RMS phase error, Max phase error, Frequency deviation, Phase deviation, Impulse response (dB), Impulse response (time), Time stamp
- Minimum pulse width for detection
- 150 ns (standard), 50 ns (Opt. 110)
- Number of pulses1
- 1 to 200,000; offline analysis of more than 40,000 continuous pulses is recommended using fast frame mode and fast save option
1Actual number depends on time length, pulse bandwidth and instrument configuration.
- System rise time (typical)
- <25 ns (standard), <10 ns (Opt. 110)
- Pulse measurement accuracy
- Signal conditions: Unless otherwise stated, pulse width >450 ns (150 ns, Opt. 110), S/N ratio ≥30 dB, duty cycle 0.5 to 0.001, temperature 18 °C to 28 °C
- Impulse response
-
Measurement range: 15 to 40 dB across the width of the chirp
Measurement accuracy (typical): ±2 dB for a signal 40 dB in amplitude and delayed 1% to 40% of the pulse chirp width1
1Chirp width 100 MHz, pulse width 10 μs, minimum signal delay 1% of pulse width or 10/(chirp bandwidth), whichever is greater, and minimum 2000 sample points during pulse on-time.
- Impulse response weighting
- Taylor window
Pulse measurement performance
- Pulse amplitude and timing
-
Measurement Accuracy (Typical) Average On Power 1 ±0.3 dB + absolute amplitude accuracy Average Transmitted Power 2 ±0.4 dB + absolute amplitude accuracy Peak Power 3 ±0.4 dB + absolute amplitude accuracy Pulse Width ±3% of reading Duty Factor ±3% of reading
1Pulse Width >300 ns (100 ns, Opt. 110).
2Pulse Width >300 ns (100 ns, Opt. 110).
3Pulse Width >300 ns (100 ns, Opt. 110).
- Frequency and phase error referenced to nonchirped signal
- At stated frequencies and measurement bandwidths, 1 typical.
- 20 MHz bandwidth
-
Center frequency Abs. freq err (RMS) Pulse-pulse freq Pulse-pulse phase 2 GHz ±5 kHz ±13 kHz ±0.3° 10 GHz ±5 kHz ±40 kHz ±0.6° 20 GHz ±8 kHz ±60 kHz ±1.3° - 40 MHz bandwidth
-
Center frequency Abs. freq err (RMS) Pulse-pulse freq Pulse-pulse phase 2 GHz ±10 kHz ±30 kHz ±.35° 10 GHz ±10 kHz ±50 kHz ±0.75° 20 GHz ±20 kHz ±60 kHz ±1.3° - 60 MHz bandwidth (Opt. 110)
-
Center frequency Abs. freq err (RMS) Pulse-pulse freq Pulse-pulse phase 2 GHz ±30 kHz ±70 kHz ±0.5° 10 GHz ±30 kHz ±150 kHz ±0.75° 20 GHz ±50 kHz ±275 kHz ±1.5° - 110 MHz bandwidth (Opt. 110)
-
Center frequency Abs. freq err (RMS) Pulse-pulse freq Pulse-pulse phase 2 GHz ±50 kHz ±170 kHz ±0.6° 10 GHz ±50 kHz ±150 kHz ±0.75° 20 GHz ±100 kHz ±300 kHz ±1.5°
1Pulse ON Power ≥ -20 dBm, signal peak at Reference Level, Attenuator = Auto, tmeas- treference≤ 10 ms, Frequency Estimation: Manual. Pulse-to-Pulse Measurement time position excludes the beginning and ending of the pulse extending for a time = (10 / Measurement BW) as measured from 50% of the t(rise)or t(fall). Absolute Frequency Error determined over center 50% of pulse.
- Frequency and phase error referenced to a linear chirp
- At stated frequencies and measurement bandwidths 1, typical. Signal type: Linear Chirp, Peak-to-Peak Chirp Deviation: ≤0.8 Measurement BW.
- 20 MHz bandwidth
-
Center frequency Abs. freq err (RMS) Pulse-pulse freq Pulse-pulse phase 2 GHz ±10 kHz ±25 kHz ±0.4° 10 GHz ±15 kHz ±30 kHz ±0.9° 20 GHz ±25 kHz ±50 kHz ±1.8° - 40 MHz bandwidth
-
Center frequency Abs. freq err (RMS) Pulse-pulse freq Pulse-pulse phase 2 GHz ±12 kHz ±40 kHz ±0.4° 10 GHz ±15 kHz ±50 kHz ±1.0° 20 GHz ±30 kHz ±130 kHz ±2.0° - 60 MHz bandwidth (Opt. 110)
-
Center frequency Abs. freq err (RMS) Pulse-pulse freq Pulse-pulse phase 2 GHz ±60 kHz ±130 kHz ±0.5° 10 GHz ±60 kHz ±150 kHz ±1.0° 20 GHz ±75 kHz ±200 kHz ±2.0° - 110 MHz bandwidth (Opt. 110)
-
Center frequency Abs. freq err (RMS) Pulse-pulse freq Pulse-pulse phase 2 GHz ±75 kHz ±275 kHz ±0.6° 10 GHz ±75 kHz ±300 kHz ±1.0° 20 GHz ±125 kHz ±500 kHz ±2.0°
1Pulse ON Power ≥ -20 dBm, signal peak at Reference Level, Attenuator = Auto, tmeas- treference≤ 10 ms, Frequency Estimation: Manual. Pulse-to-Pulse Measurement time position excludes the beginning and ending of the pulse extending for a time = (10 / Measurement BW) as measured from 50% of the t(rise)or t(fall). Absolute Frequency Error determined over center 50% of pulse.
Digital modulation analysis (Opt. 21)
- Available displays
- Constellation diagram, EVM vs. time, Symbol table (binary or hexadecimal), Magnitude and phase error versus time, and signal quality, Demodulated IQ vs. time, Eye diagram, Trellis diagram, Frequency deviation vs. time
- Modulation formats
- π/2DBPSK, BPSK, SBPSK, QPSK, DQPSK, π/4DQPSK, D8PSK, D16PSK, 8PSK, OQPSK, SOQPSK, CPM, 16/32-APSK, 16/32/64/128/256QAM, MSK, GMSK, 2-FSK, 4-FSK, 8-FSK, 16-FSK, C4FM
- Analysis period
- Up to 81,000 samples
- Filter types
-
- Measurement filters
- Square-root raised cosine, Raised cosine, Gaussian, Rectangular, IS-95, IS-95 EQ, C4FM-P25, Half-sine, None, User defined
- Reference filters
- Raised cosine, Gaussian, Rectangular, IS-95, SBPSK-MIL, SOQPSK-MIL, SOQPSK-ARTM, none, user defined
- Alpha/B*T range
- 0.001 to 1, 0.001 step
- Measurements
-
Constellation, Error vector magnitude (EVM) vs. Time, Modulation error ratio (MER), Magnitude error vs. Time, Phase error vs. Time, Signal quality, Symbol table, Rho
FSK only: Frequency deviation, Symbol timing error
- Symbol rate range
- 1 kS/s to 100 MS/s (modulated signal must be contained entirely within acquisition BW of the instrument)
Digital (Opt. 21)
- QPSK residual EVM (typical)1
-
- 100 kS/s
- <0.5%
- 1 MS/s
- <0.5%
- 10 MS/s
- <0.6%
- 30 MS/s
- <1.5%
- 80 MS/s (Opt. 110)
- <2.0%
1CF = 2 GHz, Measurement Filter = root raised cosine, Reference Filter = raised cosine,Analysis Length = 200 symbols.
- 256 QAM residual EVM (typical)1
-
- 10 MS/s
- <0.5%
- 30 MS/s
- <0.8%
- 80 MS/s (Opt. 110)
- <0.8%
1CF = 2 GHz, Measurement Filter = root raised cosine, Reference Filter = raised cosine,Analysis Length = 400 symbols.
- Offset QPSK residual EVM (typical)1
-
- 100 kS/s
- <0.5%
- 1 MS/s
- <0.5%
- 10 MS/s
- <1.4%
1CF = 2 GHz, Measurement Filter = root raised cosine, Reference Filter = raised cosine, Analysis Length = 400 symbols.
- S-OQPSK (MIL, ARTM) residual EVM (typical)1
-
- 4 kS/s, CF = 250 MHz
- <0.5%
- 20 kS/s
- <0.5%
- 100 kS/s
- <0.5%
- 1 MS/s
- <0.5%
1CF = 2 GHz unless otherwise noted. Reference Filters: MIL STD, ARTM, Measurement Filter: none.
- S-BPSK (MIL) residual EVM (typical)1
-
- 4 kS/s, CF = 250 MHz
- <0.4%
- 20 kS/s
- <0.5%
- 100 kS/s
- <0.5%
- 1 MS/s
- <0.5%
1CF = 2 GHz unless otherwise noted. Reference Filter: MIL STD.
- CPM (MIL) residual EVM (typical)1
-
- 4 kS/s, CF = 250 MHz
- <0.5%
- 20 kS/s
- <0.5%
- 100 kS/s
- <0.5%
- 1 MS/s
- <0.5%
1CF = 2 GHz unless otherwise noted. Reference Filter: MIL STD.
- 2/4/8/16 FSK residual RMS FSK error (typical)1
-
- 10 kS/s, deviation 10 kHz
- <0.6%
1CF = 2 GHz. Reference Filter: None, Measurement Filter: None.
Adaptive equalizer characteristics
- Type
- Linear, decision-directed, feed-forward (FIR) equalizer with co-efficient adaptation and adjustable convergence rate
- Modulation types supported
- BPSK, QPSK, OQPSK, π/2DBPSK, π/4DQPSK, 8PSK, 8DPSK, 16DPSK, 16/32/64/128/256QAM
- Reference filters for all modulation types except OQPSK
- Raised cosine, rectangular, none
- Reference filters for OQPSK
- Raised cosine, half sine
- Filter length
- 3 to 2001 taps
- Taps/Symbol: raised cosine, half sine
- 1, 2, 4, 8
- Taps/Symbol: rectangular filter, no filter
- 1
- Equalizer controls
- Off, train, hold, reset
Flexible OFDM characteristics (Opt. 22)
- Available displays
- Constellation, scalar measurement summary, EVM or power vs. carrier, symbol table (binary or hexadecimal)
- Recallable standards
- WiMAX 802.16-2004, WLAN 802.11a/g/j/p
- Parameter settings
- Guard interval, subcarrier spacing, channel bandwidth
- Advanced parameter settings
-
Constellation detect: auto; manual select (BPSK, QPSK, 16QAM, 64QAM)
Symbol analysis offset: (–100% to 0%)
Pilot tracking: phase, amplitude, Timing
Swap I and Q: Enable/Disable
- Summary measurements
-
Symbol clock error, frequency error, average power, Peak-to-Average, CPE
EVM (RMS and peak) for all carriers, plot carriers, data carriers
OFDM parameters: number of symbols, frequency error, symbol clock error, IQ origin offset, CPE, average power, Peak-to-Average Power
EVM (RMS and peak) for all subcarriers, pilot subcarriers, data subcarriers
- Displays
-
EVM vs. Symbol, vs. Subcarrier
Subcarrier Power vs. Symbol, vs. Subcarrier
Subcarrier Constellation
Symbol Data Table
Mag Error vs. Symbol, vs. Subcarrier
Phase Error vs. Symbol, vs. Subcarrier
Channel Frequency Response
- Residual EVM
-
-49 dB (WiMAX 802.16-2004, 5 MHz BW)
-49 dB (WLAN 802.11g, 20 MHz BW)
Signal input power optimized for best EVM
WLAN IEEE802.11a/b/g/j/p (Opt. 23)
- General characteristics
-
- Modulation formats
- DBPSK (DSSS-1M), DQPSK (DSSS-2M), CCK 5.5M, CCK 11M , OFDM (BPSK, QPSK, 16 or 64QAM)
- Measurements and displays
-
Burst Index, Burst Power, Peak to Average Burst Power, IQ Origin Offset, Frequency Error, Common Pilot Error, Symbol Clock Error
RMS and Peak EVM for Pilots/Data, Peak EVM located per Symbol and Subcarrier
Packet Header Format Information
Average Power and RMS EVM per section of the header
WLAN Power vs. Time, WLAN Symbol Table, WLAN Constellation
Spectrum Emission Mask, Spurious
Error Vector Magnitude (EVM) vs. Symbol (or Time), vs. Subcarrier (or Frequency)
Mag Error vs. Symbol (or Time), vs. Subcarrier (or Frequency)
Phase Error vs. Symbol (or Time), vs. Subcarrier (or Frequency)
WLAN Channel Frequency Response vs. Symbol (or Time), vs. Subcarrier (or Frequency)
WLAN Spectral Flatness vs. Symbol (or Time), vs. Subcarrier (or Frequency)
- Residual EVM - 802.11b (CCK-11Mbps)
-
RMS-EVM over 1000 chips, EQ On; 2.4 GHz: 1.1% (-39.3 dB), typical, 0.95% (-40.5 dB) typical-mean
Signal input power optimized for best EVM
- Residual EVM - 802.11a/g/j (OFDM, 20 MHz, 64-QAM)
-
2.4 GHz: –49 dB; 5.8 GHz: –48 dB typical, –49 dB typical-mean; (RMS-EVM averaged over 20 bursts, 16 symbols each)
Signal input power optimized for best EVM
WLAN IEEE802.11n (Opt. 24)
- General characteristics
-
- Modulation formats
- SISO, OFDM (BPSK, QPSK, 16 or 64QAM)
- Measurements and displays
-
Burst Index, Burst Power, Peak to Average Burst Power, IQ Origin Offset, Frequency Error, Common Pilot Error, Symbol Clock Error,
RMS and Peak EVM for Pilots/Data, Peak EVM located per Symbol and Subcarrier
Packet Header Format Information
Average Power and RMS EVM per section of the header
WLAN Power vs. Time, WLAN Symbol Table, WLAN Constellation
Spectrum Emission Mask, Spurious
Error Vector Magnitude (EVM) vs. Symbol (or Time), vs. Subcarrier (or Frequency)
Mag Error vs. Symbol (or Time), vs. Subcarrier (or Frequency)
Phase Error vs. Symbol (or Time), vs. Subcarrier (or Frequency)
WLAN Channel Frequency Response vs. Symbol (or Time), vs. Subcarrier (or Frequency)
WLAN Spectral Flatness vs. Symbol (or Time), vs. Subcarrier (or Frequency)
- Residual EVM - 802.11n (40 MHz, 64-QAM)
-
–45 dB typical, –47 dB typical-mean (5.8 GHz, RMS-EVM averaged over 20 bursts, 16 symbols each)
Signal input power optimized for best EVM
WLAN IEEE802.11ac (Opt. 25)
- General characteristics
-
- Modulation formats
- SISO, OFDM (BPSK, QPSK, 16, 64, 256QAM)
- Measurements and displays
-
Burst Index, Burst Power, Peak to Average Burst Power, IQ Origin Offset, Frequency Error, Common Pilot Error, Symbol Clock Error,
RMS and Peak EVM for Pilots/Data, Peak EVM located per Symbol and Subcarrier
Packet Header Format Information
Average Power and RMS EVM per section of the header
WLAN Power vs. Time, WLAN Symbol Table, WLAN Constellation
Spectrum Emission Mask, Spurious
Error Vector Magnitude (EVM) vs. Symbol (or Time), vs. Subcarrier (or Frequency)
Mag Error vs. Symbol (or Time), vs. Subcarrier (or Frequency)
Phase Error vs. Symbol (or Time), vs. Subcarrier (or Frequency)
WLAN Channel Frequency Response vs. Symbol (or Time), vs. Subcarrier (or Frequency)
WLAN Spectral Flatness vs. Symbol (or Time), vs. Subcarrier (or Frequency)
- Residual EVM - 802.11ac (256-QAM)
- –42 dB typical, –44.6 dB typical-mean (5.8 GHz, 80 MHz RMS-EVM averaged over 20 bursts, 16 symbols each)
Bluetooth (Option 27)
- Basic Rate, Bluetooth Low Energy, Enhanced Data Rate - Revision 4.2
- Measurements and displays
-
Peak power, average power, adjacent channel power or inband emission mask,
-20 dB bandwidth, frequency error, modulation characteristics including ΔF1avg (11110000),
ΔF2avg (10101010), ΔF2 > 115 kHz, ΔF2/ΔF1 ratio, frequency deviation vs. time with packet and octet
level measurement information, carrier frequency f0, frequency offset (Preamble and Payload), max
frequency offset, frequency drift f1-f0, max drift rate fn-f0and fn-fn-5, center frequency
offset table and frequency drift table, color-coded symbol table, packet header decoding information,
eye diagram, constellation diagram
- Output power (average and peak)
-
- Level uncertainty
- Refer to instrument amplitude and flatness specification
- Measurement range
- > -70 dBm
- Modulation characteristics (ΔF1avg, ΔF2avg, ΔF2avg/ ΔF1avg, ΔF2max ≥115 kHz)
-
- Deviation range
- ± 280 kHz
- Deviation uncertainty (at 0 dBm)
- < 2 kHz + instrument frequency uncertainty (Basic Rate)
< 3 kHz + instrument frequency uncertainty (Low Energy)
- Measurement resolution
- 10 Hz
- Measurement range
- Nominal channel frequency ±100 kHz
- Initial Carrier Frequency Tolerance (ICFT)
-
- Measurement uncertainty (at 0 dBm)
- <1 kHz + instrument frequency uncertainty
- Measurement resolution
- 10 Hz
- Measurement range
- Nominal channel frequency ±100 kHz
- Carrier frequency drift
-
- Supported measurements
-
Max freq. offset, drift f1- f0, max drift fn-f0, max drift fn-fn-5(50 μs)
- Measurement uncertainty
- < 1 kHz + instrument frequency uncertainty
- Measurement resolution
- 10 Hz
- Measurement range
- Nominal channel frequency ±100 kHz
- In-band emissions and ACP
-
- Level uncertainty
- Refer to instrument amplitude and flatness specification
LTE Downlink RF measurements (Opt. 28)
- Standard Supported
- 3GPP TS 36.141 Version 12.5
- Frame Format supported
- FDD and TDD
- Measurements and Displays Supported
- Adjacent Channel Leakage Ratio (ACLR), Spectrum Emission Mask (SEM), Channel Power, Occupied Bandwidth, Power vs. Time showing Transmitter OFF power for TDD signals and LTE constellation diagram for PSS, SSS with Cell ID, Group ID, Sector ID and Frequency Error.
- ACLR with E-UTRA bands (Nominal, with Noise Correction)
-
- 1st Adjacent Channel
-
72 dB
- 2nd Adjacent Channel
-
73 dB
APCO P25 measurement (Option 26)
- Modulation formats
- Phase 1 (C4FM), Phase 2 (HCPM, HDQPSK)
- Measurements and displays
- RF output power, operating frequency accuracy, modulation emission spectrum,
unwanted emissions spurious, adjacent channel power ratio, frequency deviation,
modulation fidelity, frequency error, eye diagram, symbol table, symbol rate accuracy,
transmitter power and encoder attack time, transmitter throughput delay, frequency
deviation vs. time, power vs. time, transient frequency behavior, HCPM transmitter logical
channel peak adjacent channel power ratio, HCPM transmitter logical channel off slot power,
HCPM transmitter logical channel power envelope, HCPM transmitter logical channel time alignment
- Residual modulation fidelity
-
- Phase 1 (C4FM)
- ≤1.0% typical
- Phase 2 (HCPM)
- ≤0.5% typical
- Phase 2 (HDQPSK)
- ≤0.4% typical
- Adjacent channel power ratio 1
-
- 25 kHz offset from the center and bandwidth of 6 kHz
- -71 dBc typical
- 62.5 kHz offset from the center and bandwidth of 6 kHz
- -72 dBc typical
1Measured with test signal amplitude adjusted for optimum performance if necessary. Measured with Averaging, 10 waveforms.
Mapping and field strength (Option MAP)
- RF field strength
-
- Signal strength indicator
- Located at right-side of display
- Measurement bandwidth
- Up to 165 MHz, dependent on span and RBW setting
- Tone type
- Variable frequency
- Mapping
-
- Map types directly supported
- Pitney Bowes MapInfo (*.mif), Bitmap (*.bmp), Open Street Maps (.osm)
- Saved measurement results
-
Measurement data files (exported results)
Map file used for the measurements
Google earth KMZ file
Recallable results files (trace and setup files)
MapInfo-compatible MIF/MID files
Modulation analysis accuracy
- AM demodulation accuracy
-
±2%
0 dBm input at center
Carrier frequency 1 GHz, 10 to 60% modulation depth, 1 kHz/5 kHz Input/Modulated frequency
- PM demodulation accuracy
-
±3°
0 dBm input at center
Carrier frequency 1 GHz, 400 hz/1 kHz Input/Modulated frequency
- FM demodulation accuracy
-
±1% of span
0 dBm input at center
Carrier frequency 1 GHz, 1 kHz/5 kHz Input/Modulated frequency
Inputs and outputs
- Front panel
-
- Display
- Touch panel, 10.4 in. (264 mm)
- Planar crown™ RF input connector
-
Type-N Female (RSA6106B and RSA6114B)
3.5 mm Male (RSA6120B only)
SMA (m) to SMA (f) adapter (RSA6120B only)
- Trigger out
- BNC, High: >2.0 V, Low: <0.4 V, output current 1 mA (LVTTL), 50 Ω
- Trigger in
- BNC, 50 Ω/5 kΩ impedance (nominal), ±5 V max input, -2.5 V to +2.5 V trigger level
- USB ports
- 1 USB 2.0, 1 USB 1.1
- Audio
- Speaker
- Rear panel
-
- 10 MHz REF OUT
- 50 Ω, BNC, >0 dBm
- External REF IN
- 50 Ω, BNC, -10 dBm - +6 dBm, 1 to 25 MHz in 1 MHz steps, plus 1.2288, 4.8, 19.6608, and 31.07 MHz
- External REF IN frequency accuracy required
- ≤ ±0.3 ppm
- Trig 2 / gate IN
- BNC, High: 1.6 to 5.0 V, Low: 0 to 0.5 V
- GPIB interface
- IEEE 488.2
- LAN interface ethernet
- Rj45, 10/100/1000base-t
- USB ports
- USB 2.0, two ports
- VGA output
- VGA compatible, 15 DSUB
- Audio out
- 3.5 mm headphone jack
- Noise source drive
- BNC, +28 v, 140 mA (nominal)
General characteristics
- Temperature range
-
- Operating
-
+5 °C to +50 °C.
(+5 °C to +40 °C when accessing DVD)
- Storage
- –20 °C to +60 °C
- Warm-up time
- 20 minutes
- Altitude
-
- Operating
- Up to 3000 m (approximately 10,000 ft.)
- Nonoperating
- Up to 12,190 m (40,000 ft.)
- Relative humidity
-
- Operating and nonoperating
- +40 °C at 95% relative humidity, meets intent of EN 60068-2-30. 1
1Frequency amplitude response may vary up to ±3 dB at +40 °C and greater than 45% relative humidity.
- Vibration
-
- Operating (except when equipped with option 56 removable SSD)
- 0.22GRMS . Profile = 0.00010 g2 /Hz at 5-350 Hz, -3 dB/Octave slope from 350-500 Hz, 0.00007 g2 /Hz at 500 Hz, 3 Axes at 10 min/axis
- Nonoperating
- 2.28GRMS . Profile = 0.0175 g2 /Hz at 5-100 Hz, -3 dB/Octave slope from 100-200 Hz, 0.00875 g2 /Hz at 200-350 Hz,-3 dB/Octave slope from 350-500 Hz, 0.006132 g2 /Hz at 500 Hz, 3 Axes at 10 min/axis
- Shock
-
- Operating
- 15 G, half-sine, 11 ms duration. (1 G max when accessing DVD and Opt. 56 Removable HDD)
- Non-operating
- 30 g, half-sine, 11 ms duration
- Safety
-
L 61010-1:2004
CSA C22.2 No.61010-1-04
- Electromagnetic compatibility
-
Complies with EU council EMC directive 2004/108/EC
Complies with EN61326, Class A
- Power requirements
-
90 V AC to 240 V AC, 50 Hz to 60 Hz
90 V AC to 132 V AC, 400 Hz
- Power consumption
- 450 W max
- Data storage
- Internal HDD, USB ports, DVD±RW (Opt. 59), Removable HDD (Opt. 56)
- Calibration interval
- One year
- Warranty
- One year
- GPIB
- SCPI-compatible, IEEE488.2 compliant
Physical characteristics
- Dimensions (with feet)
-
- Height
- 282 mm (11.1 in.)
- Width
- 473 mm (18.6 in.)
- Depth
- 531 mm (20.9 in.)
- Weight
-
- With all options
-
kg lb 26.4 58
Ordering information
Models
- RSA6106B
- Spectrum analyzer, 9 kHz to 6.2 GHz, 40 MHz capture BW
- RSA6114B
- Spectrum analyzer, 9 kHz to 14 GHz, 40 MHz capture BW
- RSA6120B
- Spectrum analyzer, 9 kHz to 20 GHz, 40 MHz capture BW
Note: Please specify power plug and language options when ordering.
Standard accessories
Accessories
- All instruments include
- Product documentation CD (Quick-start user manual, Application examples manual, Printable online help, Programmer manual, Service manual, Specification and Performance Verification manual, Declassification and Security instructions), Front cover, USB keyboard, USB mouse, and Planar crown™ RF input connector – Type-N (RSA6106B and RSA6114B) / 3.5 mm (RSA6120B only) / SMA (m) to SMA (f) adapter (RSA6120B only)
Warranty
One-year warrantyOptions12
| Option | Description |
|---|---|
| Opt. 05 | Digital IQ Output and 500 MHz Analog IF Output |
| Opt. 09 | Enhanced Real Time |
| Opt. 10 | AM/FM/PM Modulation and Audio Measurements |
| Opt. 11 | Phase Noise and Jitter Measurement |
| Opt. 12 | Settling Time Measurements (Frequency and Phase) |
| Opt. 14 | Noise Figure and Gain (Internal preamp recommended) |
| Opt. 20 | Advanced Signal Analysis (including pulse measurements) |
| Opt. 21 | General Purpose Digital Modulation Analysis |
| Opt. 22 | Flexible OFDM |
| Opt. 23 | WLAN 802.11a/b/g/j/p measurement application |
| Opt. 24 | WLAN 802.11n measurement application (requires Opt. 23) |
| Opt. 25 | WLAN 802.11ac measurement application (requires Opt. 24) |
| Opt. 26 | APCO P25 measurement application |
| Opt. 27 | Bluetooth Basic LE Tx Measurements |
| Opt. 28 | LTE Downlink RF measurements |
| Opt. MAP | Mapping and signal strength |
| Opt. 50 | Preamp, 1 MHz - 6.2 GHz, 20 dB Gain (RSA6106B only) |
| Opt. 51 | Preamp, 100 kHz - 20 GHz, 30 dB Gain (RSA6114B and RSA6120B only) |
| Opt. 52 | Frequency Mask Trigger |
| Opt. 53 | Memory Extension, 4 GB Total Acquisition Memory |
| Opt. 56 | Removable SSHD (160 GB SS), incompatible with Option 57, 59, WINXP |
| Opt. 57 | CD/DVD-RW and Fixed Internal HDD (160 GB) incompatible with Option 56, 59, WINXP |
| Opt. 59 | Internal HDD (160 GB), incompatible with Option 56, 57, WINXP |
| Opt. 110 | 110 MHz Capture BW |
| Opt. RSA56KR | Rackmount |
1Options 56, 57, 59, and WinXP are mandatory/exclusive options - one of them must be ordered. There is no charge for Option 59, Internal HDD.
2Options 10, 11, 12, 20, 21, 22, 52, and 110 are SW only. All other options are HW.
Power plug options
- Opt. A0
- North America power plug (115 V, 60 Hz)
- Opt. A1
- Universal Euro power plug (220 V, 50 Hz)
- Opt. A2
- United Kingdom power plug (240 V, 50 Hz)
- Opt. A3
- Australia power plug (240 V, 50 Hz)
- Opt. A4
- North America power plug (240 V, 50 Hz)
- Opt. A5
- Switzerland power plug (220 V, 50 Hz)
- Opt. A6
- Japan power plug (100 V, 50/60 Hz)
- Opt. A10
- China power plug (50 Hz)
- Opt. A11
- India power plug (50 Hz)
- Opt. A12
- Brazil power plug (60 Hz)
- Opt. A99
- No power cord
Language options
- Opt. L0
- English manual
- Opt. L5
- Japanese manual
- Opt. L7
- Simplified Chinese manual
- Opt. L10
- Russian manual
- Opt. L99
- No manual
Language options include translated front-panel overlay for the selected language(s).
Service options
- Opt. C3
- Calibration Service 3 Years
- Opt. C5
- Calibration Service 5 Years
- Opt. CA1
- Single Calibration or Functional Verification
- Opt. D1
- Calibration Data Report
- Opt. D3
- Calibration Data Report 3 Years (with Opt. C3)
- Opt. D5
- Calibration Data Report 5 Years (with Opt. C5)
- Opt. G3
- Complete Care 3 Years (includes loaner, scheduled calibration, and more)
- Opt. G5
- Complete Care 5 Years (includes loaner, scheduled calibration, and more)
- Opt. R3
- Repair Service 3 Years (including warranty)
- Opt. R5
- Repair Service 5 Years (including warranty)
Recommended accessories
Upgrades
RSA6BUP
| Option | Description | HW or SW | Factory calibration required? |
|---|---|---|---|
| Opt. 05 | 500 MHz IF, Digital IQ Output | HW | No |
| Opt. 09 | Enhanced Real Time | SW | No |
| Opt. 10 | AM/FM/PM Modulation and Audio Measurements | SW | No |
| Opt. 11 | Phase Noise and Jitter Measurements | SW | No |
| Opt. 12 | Frequency and Phase Settling Measurements | SW | No |
| Opt. 14 | Noise Figure and Gain (Internal preamp recommended) | SW | No |
| Opt. 20 | Advanced Signal Analysis (Pulse Measurement Suite) | SW | No |
| Opt. 21 | GP Digital Modulation Analysis | SW | No |
| Opt. 22 | Flexible OFDM Analysis | SW | No |
| Opt. 23 | WLAN 802.11a/b/g/j/p measurement application | SW | No |
| Opt. 24 | WLAN 802.11n measurement application (requires opt 23) | SW | No |
| Opt. 25 | WLAN 802.11ac measurement application (requires opt 24) | SW | No |
| Opt. 26 | APCO P25 measurement application | SW | No |
| Opt. 27 | Bluetooth Basic LE Tx Measurements | SW | No |
| Opt. 28 | LTE Downlink RF measurements | SW | No |
| Opt. MAP | Mapping and signal strength | SW | No |
| Opt. 50 | Preamp, 1 MHz - 6.2 GHz, 20 dB Gain (RSA6106B only) | HW | Yes |
| Opt. 51 | Preamp, 100 kHz - 20 GHz, 30 dB Gain (RSA6114B and RSA6120B only) | HW | Yes |
| Opt. 52 | Frequency Mask Trigger | SW | No |
| Opt. 53 | Memory Extension, 4 GB Total Acquisition Memory | HW | No |
| Opt. 56 | Removable SSHD (160 GB), incompatible with Option 57, 59, WINXP | HW | No |
| Opt. 57 | CD/DVD-RW and Fixed Internal HDD (160 GB) incompatible with Option 56, 59, WINXP | HW | No |
| Opt. 59 | Internal HDD (160 GB), incompatible with Option 56, 57, WINXP | HW | No |
| Opt. 110 | 110 MHz Real-time Acquisition BW | SW | No |
Tektronix is registered to ISO 9001 and ISO 14001 by SRI Quality System Registrar. Product(s) complies with IEEE Standard 488.1-1987, RS-232-C, and with Tektronix Standard Codes and Formats. Product Area Assessed: The planning, design/development and manufacture of electronic Test and Measurement instruments.
Bluetooth is a registered trademark of Bluetooth SIG, Inc. LTE is a trademark of ETSI. 37W-28055-10


