Oscilloscope Fundamentals
Capturing Your Signal
What is an oscilloscope anyway?
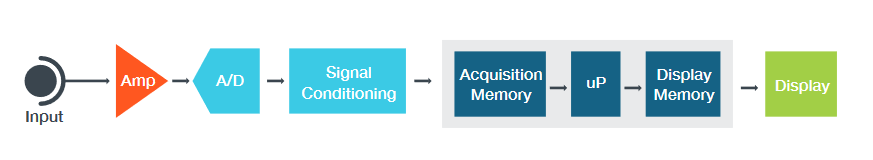
An oscilloscope is a diagnostic instrument that plots the amplitude of an electrical signal as it changes over time. The picture below shows the block diagram of an oscilloscope.
Avoiding Pitfalls
- No Signal:
- Is the channel / device under test turned on?
- Is the waveform off the screen? Try the Autoset feature of adjusting the vertical position / scale.
- Is the instrument waiting for trigger? (Is it displaying “Ready”?) Verify trigger source; try adjusting the trigger level, forcing a trigger or switching to auto mode.
- Aliasing: If the frequency of the signal on the screen seems too low, or it is difficult to get a stable waveform on the screen, adjust horizontal scale to increase the sample rate.
- Unexpected measurement results: Verify that probe is compensated, verify measurement settings such as ref levels and gating, verify the probe attenuation.
- No stable signal: Verify trigger source, trigger level.
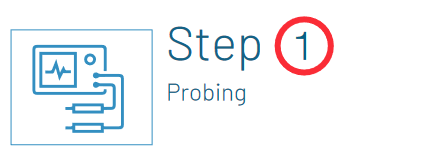
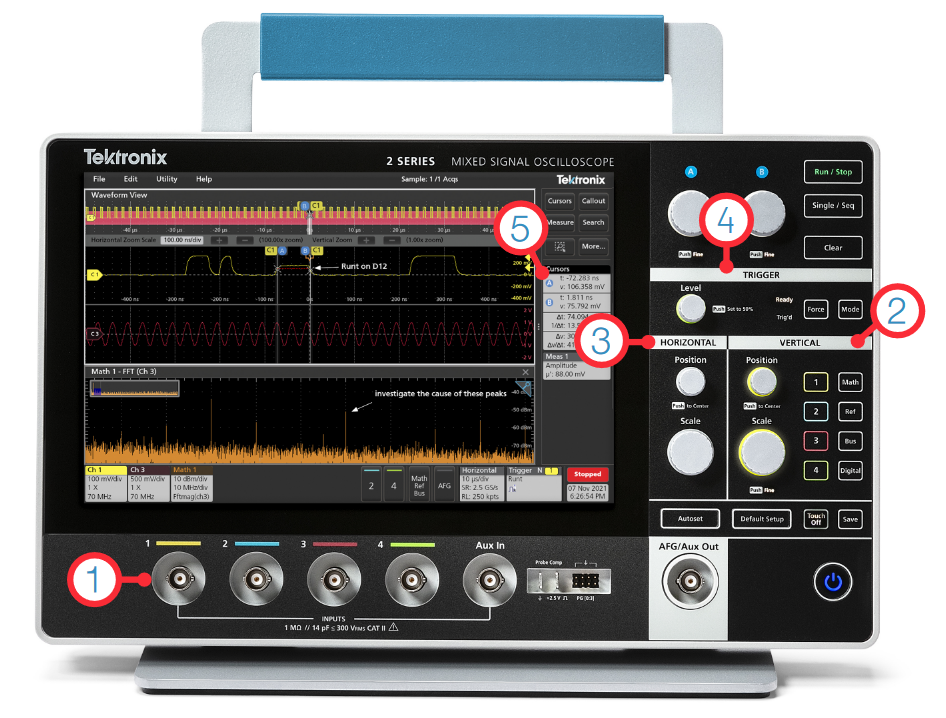
| Connect the instrument to circuit | |
| 1. | Connect the probe to the input channel of the instrument. |
| 2. | Check probe compensation: Attach the probe tip to the probe compensation test point on the instrument. Adjust the probe compensation until you see a clean square wave on the screen. |
| 3. | Connect probe ground to the circuit ground and probe tip to the signal you want to view / measure. |
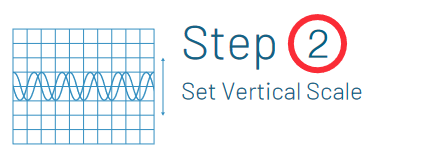
| Set the total amplitude to be displayed on the screen | |
| Scale | Adjusts the size of the waveform on the screen per channel, a larger waveform gives better measurement resolution. |
| Position | Moves the waveform up and down on the screen. |
| Attenuation | Sets the maximum voltage that can be displayed; scope attenuation setting needs to match probe attenuation. |
| Input Coupling | Use DC coupling to see all the input signal. Use AC coupling to see only the AC signal riding on top of a DC offset. |
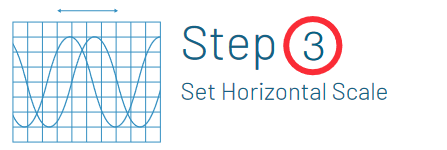
| Set the total time to be displayed on the screen | |
| Scale | Sets the amount of time displayed on the screen for all channels. |
| Position | Moves the waveform left or right on the screen. |
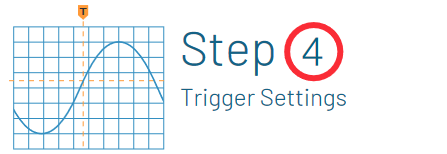
| Stabilize the waveform on the display | |
| Source | Select which input signal is compared to the trigger settings. |
| Type | Edge trigger is the most commonly used trigger type;trigger on rising, falling or both edges. Other more advanced triggers such as Pulse Width, Runt Timeout, Setup and Hold, Rise/Fall Time, Logic and Pattern trigger types are available for capturing more complex events. |
| Level | Determines the voltage level on the input signal at which the trigger occurs. |
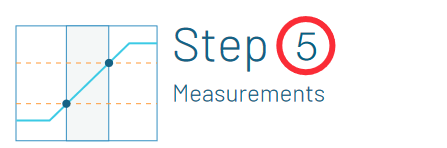
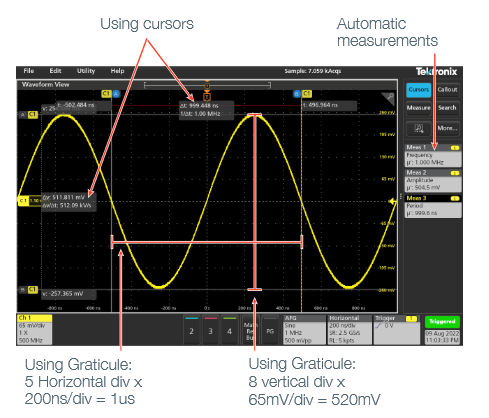
| Measure voltage and time characteristics of signals | |
 |
Find more valuable resources at TEK.COM
Copyright © Tektronix. All rights reserved. Tektronix products are covered by U.S. and foreign patents, issued and pending. Information in this publication supersedes that in all previously published material. Specification and price change privileges reserved. TEKTRONIX and TEK are registered trademarks of Tektronix, Inc. All other trade names referenced are the service marks, trademarks or registered trademarks of their respective companies.
04/2023 3GW-60028-2