Contact us
Call us at
Available 6:00 AM – 5:00 PM (PST) Business Days
Download
Download Manuals, Datasheets, Software and more:
Feedback
4 Series MSO
Mixed Signal Oscilloscope Datasheet
The products on this datasheet are no longer being sold by Tektronix.
View Tektronix Encore for reconditioned test equipment.
Check support and warranty status for these products.
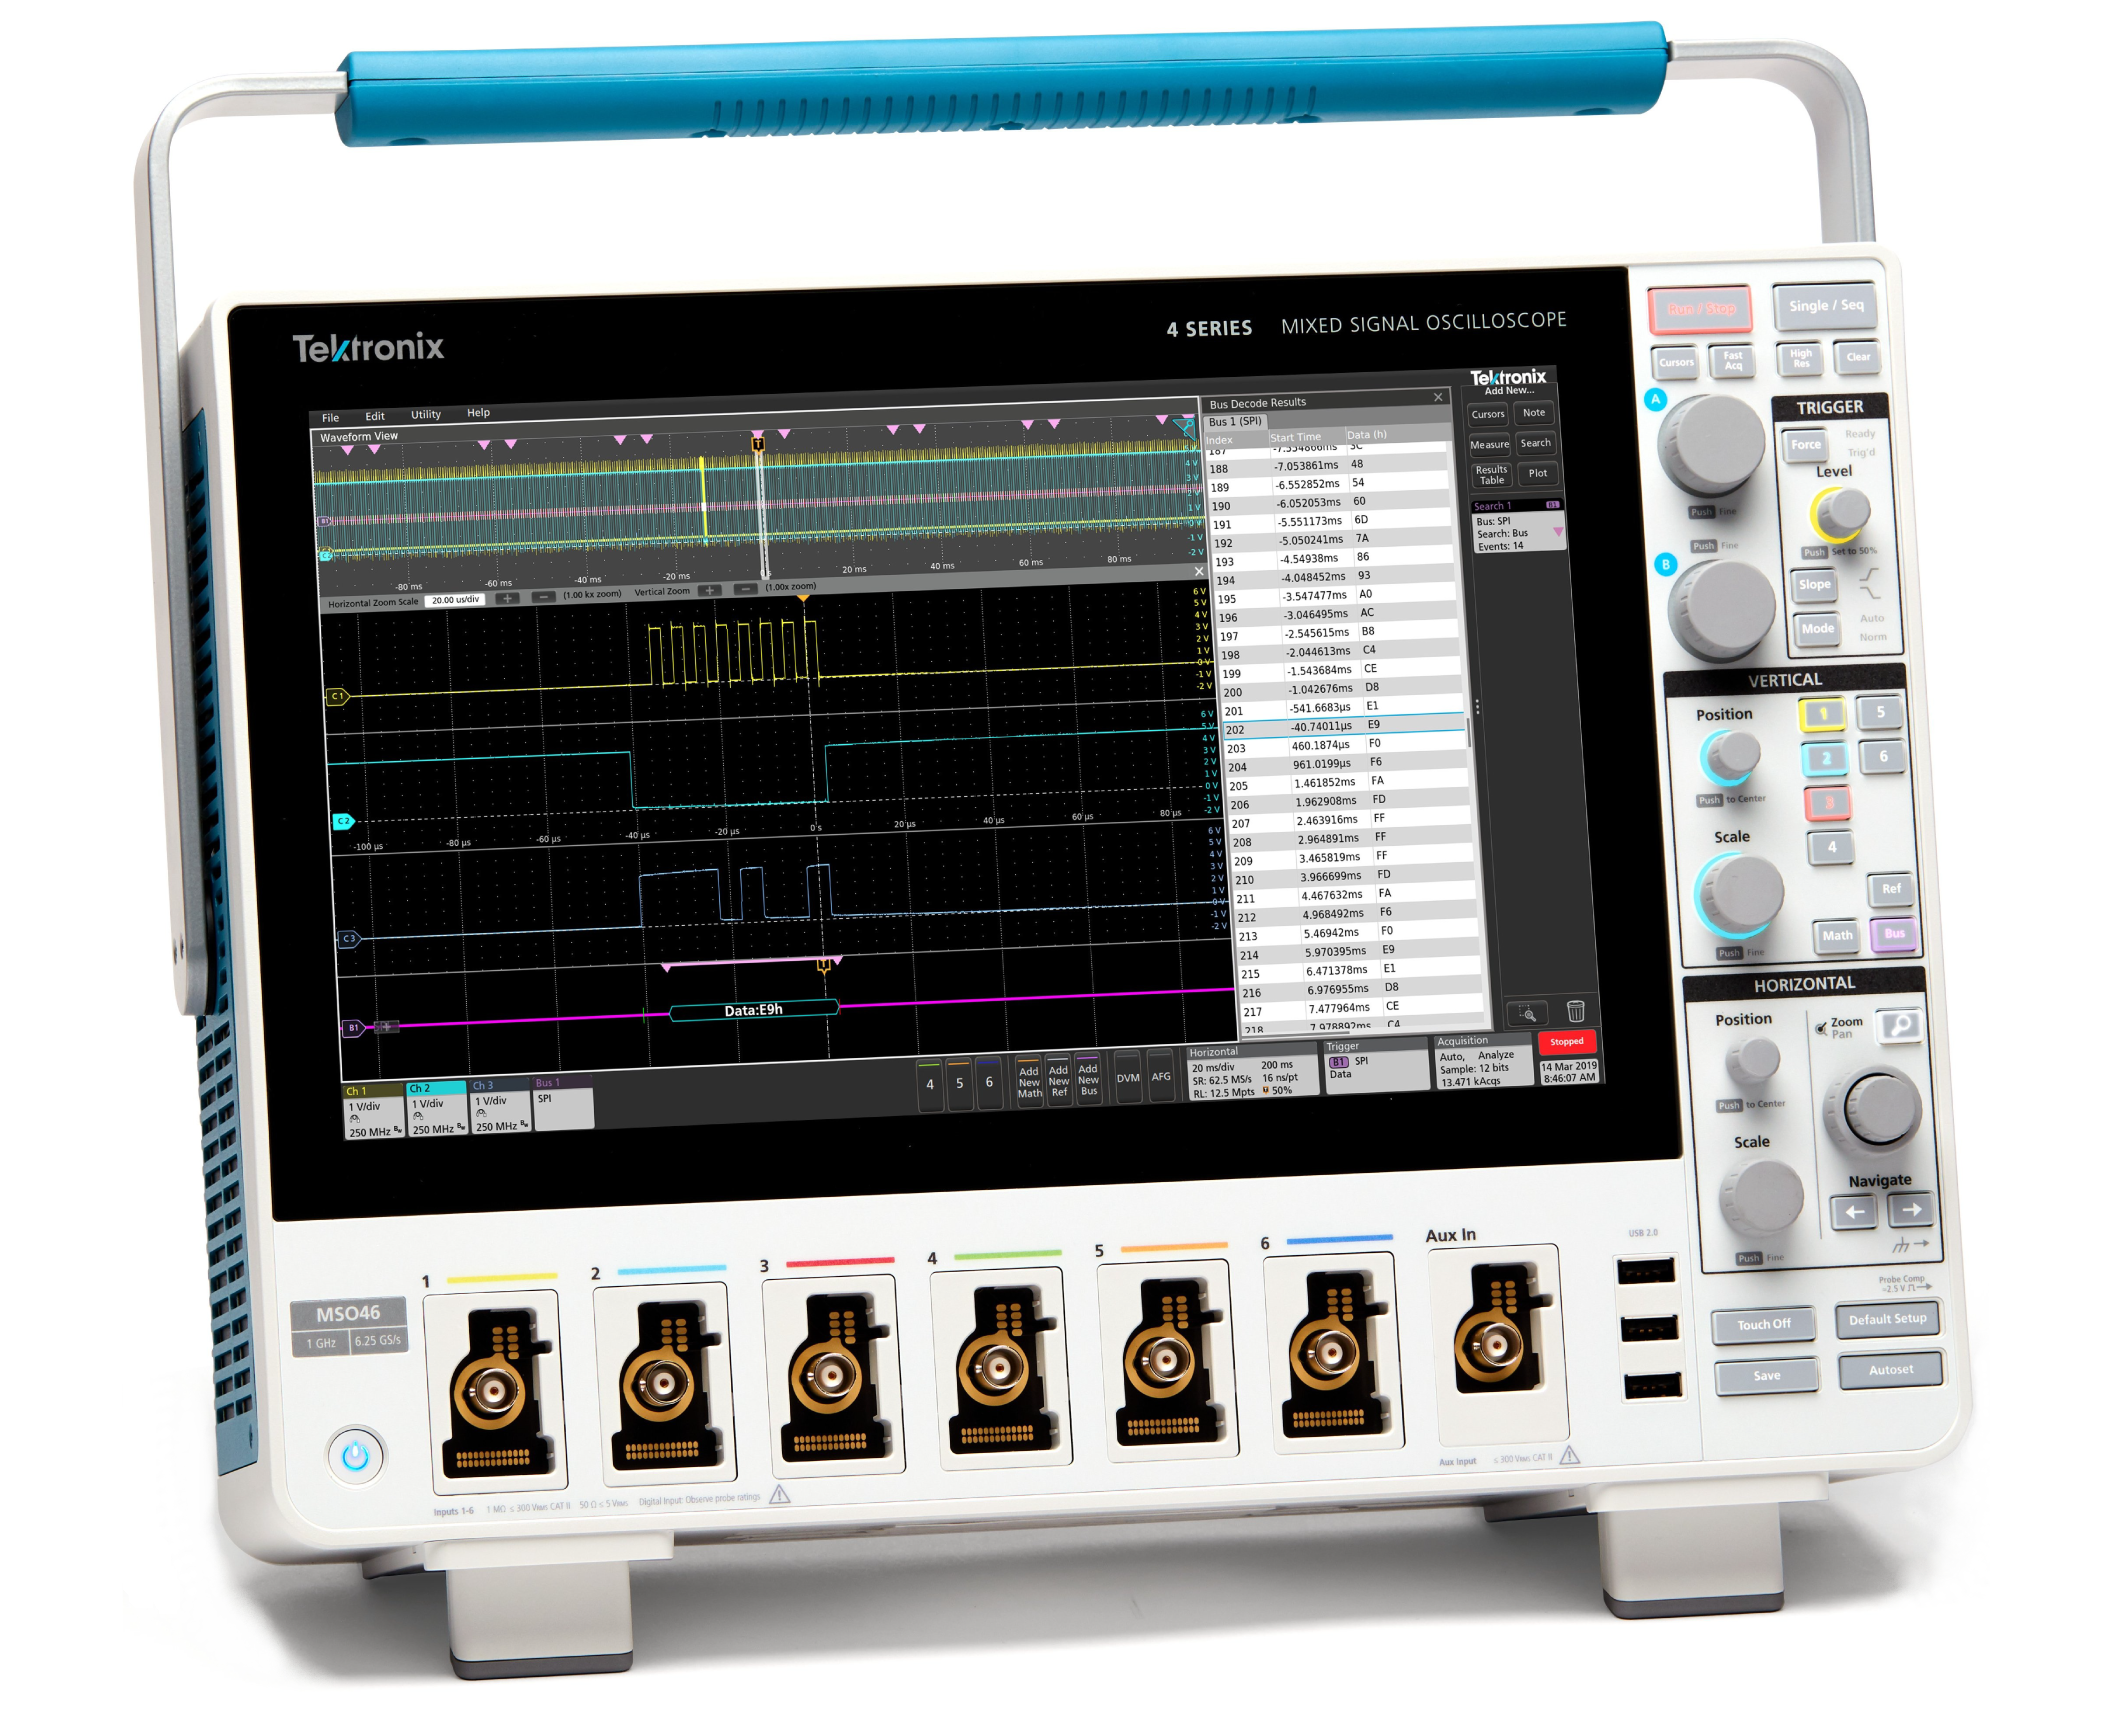
Key performance specifications
With a remarkably innovative pinch-swipe-zoom touchscreen user interface, a high-definition display, and 4 or 6 FlexChannel® inputs that let you measure one analog or eight digital signals per channel, the 4 Series MSO is ready for today’s toughest challenges, and tomorrow’s too. It sets a new standard for performance, analysis, and overall user experience.
Input channels
- 4 or 6 FlexChannel® inputs
- Each FlexChannel provides:
- One analog signal that can be displayed as a waveform view, a spectrum view, or both simultaneously
- Eight digital logic inputs with TLP058 logic probe
Bandwidth (all analog channels)
- 200 MHz, 350 MHz, 500 MHz, 1 GHz, 1.5 GHz (upgradable)
Sample rate (all analog / digital channels)
- Real-time: 6.25 GS/s
Record length (all analog / digital channels)
- 31.25 Mpoints standard (62.5 Mpoints optional upgrade)
Waveform capture rate
- >500,000 waveforms/s
Vertical resolution
- 12-bit ADC
- Up to 16-bits in High Res mode
Standard trigger types
- Edge, Pulse Width, Runt, Timeout, Window, Logic, Setup & Hold, Rise/Fall Time, Parallel Bus, Sequence, Visual Trigger, Video (optional), RF vs. Time (optional)
- Auxiliary Trigger ≤300 VRMS (Edge Trigger only)
Standard analysis
- Cursors: Waveform, V Bars, H Bars, V&H Bars
- Measurements: 36
- Spectrum View: Frequency-domain analysis with independent controls for frequency and time domains
- FastFrame™: Segmented memory acquisition mode with maximum trigger rate >5,000,000 waveforms per second
Plots: Time Trend, Histogram, and Spectrum
- Math: Basic waveform arithmetic, FFT, and advanced equation editor
- Search: Search on any trigger criteria
Optional analysis
- Advanced Spectrum View
- RF vs. Time traces, triggers, Spectrograms, and IQ capture
- Mask/Limit Testing
- Advanced Power Measurements and Analysis
- Three-Phase Electrical Analysis (6 channel model only)
Optional protocol trigger, decode, and analysis
I2C, SPI, eSPI, I3C, RS-232/422/485/UART, SPMI, SMBus, CAN, CAN FD, CAN XL, LIN, FlexRay, SENT, PSI5, CXPI, USB 2.0, eUSB2.0, Ethernet, EtherCAT, Audio, MIL-STD-1553, ARINC 429, Spacewire, NRZ, Manchester, SVID, SDLC, 1-Wire, MDIO, and NFC
Arbitrary/Function Generator (optional and upgradable)
- MHz waveform generation
- Waveform Types: Arbitrary, Sine, Square, Pulse, Ramp, Triangle, DC Level, Gaussian, Lorentz, Exponential Rise/Fall, Sin(x)/x, Random Noise, Haversine, Cardiac
Digital voltmeter (free with product registration)
- 4-digit AC RMS, DC, and DC+AC RMS voltage measurements
Trigger frequency counter (free with product registration)
- 8-digit
Display
- 13.3 inch (338 mm) TFT color
- High Definition (1,920 x 1,080) resolution
- Capacitive (multi-touch) touchscreen
Connectivity
- USB 2.0 Host, USB 2.0 Device (5 ports); LAN (10/100/1000 Base-T Ethernet); HDMI; Requires connection to high definition display (1,920 x 1,080 resolution)
Warranty
- 3 years standard
Dimensions
- 11.299 in (286.99 mm) H x 15.9 in (405 mm) W x 6.1 in (155 mm) D
- Weight: < 16.8 lbs. (7.6 kg)
Never let a lack of channels slow down your verification and debug process again!
The 4 Series MSO offers better visibility into complex systems by offering four and six channel models with a 13.3-inch high-definition (1,920 x 1,080) display. Many applications, such as embedded systems, three-phase power electronics, automotive electronics, power supply design, and DC-to-DC power converters, require the observation of more than four analog signals to verify and characterize device performance, and to debug challenging system issues.
Most engineers can recall situations in which they were debugging a particularly difficult problem and wanted greater system visibility and context, but the scope they were using was limited to two or four analog channels. Using a second scope involves significant effort to align trigger points, difficulty in determining timing relationships across the two displays, and documentation challenges.
And while you might assume that a six channel scope would cost 50% more than a four-channel scope, you'll be pleasantly surprised to find that six channel models are only ~20% more than four channel models. The additional analog channels can pay for themselves quickly by enabling you to keep current and future projects on schedule.
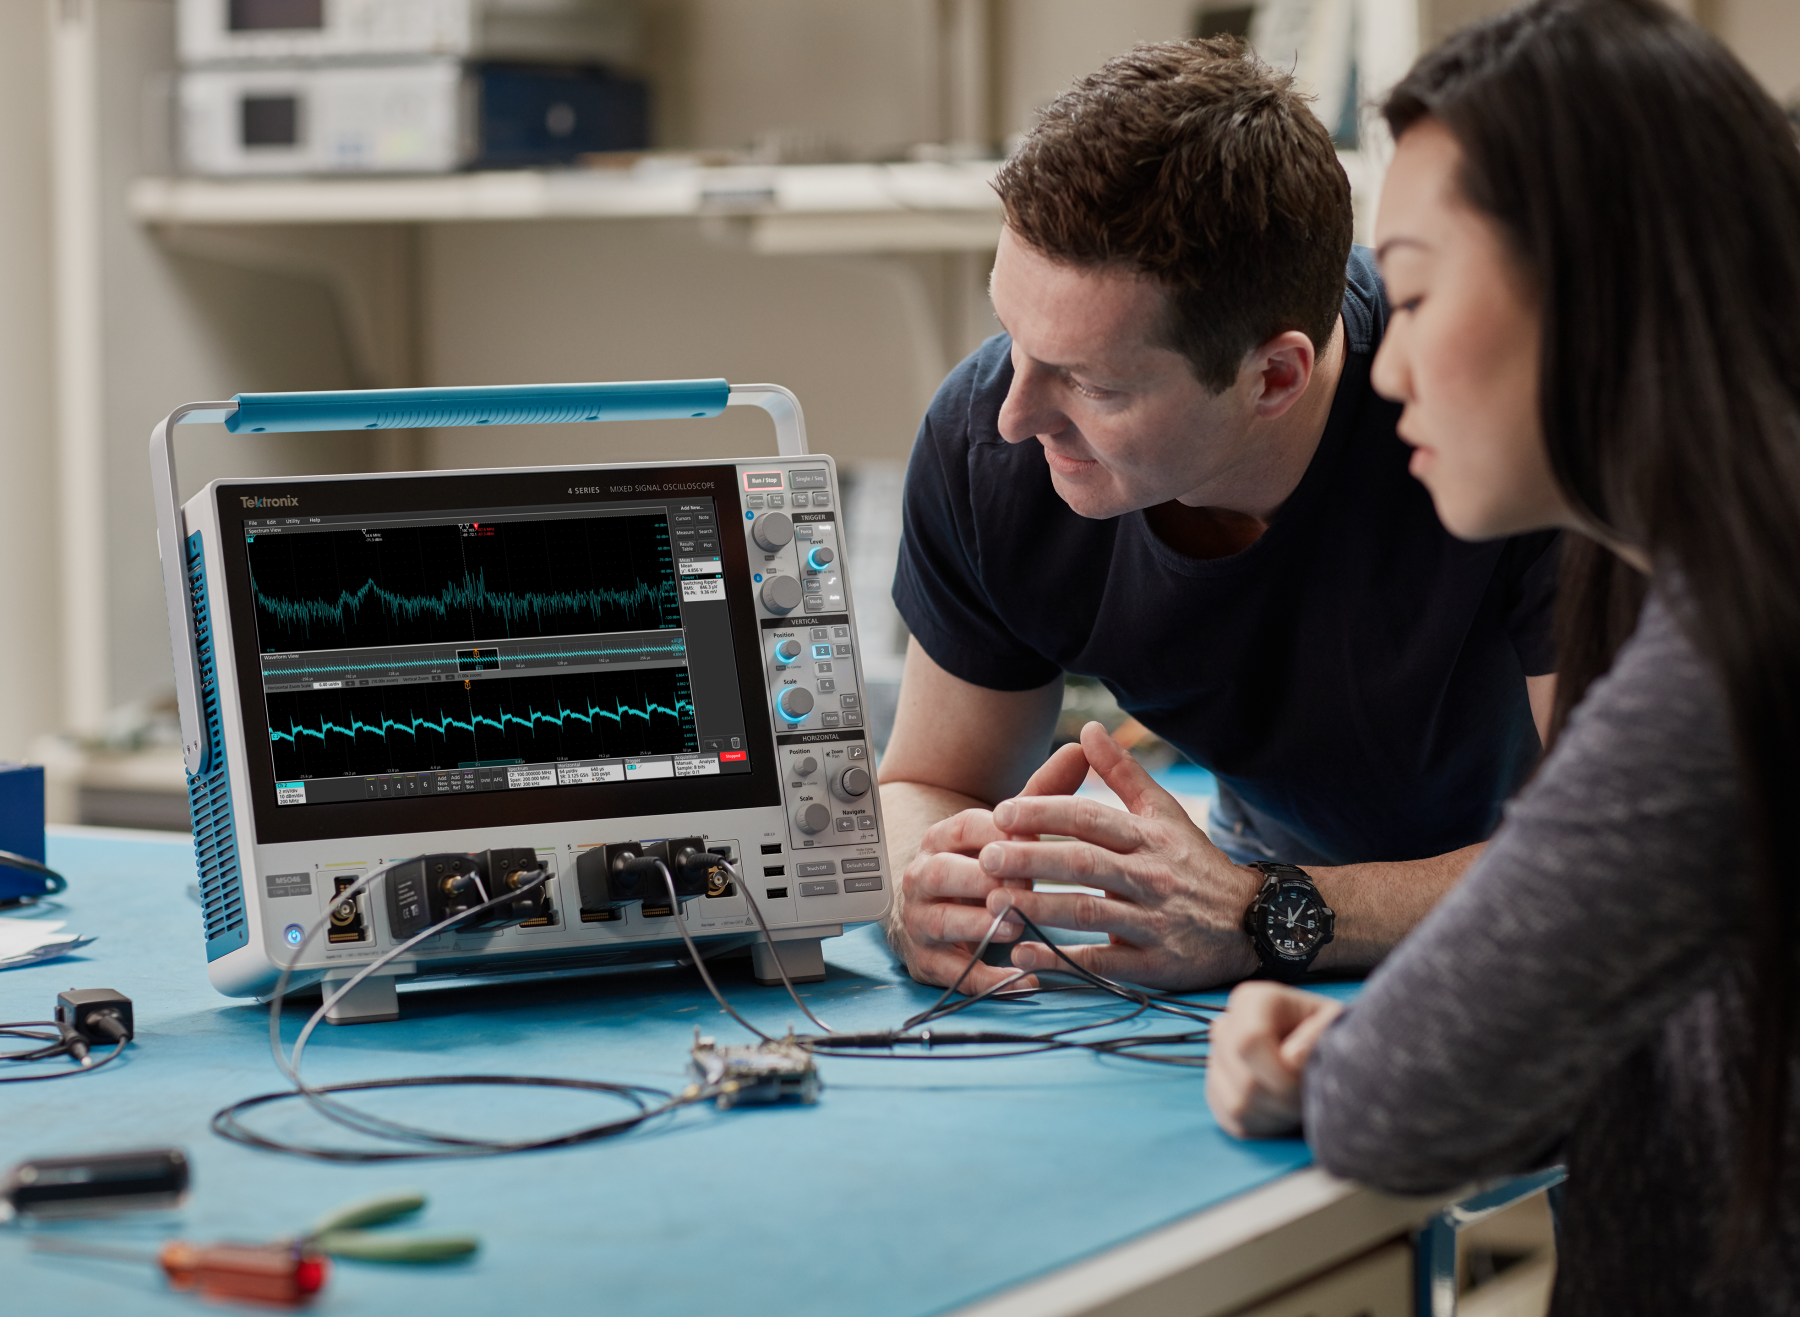
FlexChannel® technology enables maximum flexibility and broader system visibility
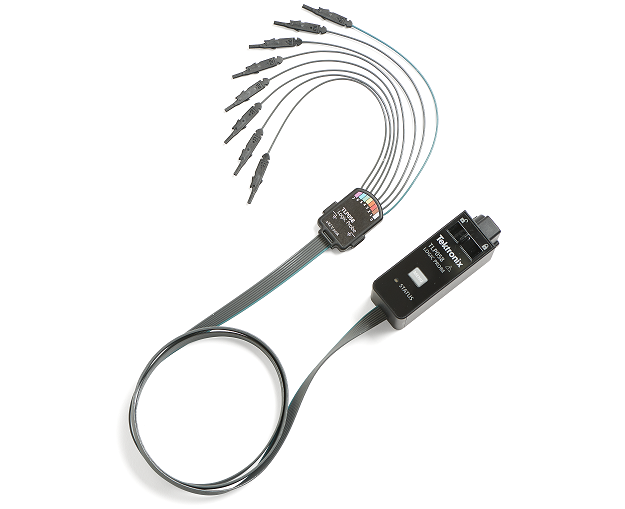
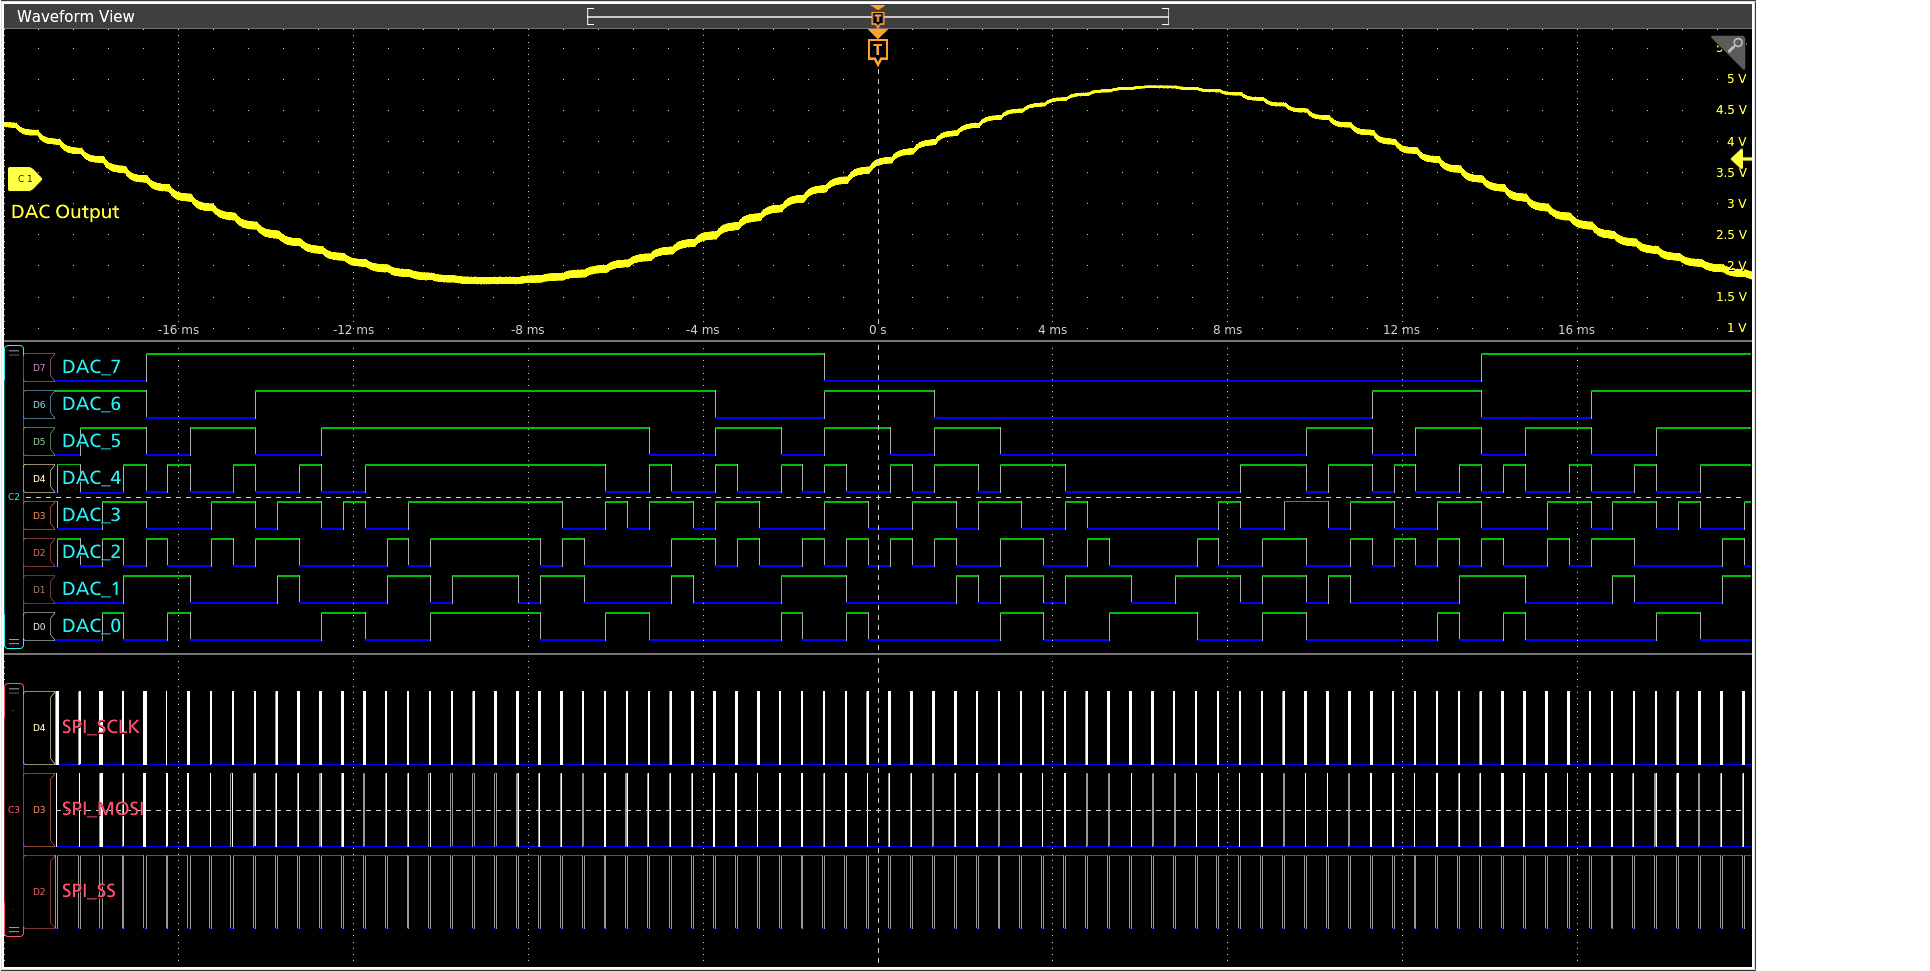
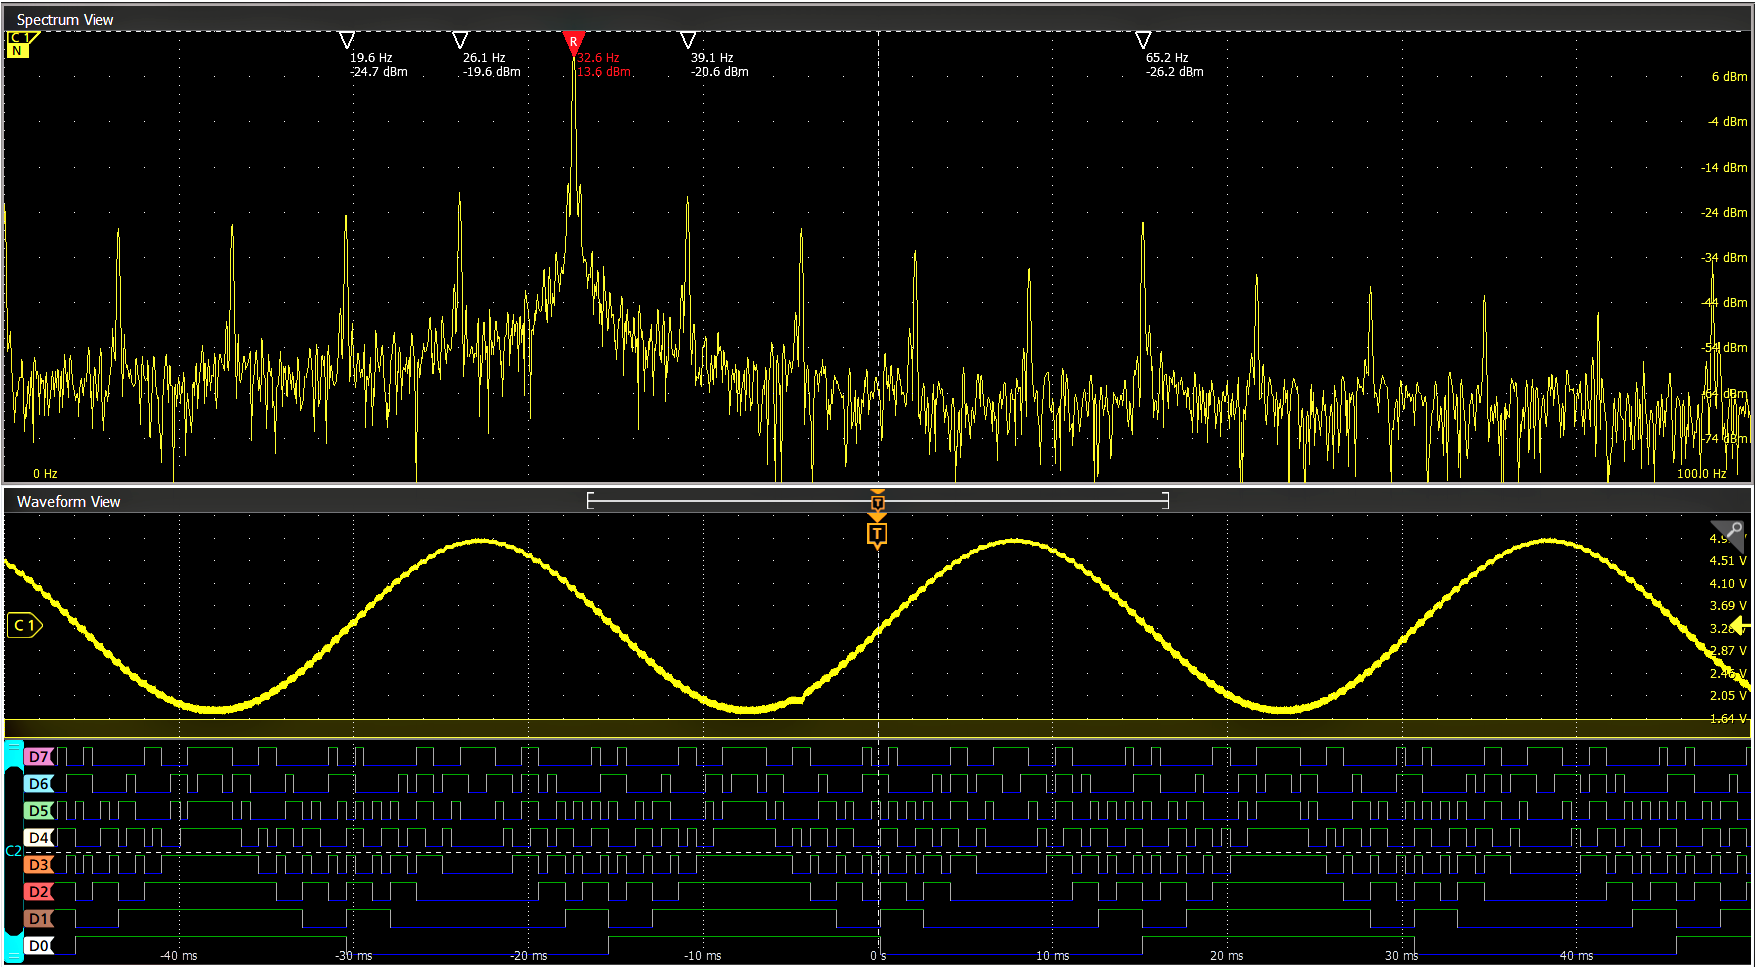
The 4 Series MSO redefines what a Mixed Signal Oscilloscope (MSO) should be. FlexChannel technology enables each channel input to be used as a single analog channel, eight digital logic inputs (with the TLP058 logic probe), or simultaneous analog and spectrum views with independent acquisition controls for each domain. Imagine the flexibility and configurability this provides.
With a six FlexChannel model, you can configure the instrument to look at six analog and zero digital signals. Or five analog and eight digital. Or four analog and 16 digital, three analog and 24 digital and so on. You can change the configuration at any time by simply adding or removing TLP058 logic probes, so you always have the right number of digital channels.
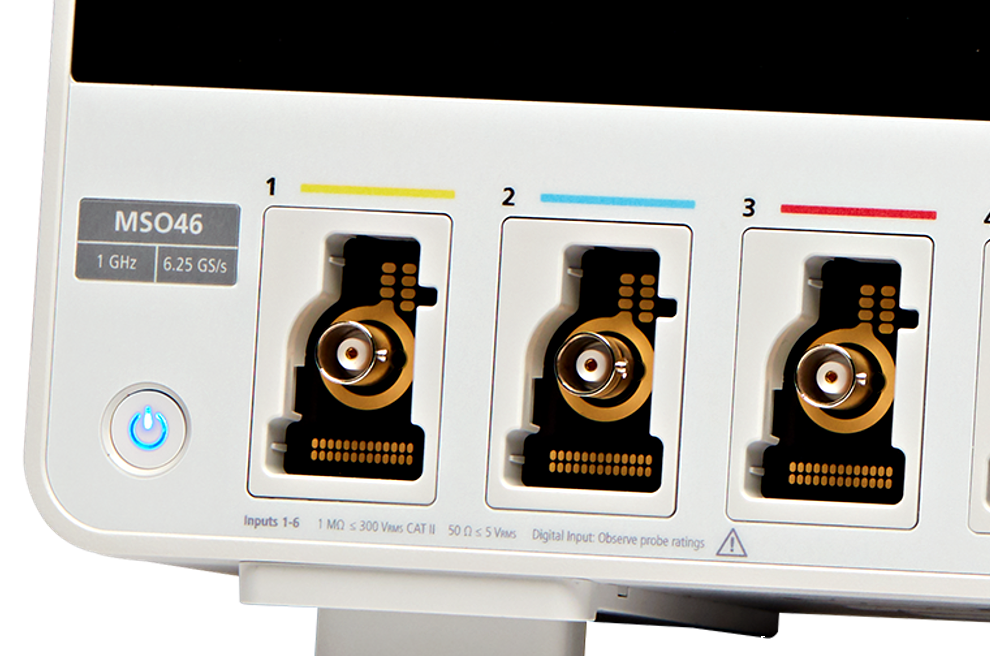
Previous-generation MSOs required tradeoffs, with digital channels having lower sample rates or shorter record lengths than analog channels. The 4 Series MSO offers a new level of integration of digital channels. Digital channels share the same high sample rate (up to 6.25 GS/s), and long record length (up to 62.5M points) as analog channels.
Unprecedented signal viewing capability
The stunning 13.3inch (338 mm) display is the largest display in its class. It is also the highest resolution display, with full HD resolution (1,920 x 1,080), enabling you to see many signals at once with ample room for critical readouts and analysis.
The viewing area is optimized to ensure that the maximum vertical space is available for waveforms. The Results Bar on the right can be hidden, enabling the waveform view to use the full width of the display.
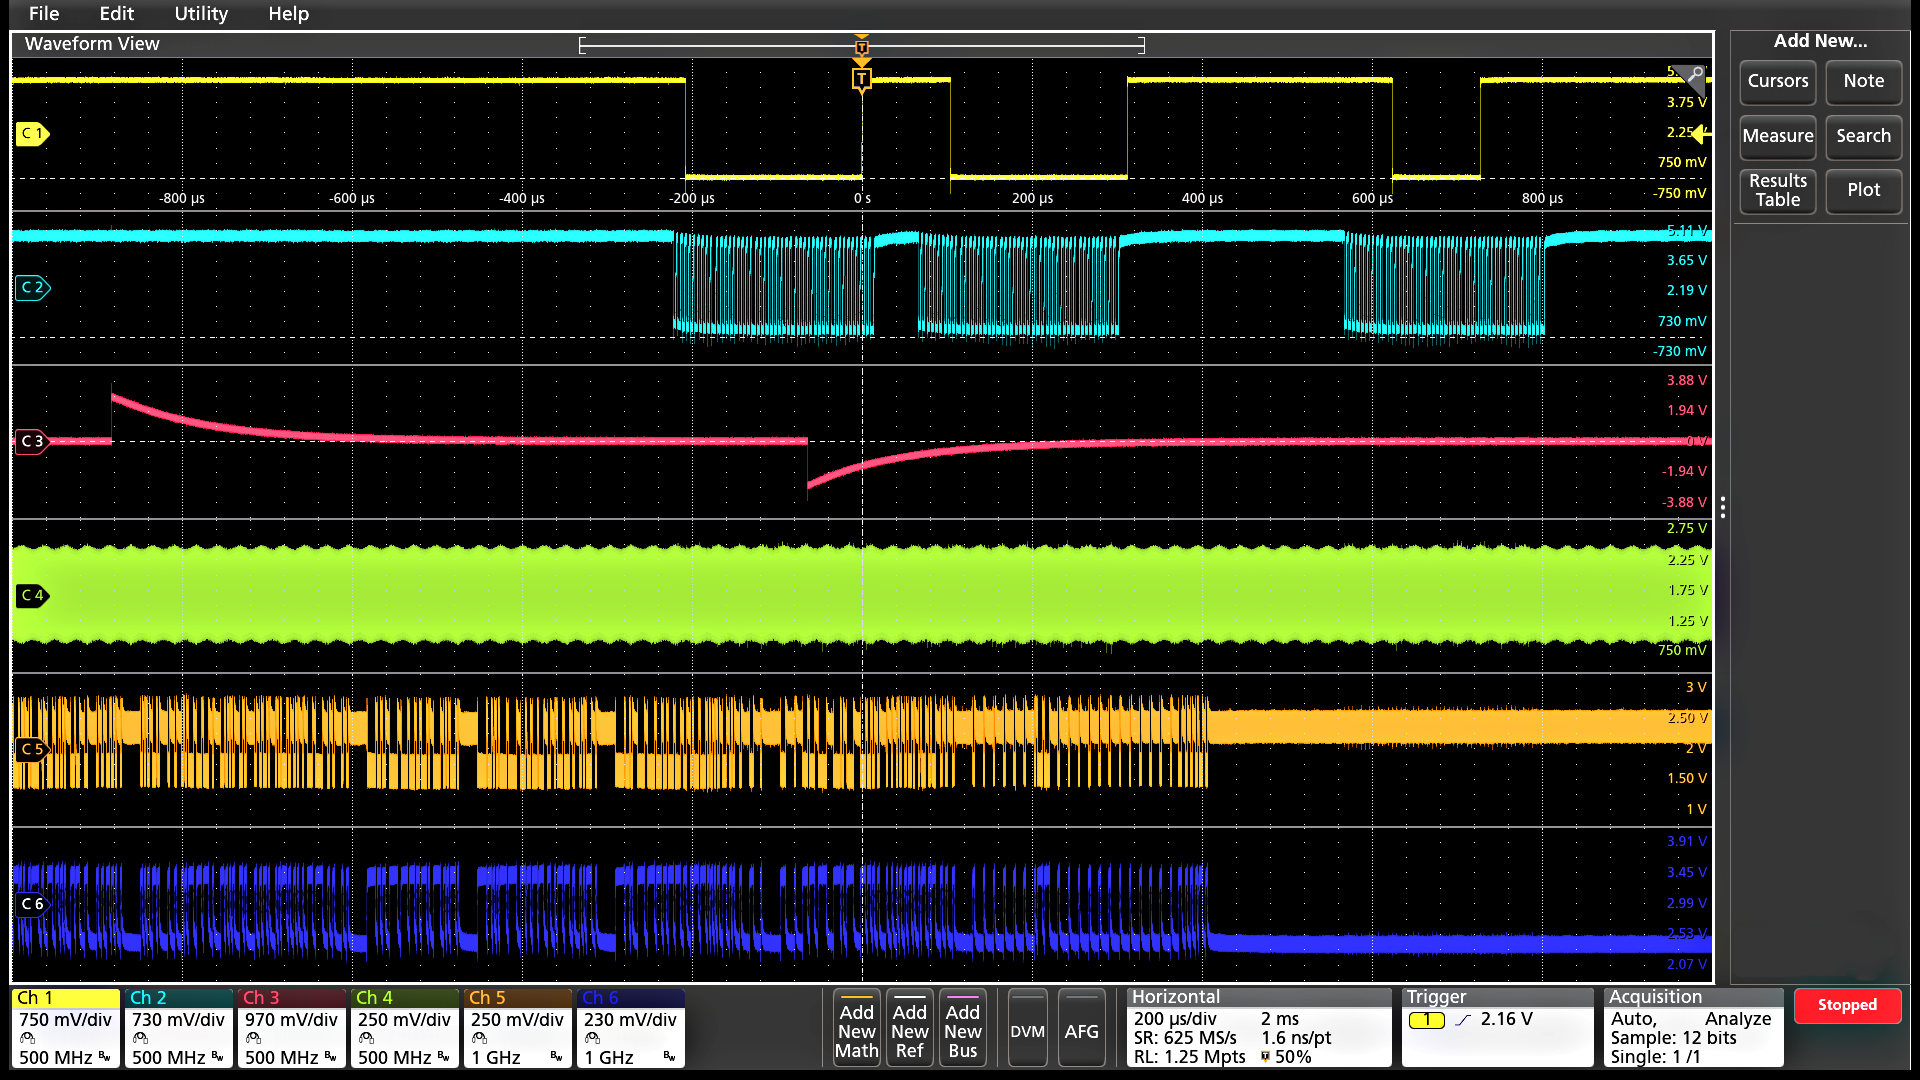
The 4 Series MSO offers a revolutionary new Stacked display mode. Historically, scopes have overlaid all waveforms in the same graticule, forcing difficult tradeoffs:
To make each waveform visible, you vertically scale and position each waveform so that they don't overlap. Each waveform uses a small percentage of the available ADC range, leading to less accurate measurements.
For measurement accuracy, you vertically scale and position each waveform to cover the entire display. The waveforms overlap each other, making it hard to distinguish signal details on individual waveforms
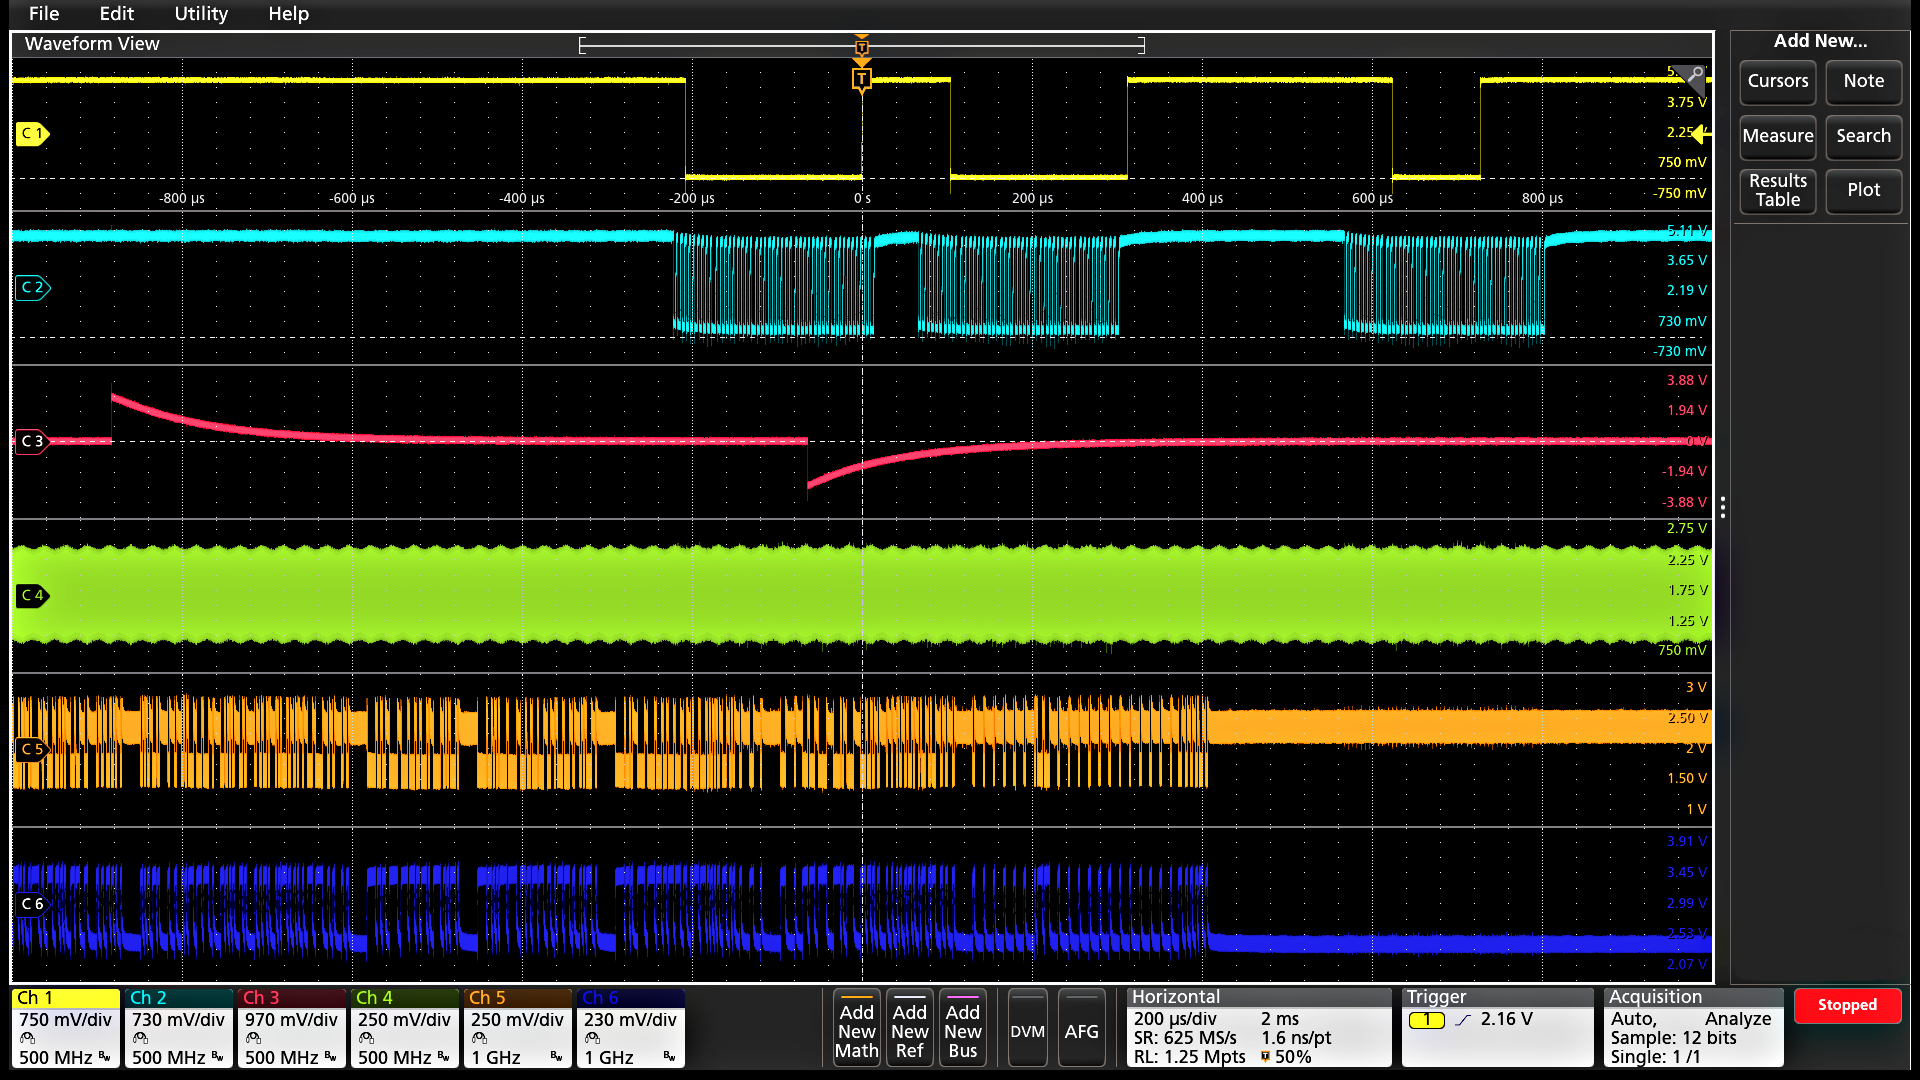
The new Stacked display eliminates this tradeoff. It automatically adds and removes additional horizontal waveform 'slices' (additional graticules) as waveforms are created and removed. Each slice represents the full ADC range for the waveform. All waveforms are visually separated from each other while still using the full ADC range, enabling maximum visibility and accuracy. And it's all done automatically as waveforms are added or removed! Channels can easily be reordered in stacked display mode by dragging and dropping the channel and waveform badges in the Settings bar at the bottom of the display. Groups of channels can also be overlaid within a slice to simplify visual comparison of signals.
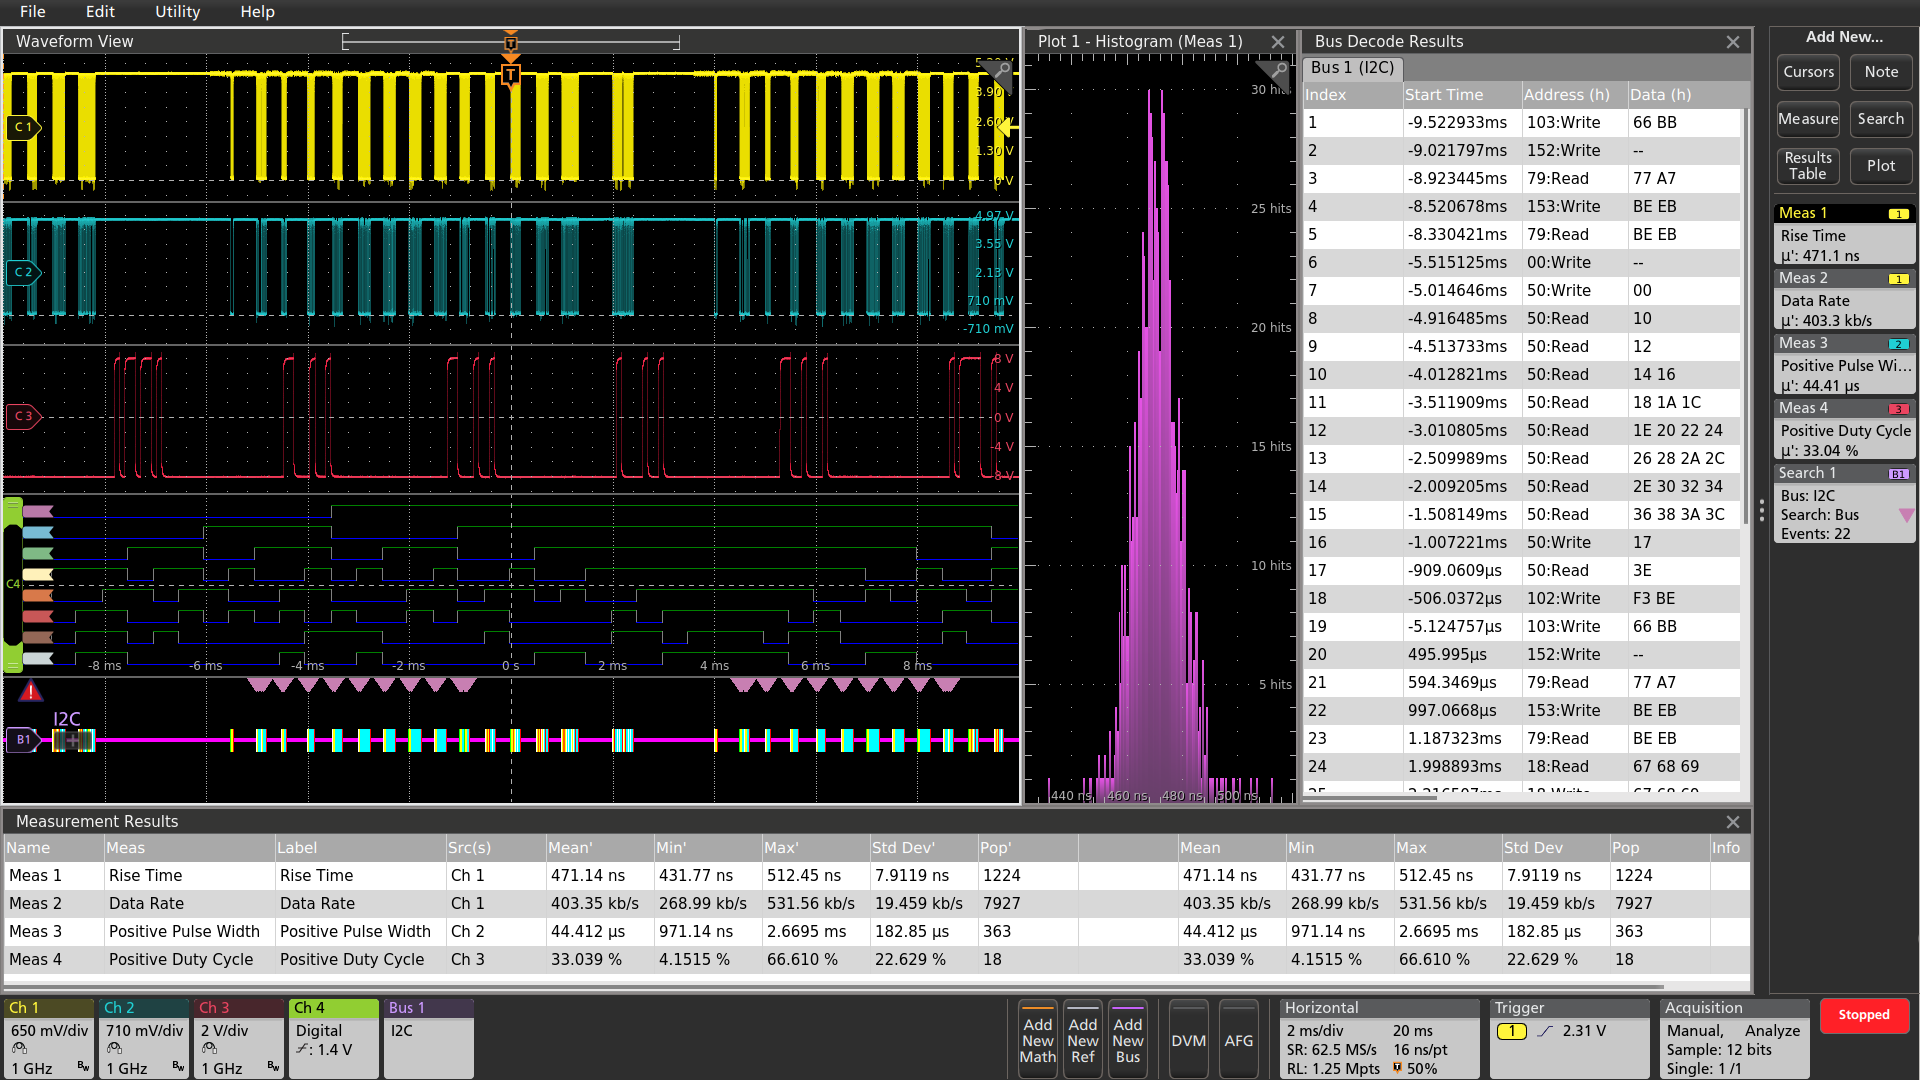
The large display also provides plenty of viewing area not only for signals, but also for plots, measurement results tables, bus decode tables and more. You can easily resize and relocate the various views to suit your application.
Exceptionally easy-to-use user interface lets you focus on the task at hand
The Settings Bar - key parameters and waveform management
Waveform and scope operating parameters are displayed in a series of “badges” in the Settings Bar that runs along the bottom of the display. The Settings Bar provides Immediate access for the most common waveform management tasks. With a single tap, you can:
- Turn on channels
- Add math waveforms
- Add reference waveforms
- Add bus waveforms
- Enable the optional integrated Arbitrary/Function generator (AFG)
- Enable the optional integrated digital voltmeter (DVM)
The Results Bar - analysis and measurements
The Results Bar on the right side of the display includes immediate, one-tap access to the most common analytical tools such as cursors, measurements, searches, measurement and bus decode results tables, plots, and notes.
DVM, measurement and search results badges are displayed in the Results Bar without sacrificing any waveform viewing area. For additional waveform viewing area, the Results Bar can be dismissed and brought back at any time.
Touch interaction finally done right
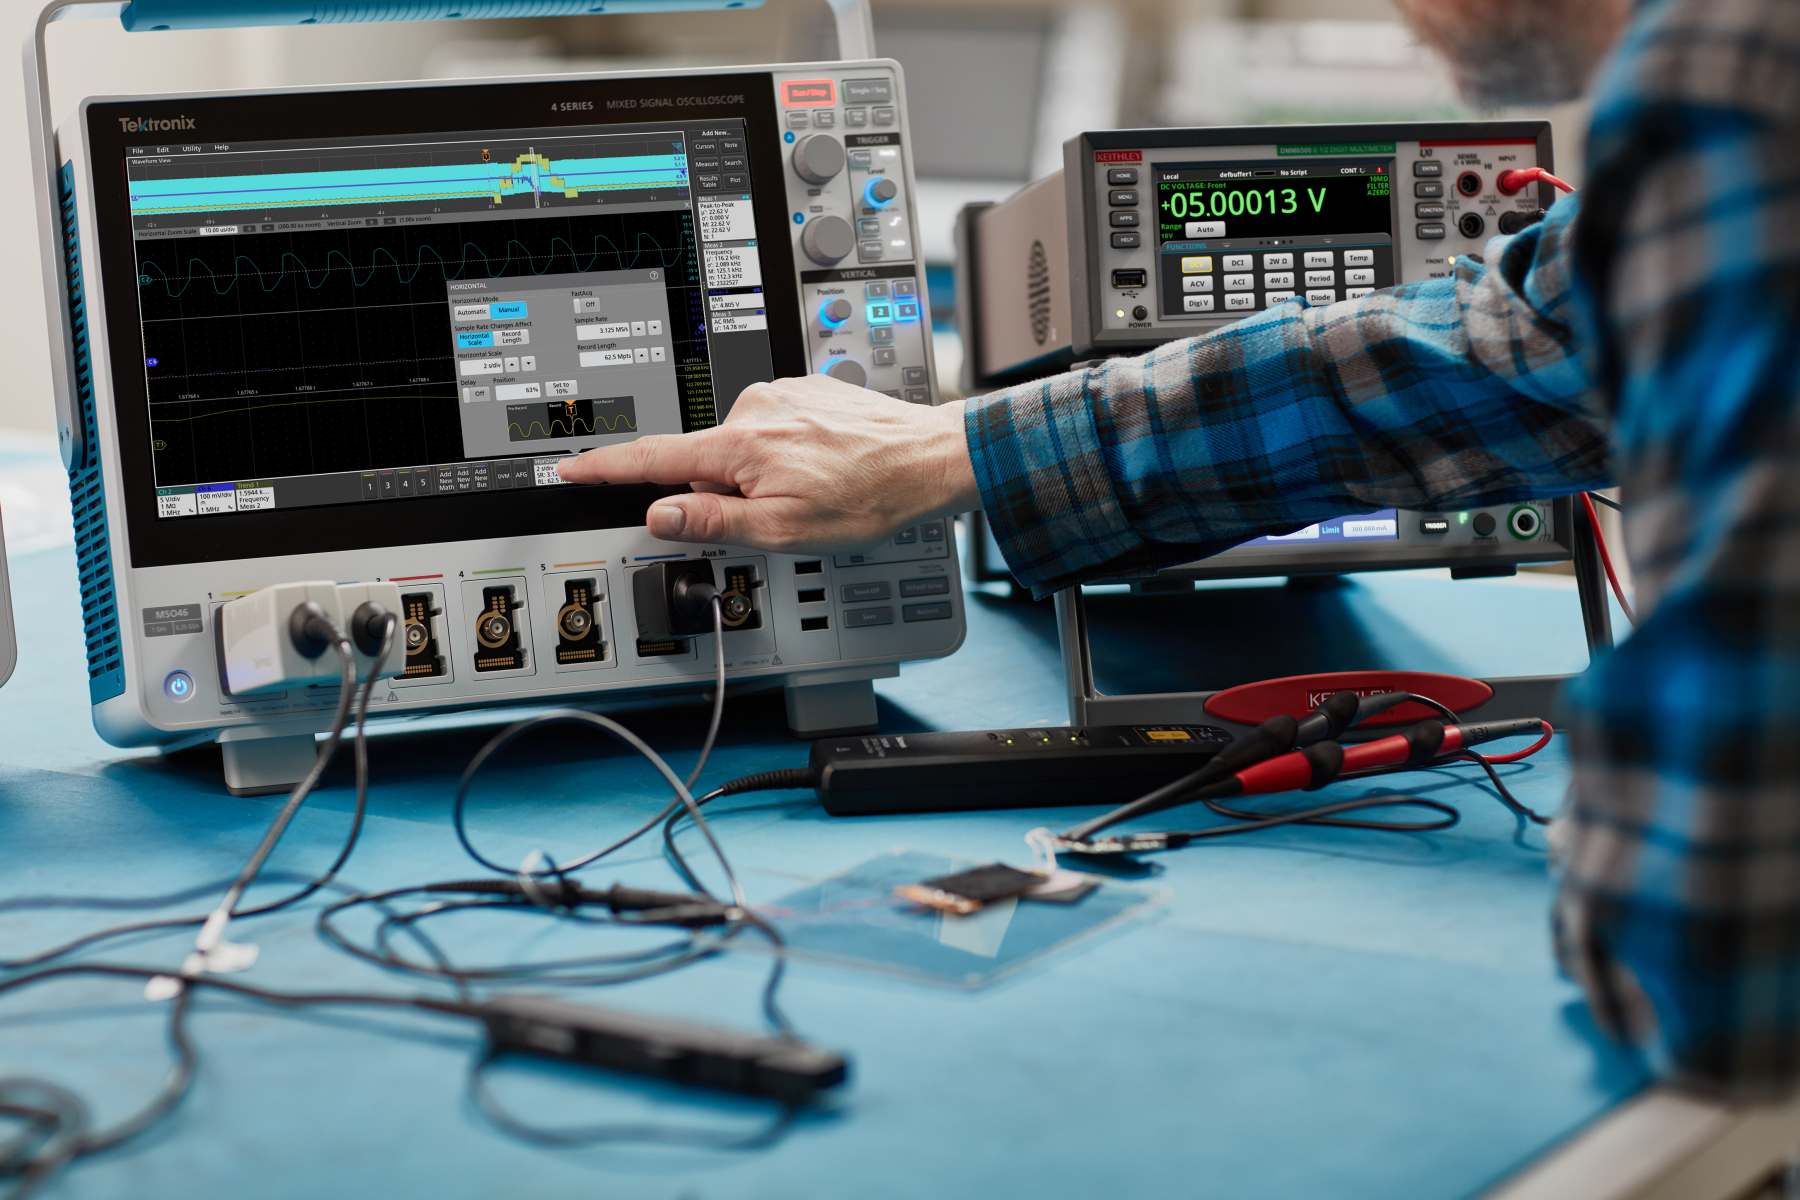
Oscilloscopes have included touch screens for years, but the touch interface has been an afterthought. The 4 Series MSO display includes a capacitive touchscreen and provides the industry's first oscilloscope user interface truly designed for touch.
The touch interactions that you use with phones and tablets, and expect in a touch enabled device, are supported.
- Drag waveforms left/right or up/down to adjust horizontal and vertical position or to pan a zoomed view
- Pinch and expand to change scale or zoom in/out in either horizontal or vertical directions
- Drag items off the edge of the screen to delete them
- Swipe in from the right to reveal the Results Bar or down from the top to access the menus in the upper left corner of the display
Smooth, responsive front panel controls allow you to make adjustments with familiar knobs and buttons, and you can add a mouse or keyboard as a third interaction method.
Variable font size
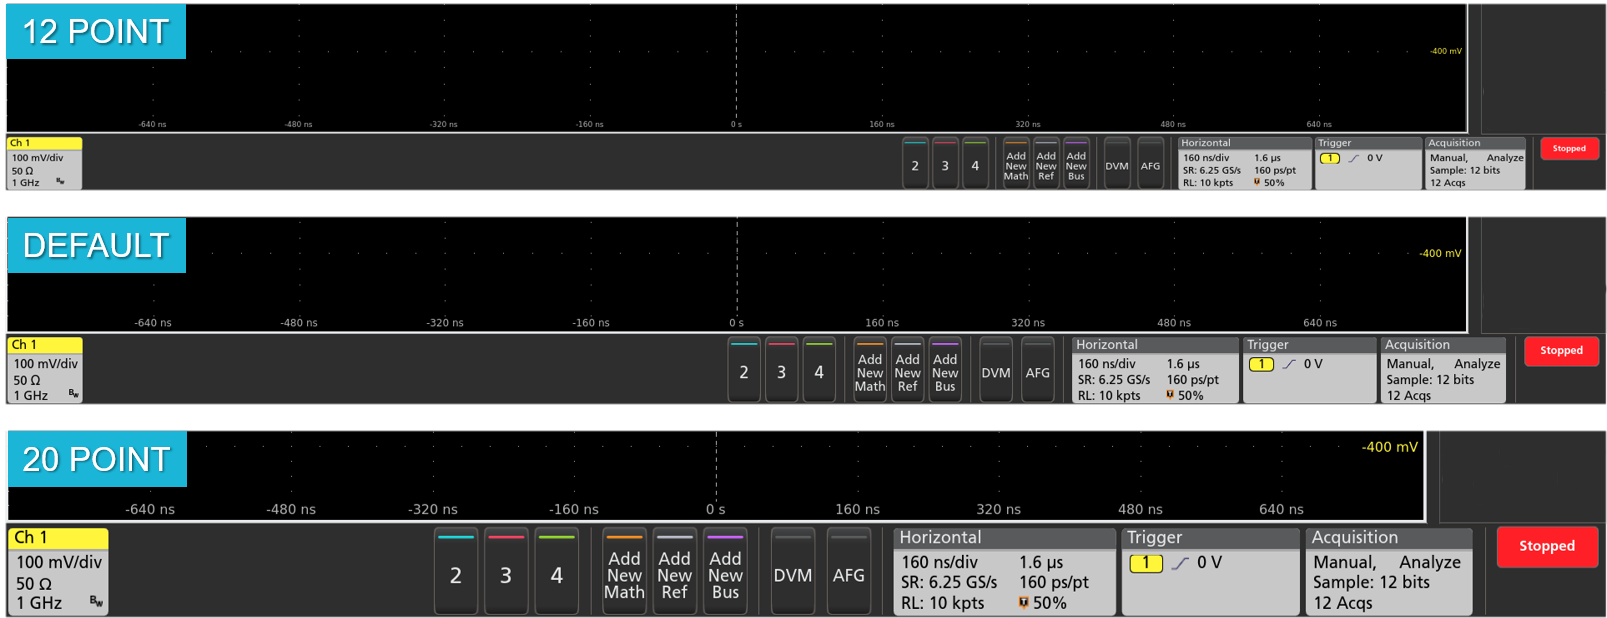
Historically, oscilloscope user interfaces have been designed with fixed font sizes to optimize viewing of waveforms and readouts. This implementation is fine if all users have the same viewing preferences, but they don't. Users spend a significant amount of time staring at screens, and Tektronix recognizes this. The 4 Series MSO offers a user preference for variable font sizes; scaling down to 12 points or up to 20 points. As you adjust the font size, the user interface dynamically scales so you can easily choose the best size for your application.
Attention to detail in the front-panel controls
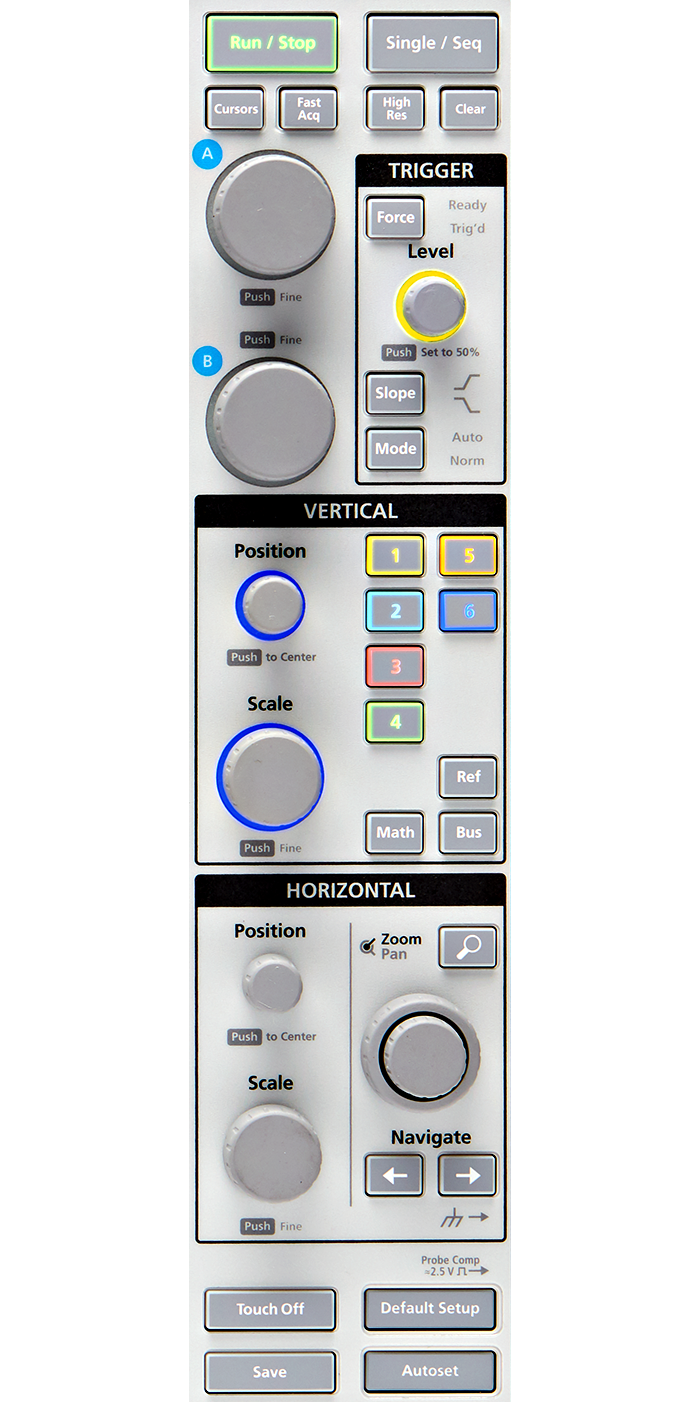
Traditionally, the front face of a scope has been roughly 50% display and 50% controls. The 4 Series MSO display fills about 75% of the face of the instrument. To achieve this, it has a streamlined front panel that retains critical controls for simple intuitive operation, but with a reduced number of menu buttons for functions directly accessed via objects on the display.
Color-coded LED light rings indicate trigger source and vertical scale/position knob assignments. Large, dedicated Run/Stop and Single Sequence buttons are placed prominently in the upper right, and other functions like Force Trigger, Trigger Slope, Trigger Mode, Default Setup, Autoset and Quick-save functions are all available using dedicated front panel buttons.
Experience the performance difference
Digital Phosphor technology with FastAcq™ high-speed waveform capture
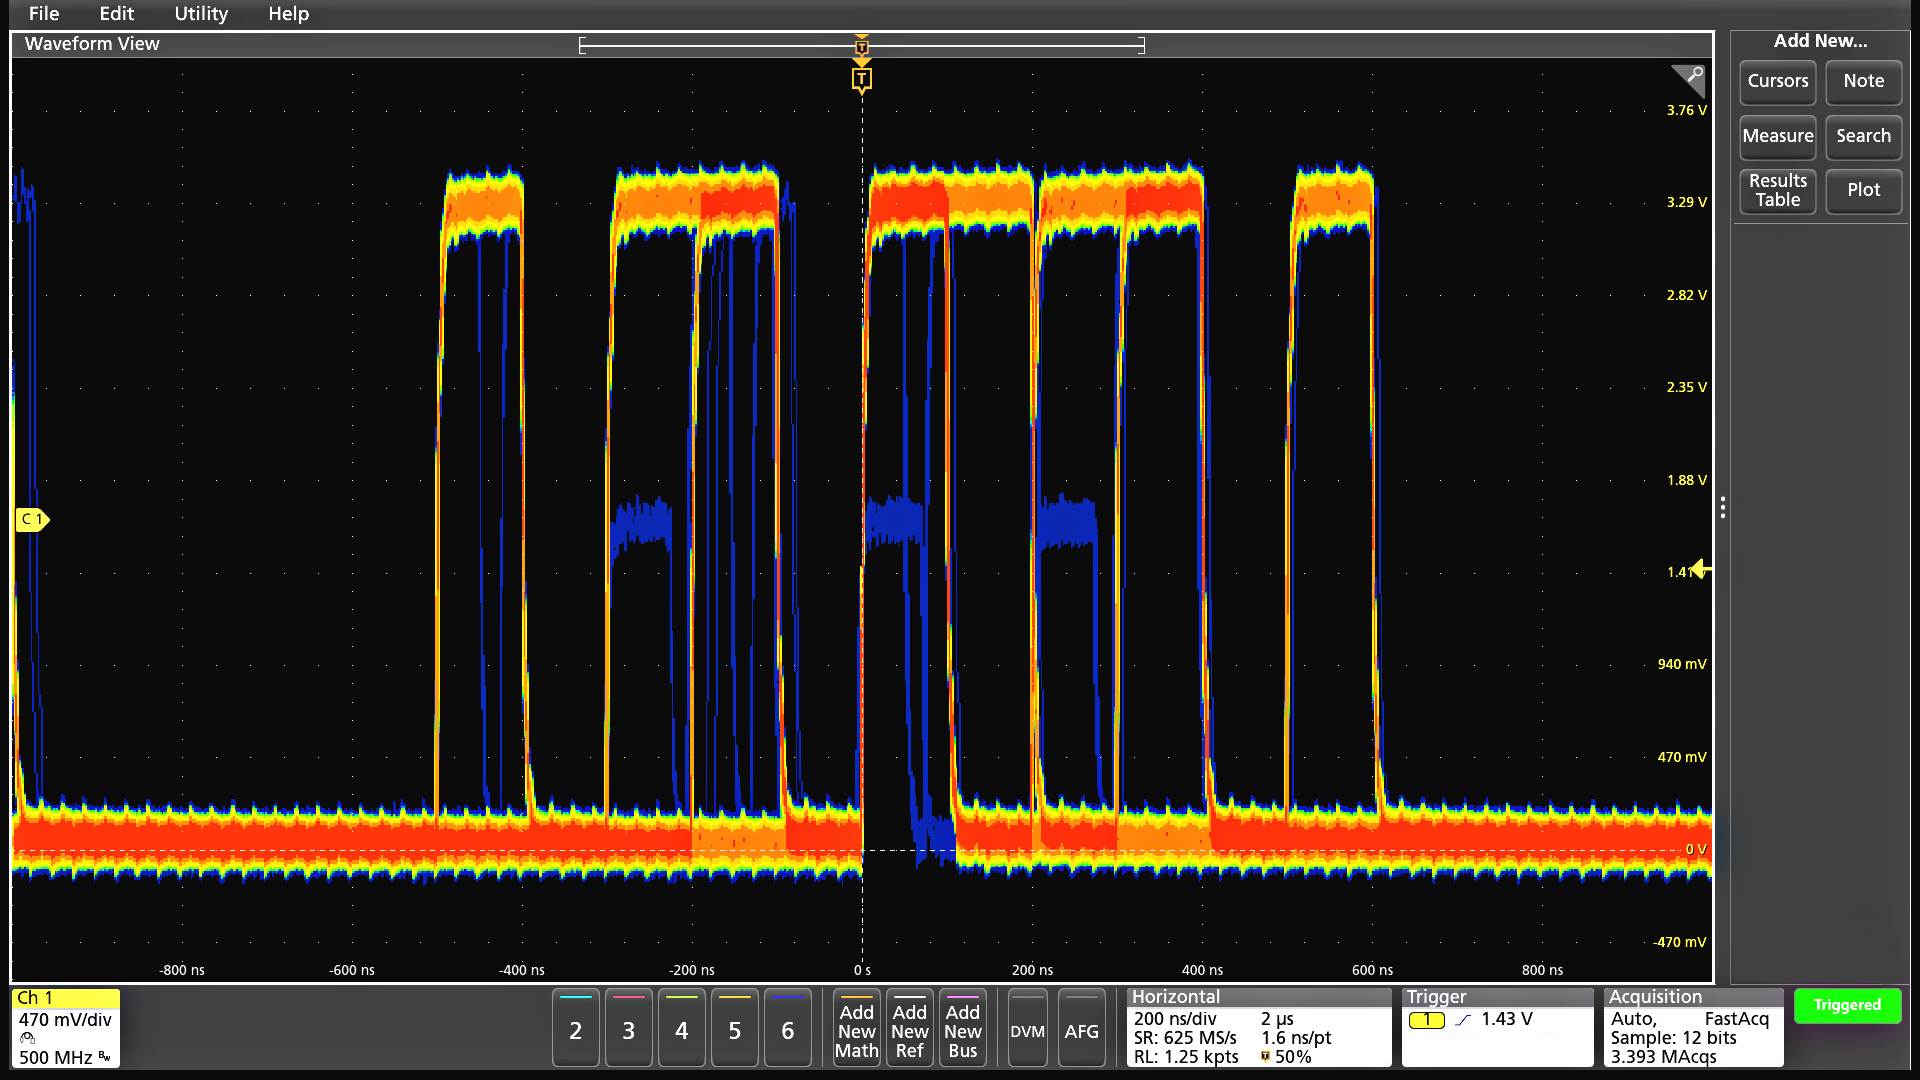
To debug a design problem, first you must know it exists. Digital phosphor technology with FastAcq provides you with fast insight into the real operation of your device. Its fast waveform capture rate - greater than 500,000 waveforms per second - gives you a high probability of seeing the infrequent problems common in digital systems: runt pulses, glitches, timing issues, and more. To further enhance the visibility of rarely occurring events, intensity grading indicates how often rare transients are occurring relative to normal signal characteristics.
Industry leading vertical resolution
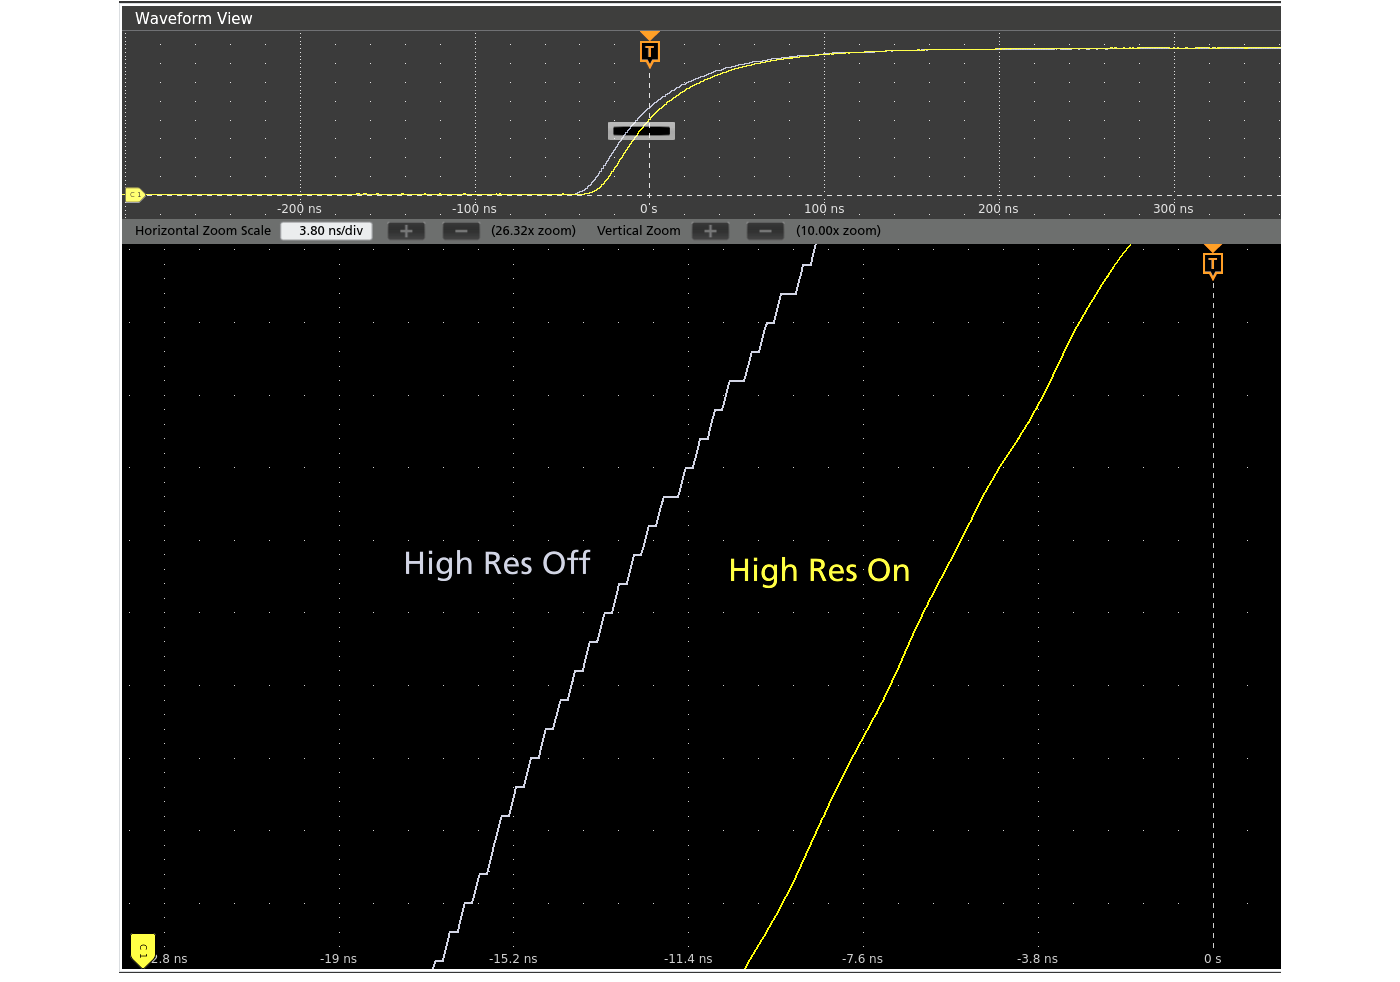
The 4 Series MSO provides the performance to capture the signals of interest while minimizing the effects of unwanted noise when you need to capture high-amplitude signals while seeing smaller signal details. At the heart of the instrument are 12-bit analog-to-digital converters (ADCs) that provide 16 times the vertical resolution of traditional 8-bit ADCs.
A new High Res mode applies a hardware-based unique Finite Impulse Response (FIR) filter based on the selected sample rate. The FIR filter maintains the maximum bandwidth possible for that sample rate while preventing aliasing and removing noise from the oscilloscope amplifiers and ADC above the usable bandwidth for the selected sample rate. High Res mode always provides at least 12 bits of vertical resolution and extends all the way to 16 bits of vertical resolution at ≤125 MS/s sample rates.
New lower-noise front end amplifiers further improve your ability to resolve fine signal detail.
Triggering
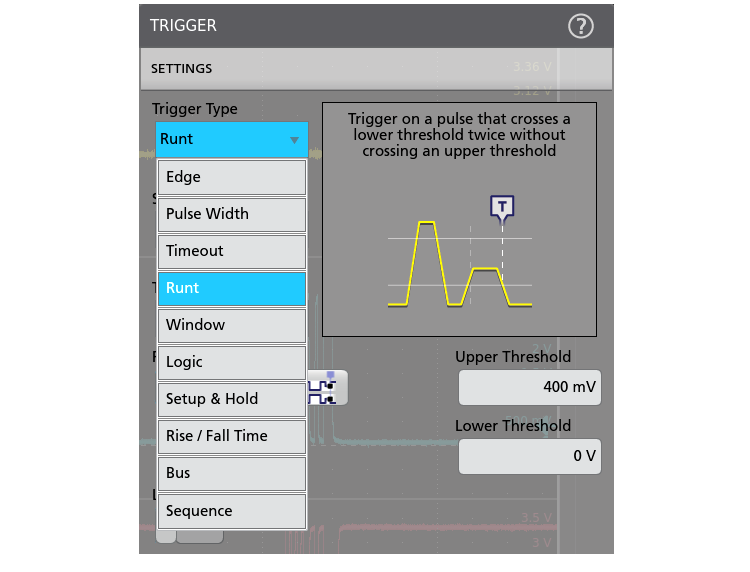
Discovering a device fault is only the first step. Next, you must capture the event of interest to identify root cause. The 4 Series MSO provides a complete set of advanced triggers, including:
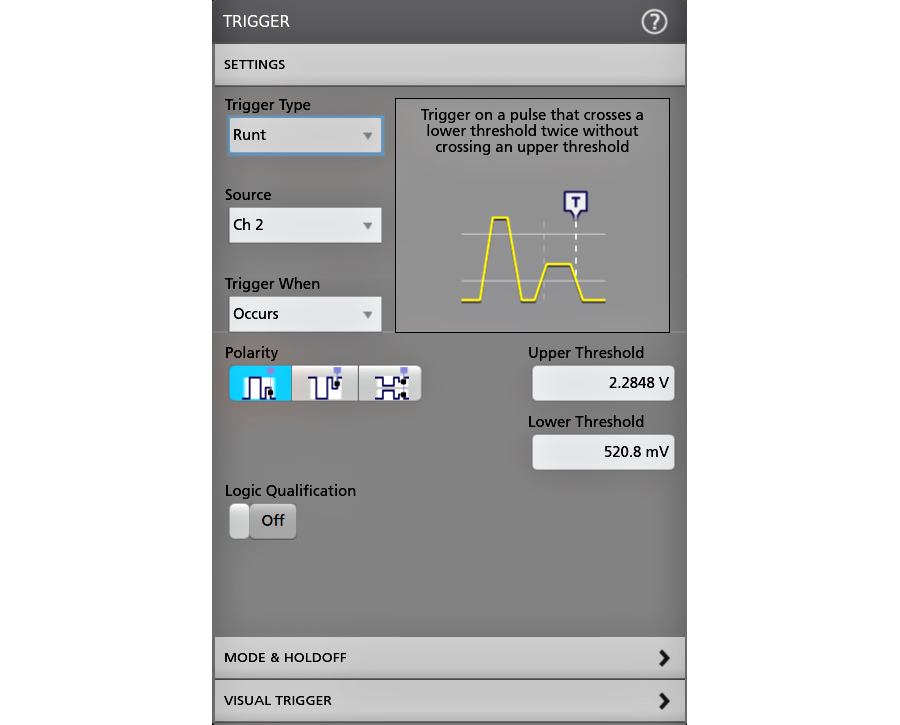
- Runt
- Logic
- Pulse width
- Window
- Timeout
- Rise/Fall time
- Setup and Hold violation
- Serial packet
- Parallel data
- Sequence
- Video
- Visual Trigger
- RF vs. Time (optional)
With up to a 62.5 Mpoint record length, you can capture many events of interest, even thousands of serial packets in a single acquisition, providing high-resolution to zoom in on fine signal details and record reliable measurements.
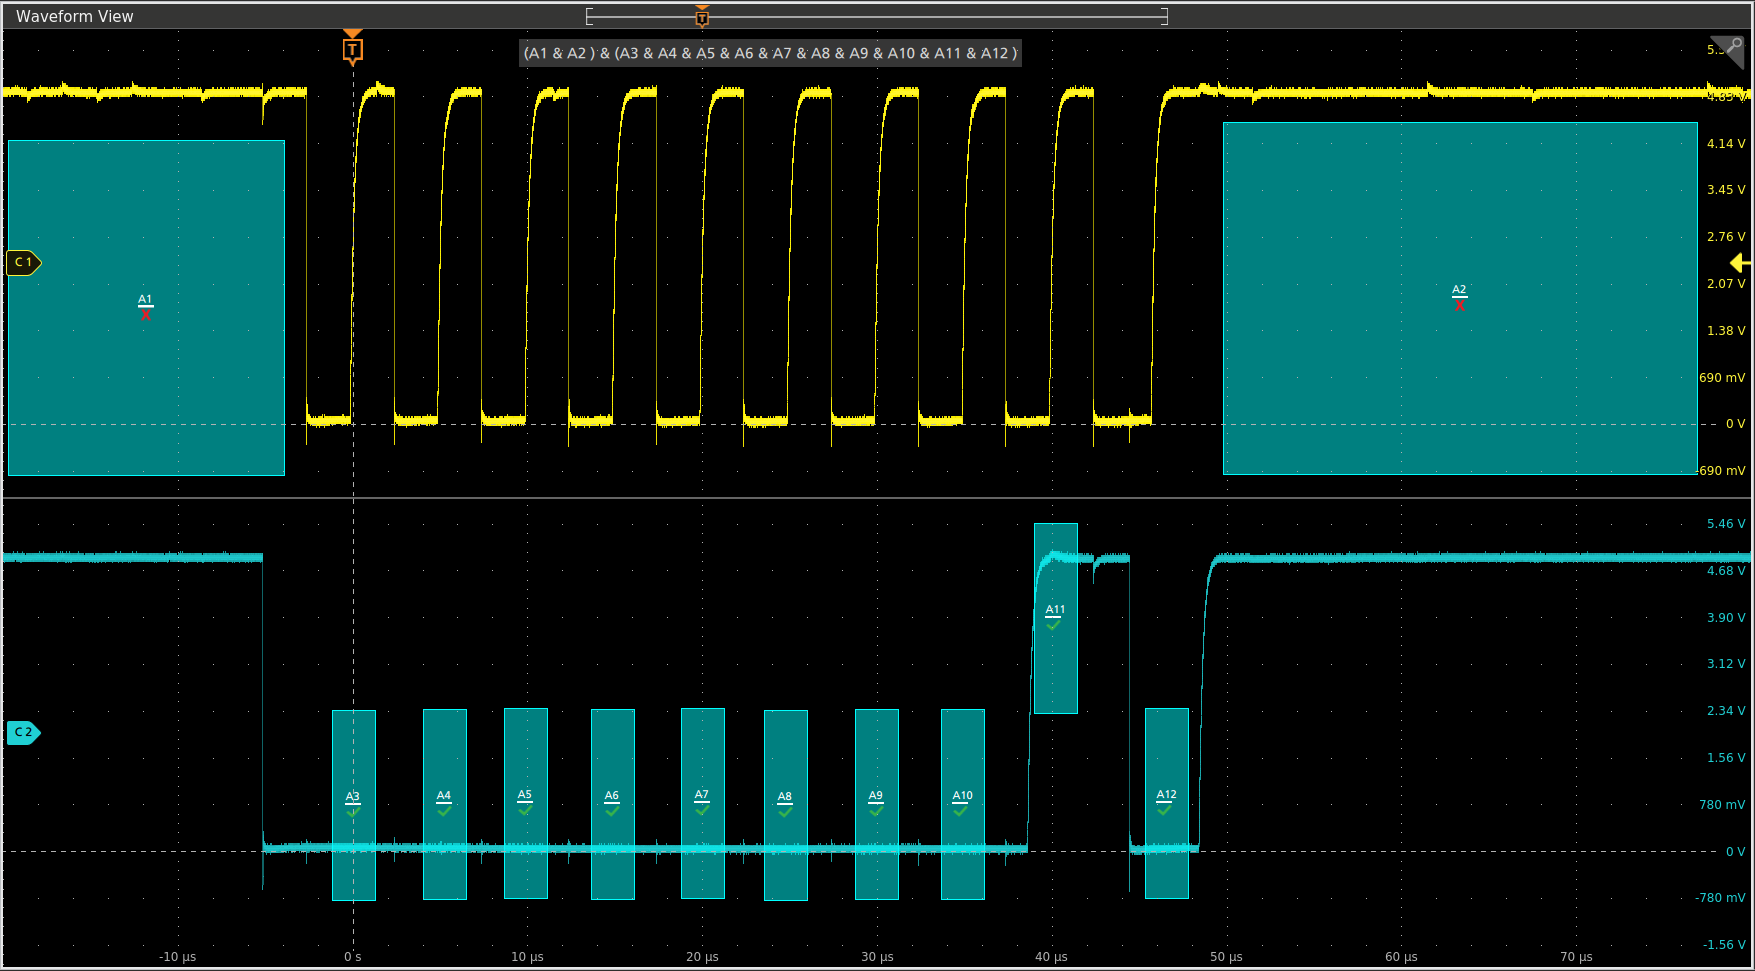
Visual Trigger - finding the signal of interest quickly
Finding the right cycle of a complex bus can require hours of collecting and sorting through thousands of acquisitions for an event of interest. Defining a trigger that isolates the desired event speeds up debug and analysis efforts.
Visual Trigger extends the instrument's triggering capabilities by scanning through all waveform acquisitions and comparing them to on-screen areas (geometric shapes). You can create an unlimited number of areas using the mouse or touchscreen, and a variety of shapes (triangles, rectangles, hexagons, or trapezoids) can be used to specify the desired trigger behavior. Once shapes are created, they can be edited interactively to create custom shapes and ideal trigger conditions. Once multiple areas are defined, a Boolean logic equation can be used to set complex trigger conditions using on-screen editing features.
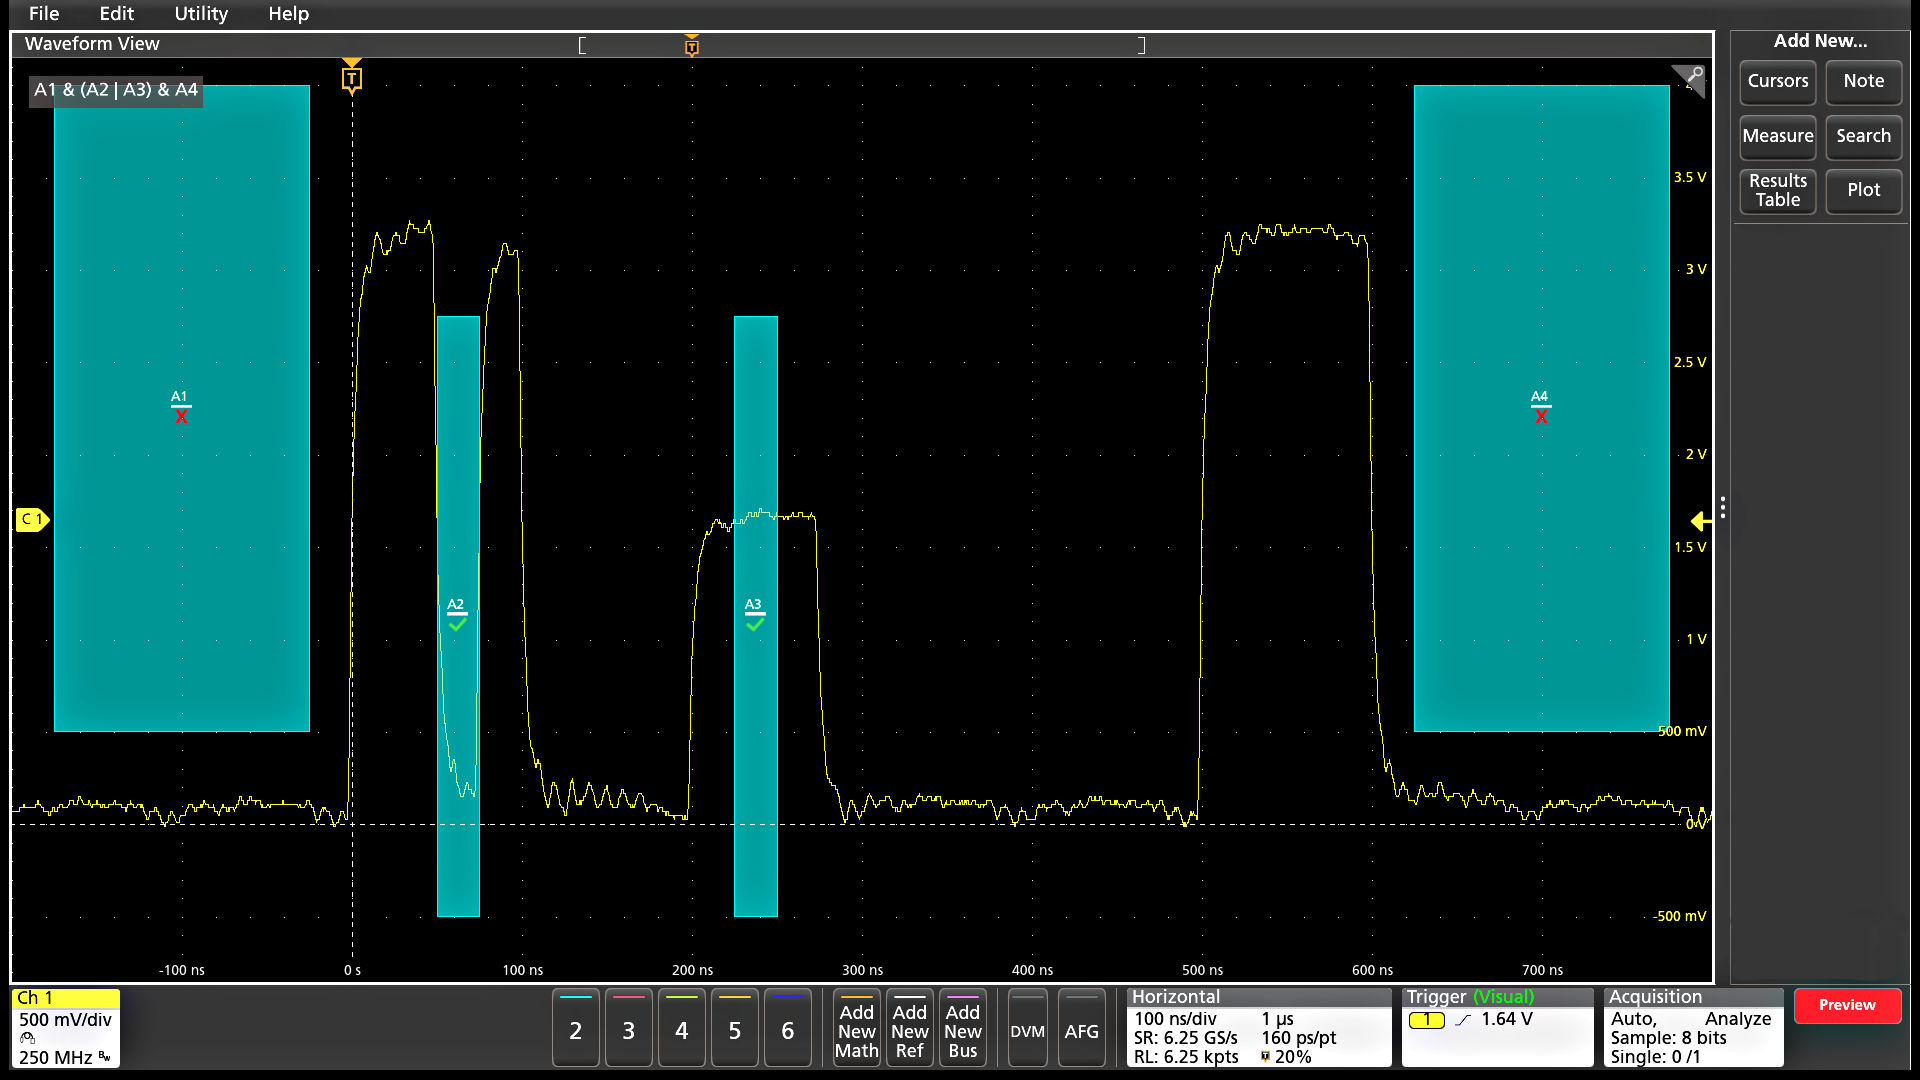
By triggering only on the most important signal events, Visual Trigger can save hours of capturing and manually searching through acquisitions. In seconds or minutes, you can find the critical events and complete your debug and analysis efforts. Visual Trigger even works across multiple channels, extending its usefulness to complex system troubleshooting and debug tasks.
Accurate high-speed probing
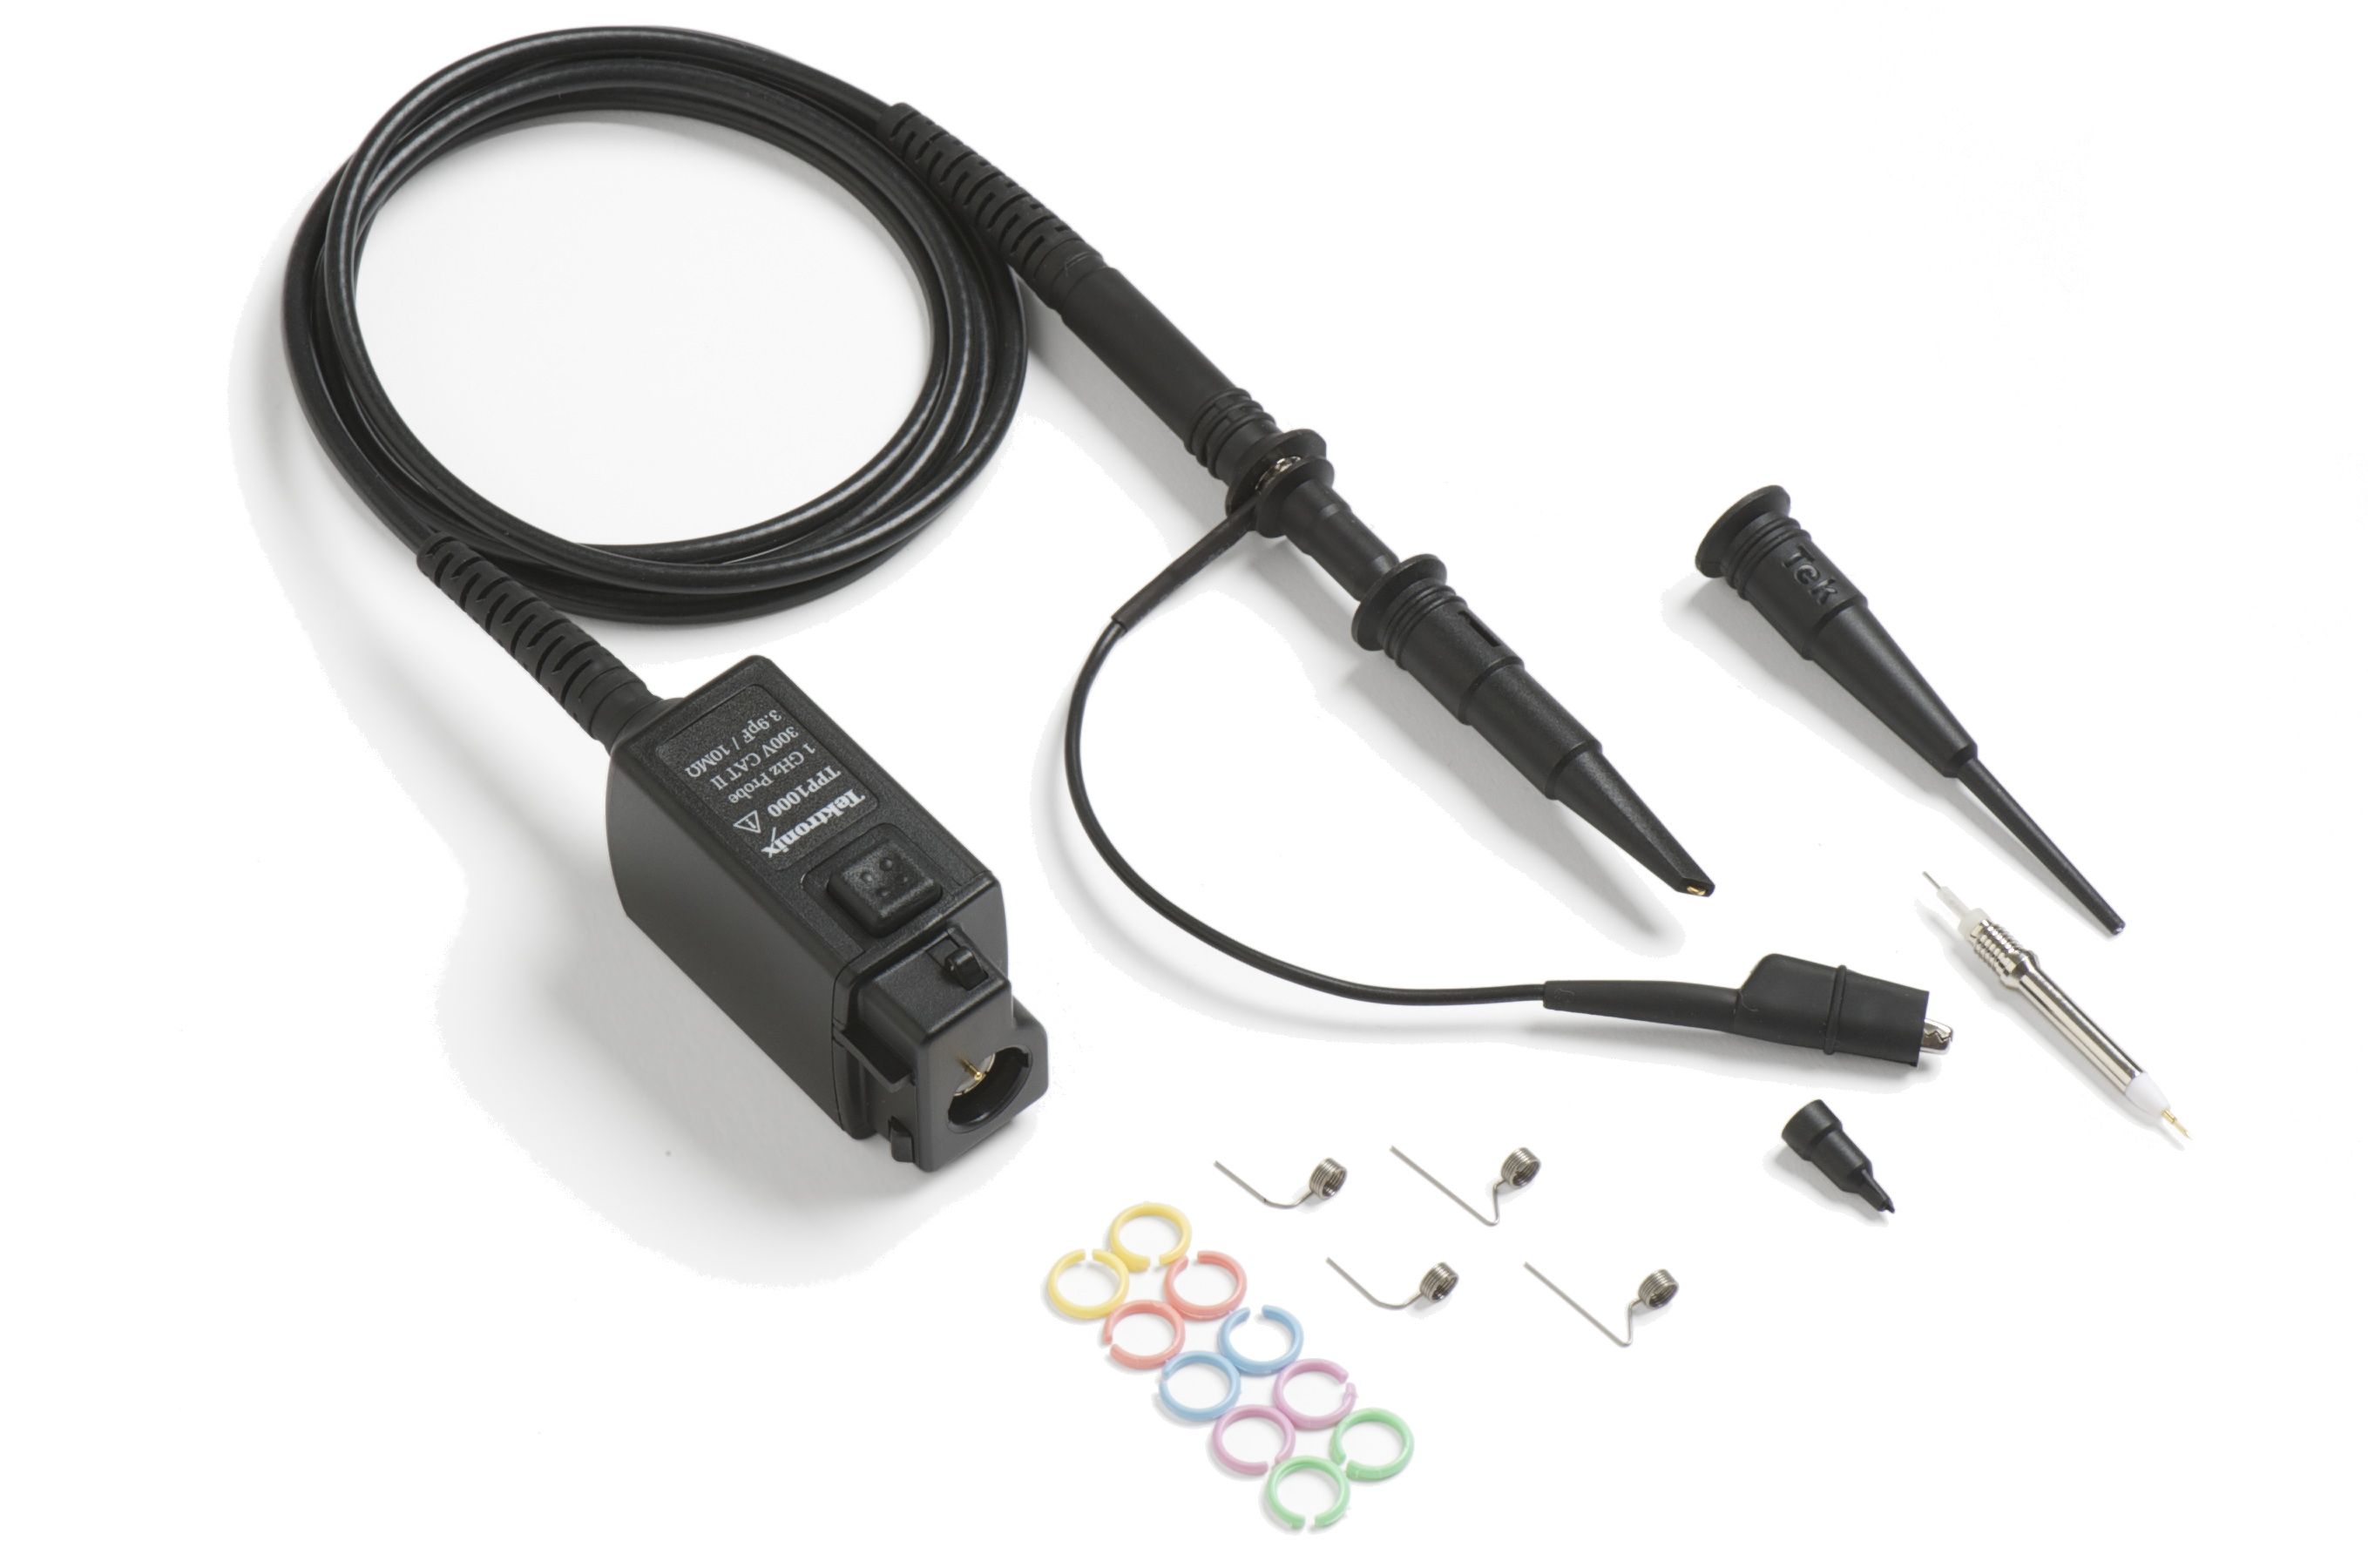
The TPP Series passive voltage probes offer all the benefits of general-purpose probes - high dynamic range, flexible connection options, and robust mechanical design - while providing the performance of active probes. Up to 1 GHz analog bandwidth enables you to see high frequency components in your signals, and extremely low 3.9 pF capacitive loading minimizes adverse effects on your circuits and is more forgiving of longer ground leads.
An optional, low-attenuation (2X) version of the TPP probe is available for measuring low voltages. Unlike other low-attenuation passive probes, the TPP0502 has high bandwidth (500 MHz) as well as low capacitive loading (12.7 pF).
TekVPI Probe Interface
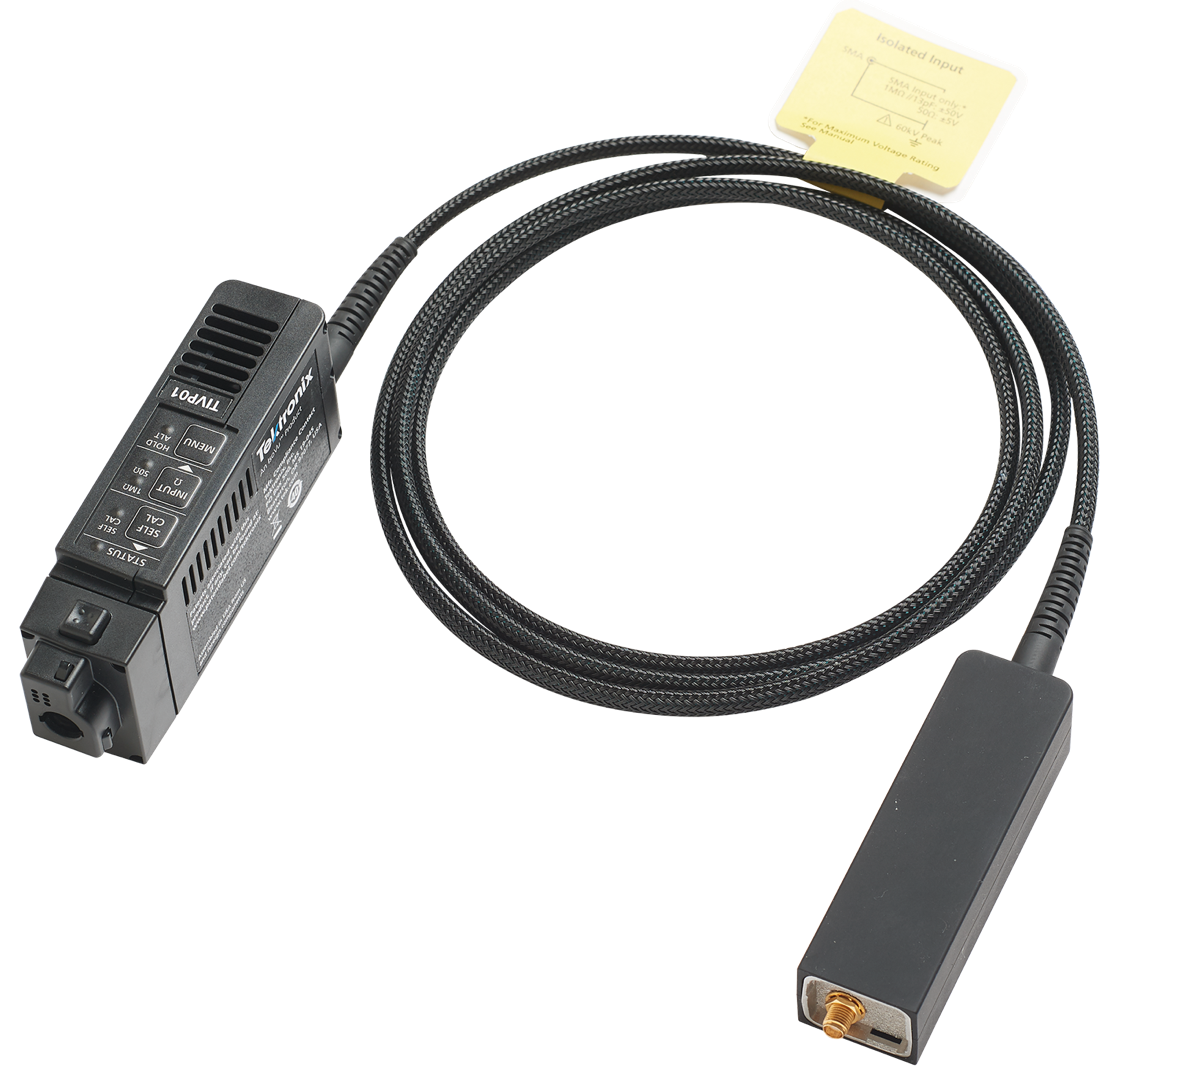
The TekVPI® probe interface sets the standard for ease of use in probing. In addition to the secure, reliable connection that the interface provides, many TekVPI probes feature status indicators and controls, as well as a probe menu button right on the comp box itself. This button brings up a probe menu on the oscilloscope display with all relevant settings and controls for the probe. The TekVPI interface enables direct attachment of current probes without requiring a separate power supply. TekVPI probes can be controlled remotely through USB or LAN, enabling more versatile solutions in ATE environments. The 4 Series MSO provides up to 80 W of power to the front panel connectors, sufficient to power all connected TekVPI probes without the need for an additional probe power supply.
IsoVu™ Isolated Measurement System
Whether designing an inverter, optimizing a power supply, testing communication links, measuring across a current shunt resistor, debugging EMI or ESD issues, or trying to eliminate ground loops in your test setup, common mode interference has caused engineers to design, debug, evaluate, and optimize "blind" until now.
The revolutionary Tektronix IsoVu technology uses optical communications and power-over-fiber for complete galvanic isolation. When combined with the 4 Series MSO equipped with the TekVPI interface, it is the first, and only, measurement system capable of accurately resolving high bandwidth, differential signals, in the presence of large common mode voltage with:
- Complete galvanic isolation
- Up to 1 GHz bandwidth
- 1 Million to 1 (120 dB) common mode rejection at 100 MHz
- 10,000 to 1 (80 dB) of common mode rejection at full bandwidth
- Up to 2,500 V differential dynamic range
- 60 kV common mode voltage range
High-side gate voltage measurement with IsoVu
The following image shows a comparison of the high-side gate voltage for a standard differential probe versus an optically isolated probe. For both at turn-off and turn-on, high-frequency ringing can be seen on the gate after the device’s gate passes through the threshold region. Due to coupling between the gate and power loop, some ringing is expected. However, in the case of the differential probe, the ringing has a significantly higher amplitude than is measured by the optically isolated probe. This is likely due to the changing reference voltage inducing common mode currents within the probe and an artifact of a standard differential probe. While the waveform measured by the differential probe appears to pass the maximum gate voltage of the device, the more accurate measurement of the optically isolated probe makes it clear that the device is within specification. Application designers using standard differential probes for gate voltage measurements should use caution as it may not be possible to differentiate between the probing and measurement system artifact shown here and an actual violation of the device ratings. This measurement artifact may cause the designer to increase the gate resistance to slow down the switching transient and reduce the ringing. However, this would unnecessarily increase losses in the SiC device. For this reason, it is essential to have a measurement system that accurately reflects the actual dynamics of the device, in order to appropriately design the system and optimize performance. 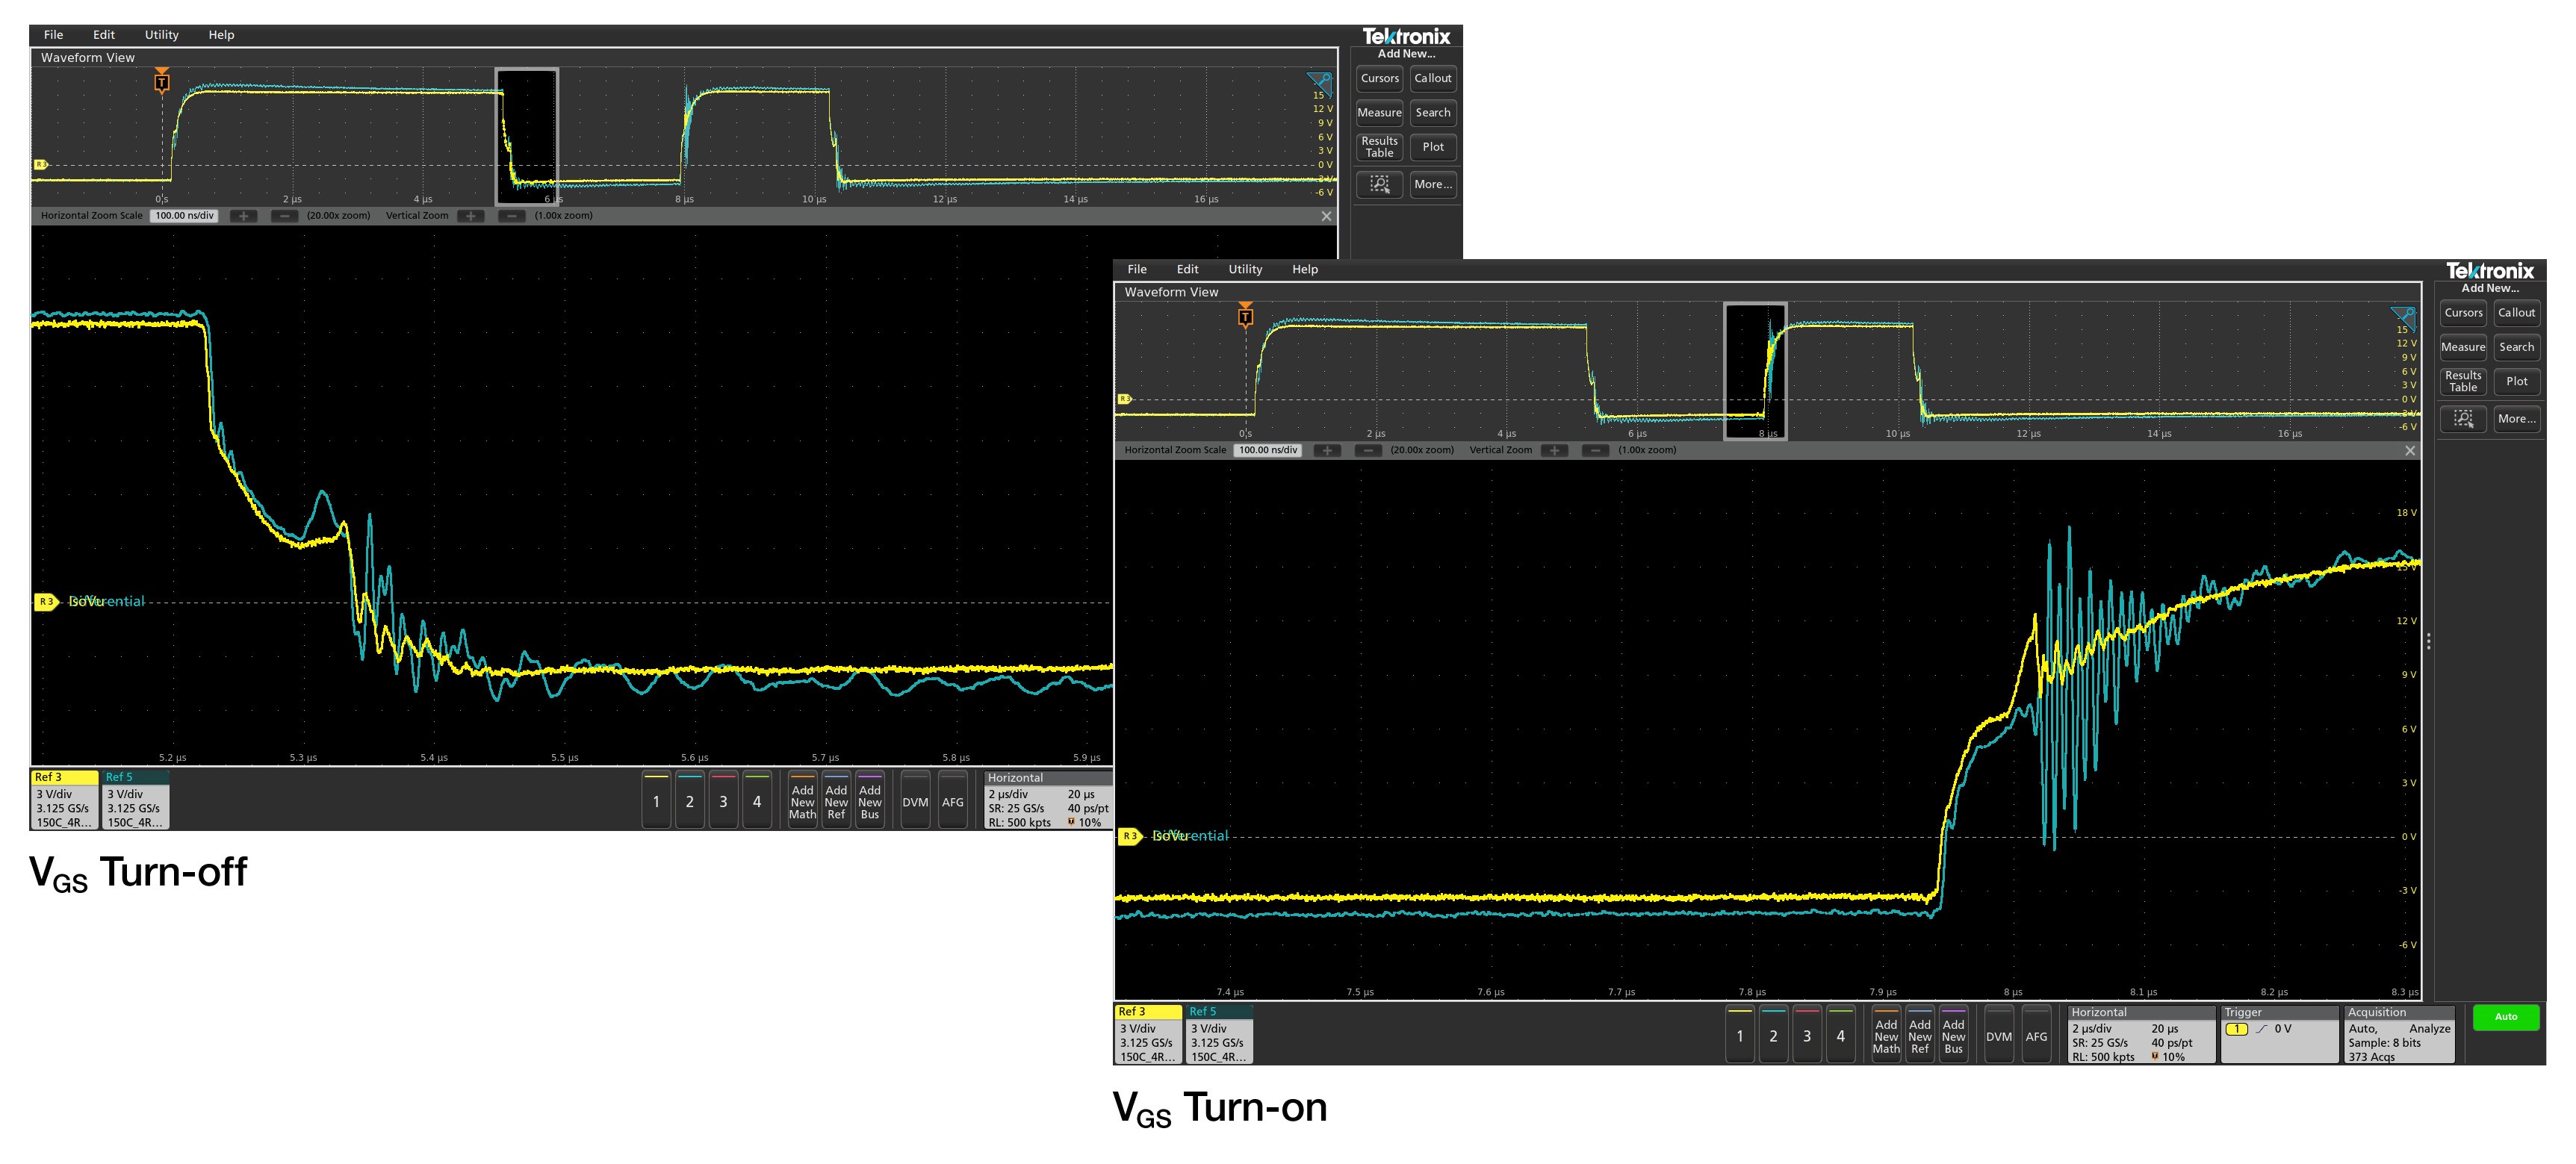
Comprehensive analysis for fast insight
Basic waveform analysis
Verifying that your prototype's performance matches simulations and meets the project's design goals requires careful analysis, ranging from simple checks of rise times and pulse widths to sophisticated power loss analysis, characterization of system clocks, and investigation of noise sources.
The 4 Series MSO offers a comprehensive set of standard analysis tools including:
- Waveform- and screen-based cursors
- 36 automated measurements. Measurement results include all instances in the record, the ability to navigate from one occurrence to the next, and immediate viewing of the minimum or maximum result found in the record
- Basic waveform math
- Basic FFT analysis
- Advanced waveform math including arbitrary equation editing with filters and variables
- Spectrum View frequency domain analysis with independent controls for time and frequency domains
- FastFrame™ Segmented Memory enables you to make efficient use of the oscilloscope’s acquisition memory by capturing many trigger events in a single record while eliminating the large time gaps between events of interest. View and measure the segments individually or as an overlay.
Standard amplitude and time measurements annotate the waveform display with visual bars and markers to indicate relative information. Measurement results tables provide comprehensive statistical views of measurement results with statistics across both the current acquisition and all acquisitions.
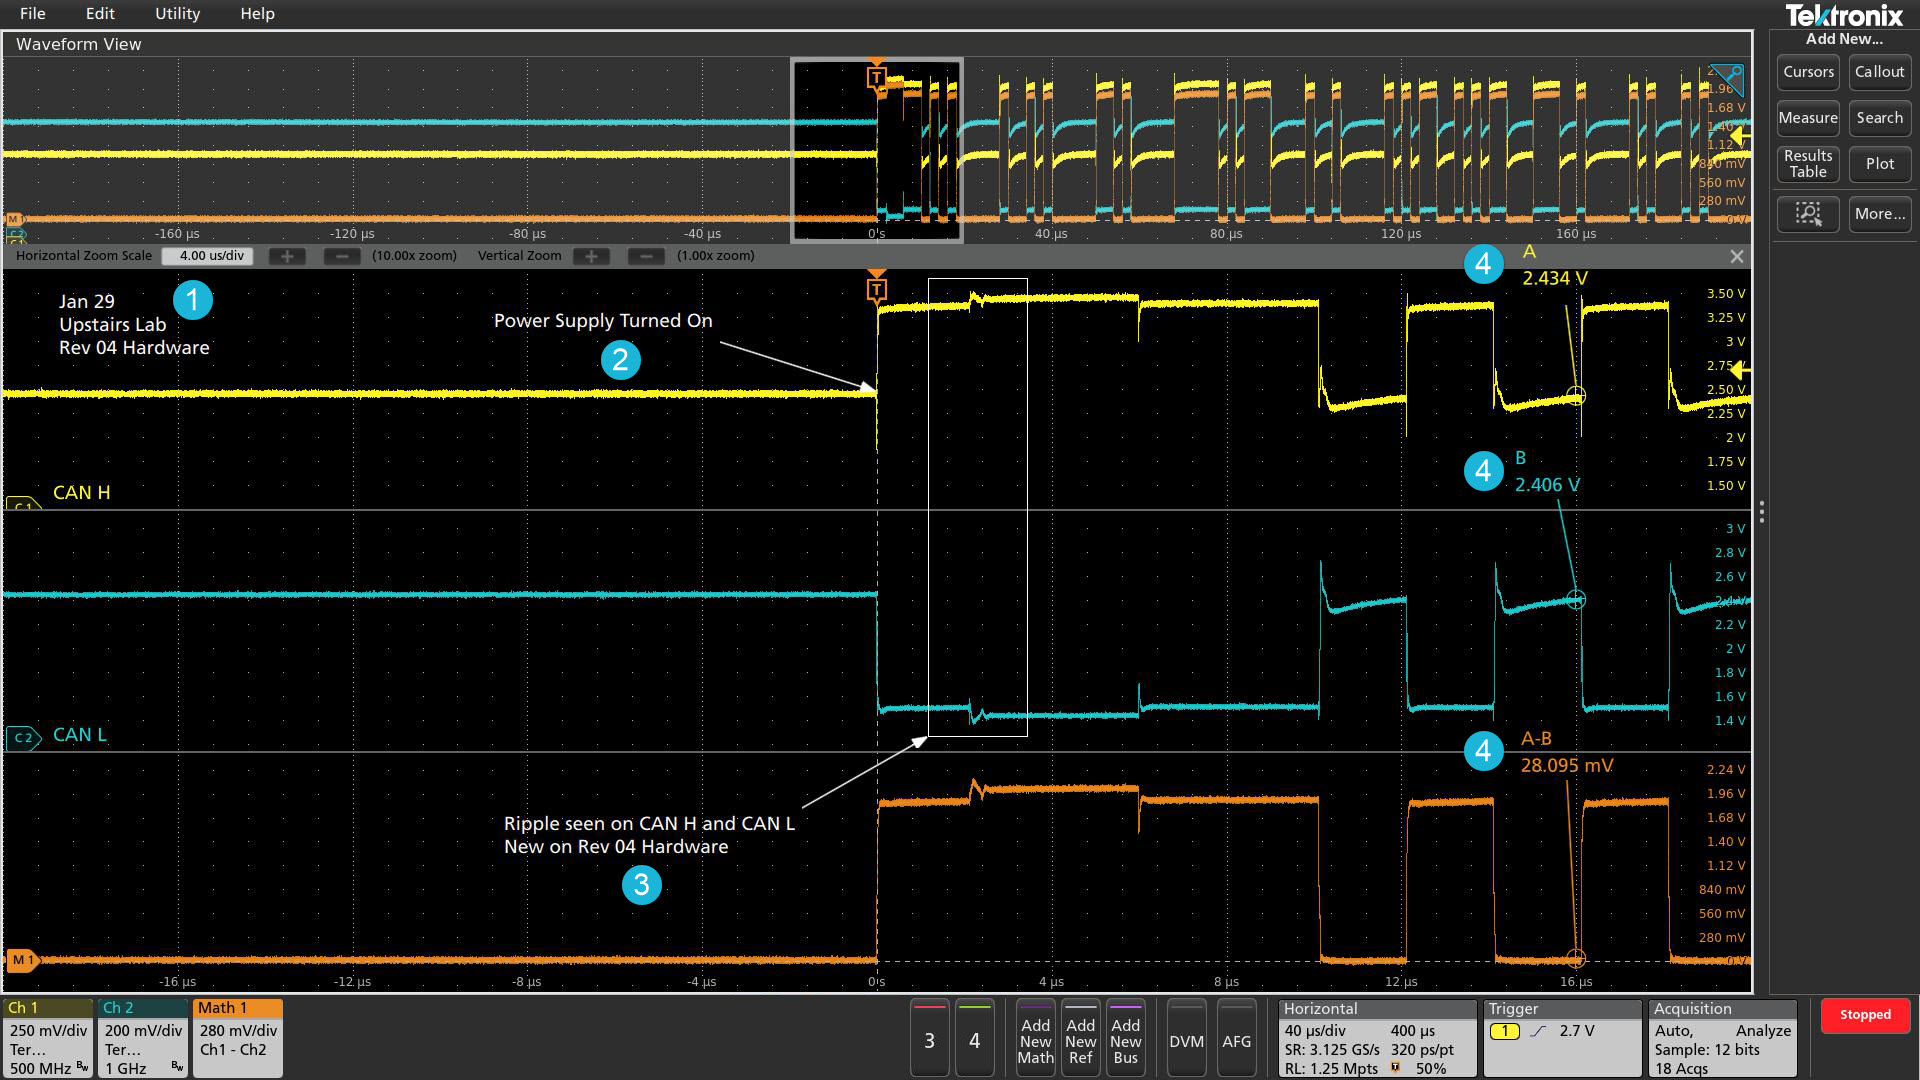
Callouts
- Note: Write and position a text box on the screen.
- Arrow: Write and position a text box, then add an arrow to a specific location on the screen.
- Rectangle: Write text and outline a specific region on the screen indicated by a resizable box.
- Bookmark: Create a dynamic readout at a specific time relevant to a trigger point. This readout includes text, magnitude of the signal, signal units, as well as a line and target indicating the bookmark reference point.
Documenting test results and methods is critical when sharing data across a team, recreating a measurement at a later date, or delivering a customer report. With a few taps on the screen, you can create as many custom callouts as needed; enabling you to document the specific details of your test results. With each callout, you can customize the text, location, color, font size, and font.
Navigation and search
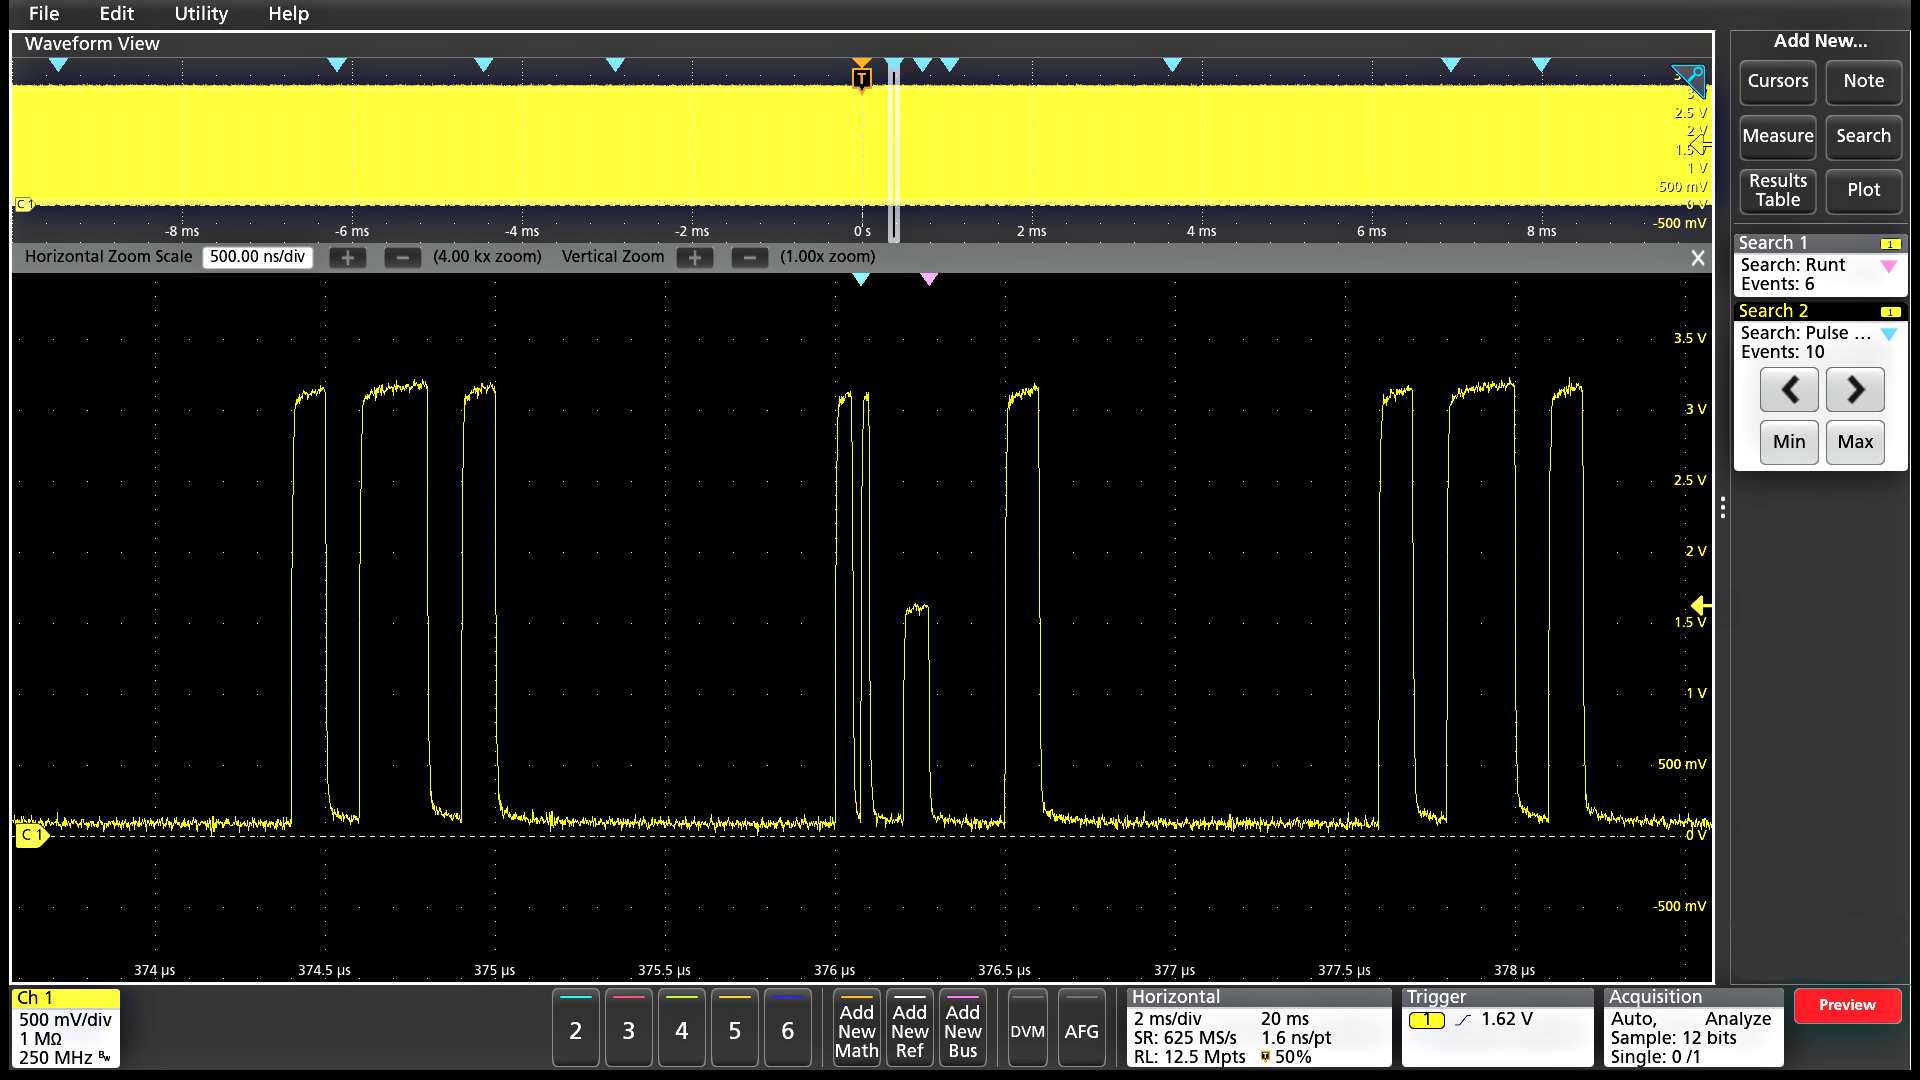
Finding your event of interest in a long waveform record can be time consuming without the right search tools. With today's record lengths of many millions of data points, locating your event can mean scrolling through literally thousands of screens of signal activity.
The 4 Series MSO offers the industry's most comprehensive search and waveform navigation with its innovative Wave Inspector® controls. These controls speed panning and zooming through your record. With a unique force-feedback system, you can move from one end of your record to the other in just seconds. Or, use intuitive drag and pinch/expand gestures on the display itself to investigate areas of interest in a long record.
The Search feature allows you to automatically search through your long acquisition looking for user-defined events. All occurrences of the event are highlighted with search marks and are easily navigated to, using the Previous ( ← ) and Next ( → ) buttons found on the front panel or on the Search badge on the display. Search types include edge, pulse width, timeout, runt, window, logic, setup and hold, rise/fall time and parallel/serial bus packet content. You can define as many unique searches as you like.
You can also quickly jump to the minimum and maximum value of search results by using the Min and Max buttons on the Search badge.
Mask and limit testing (optional)
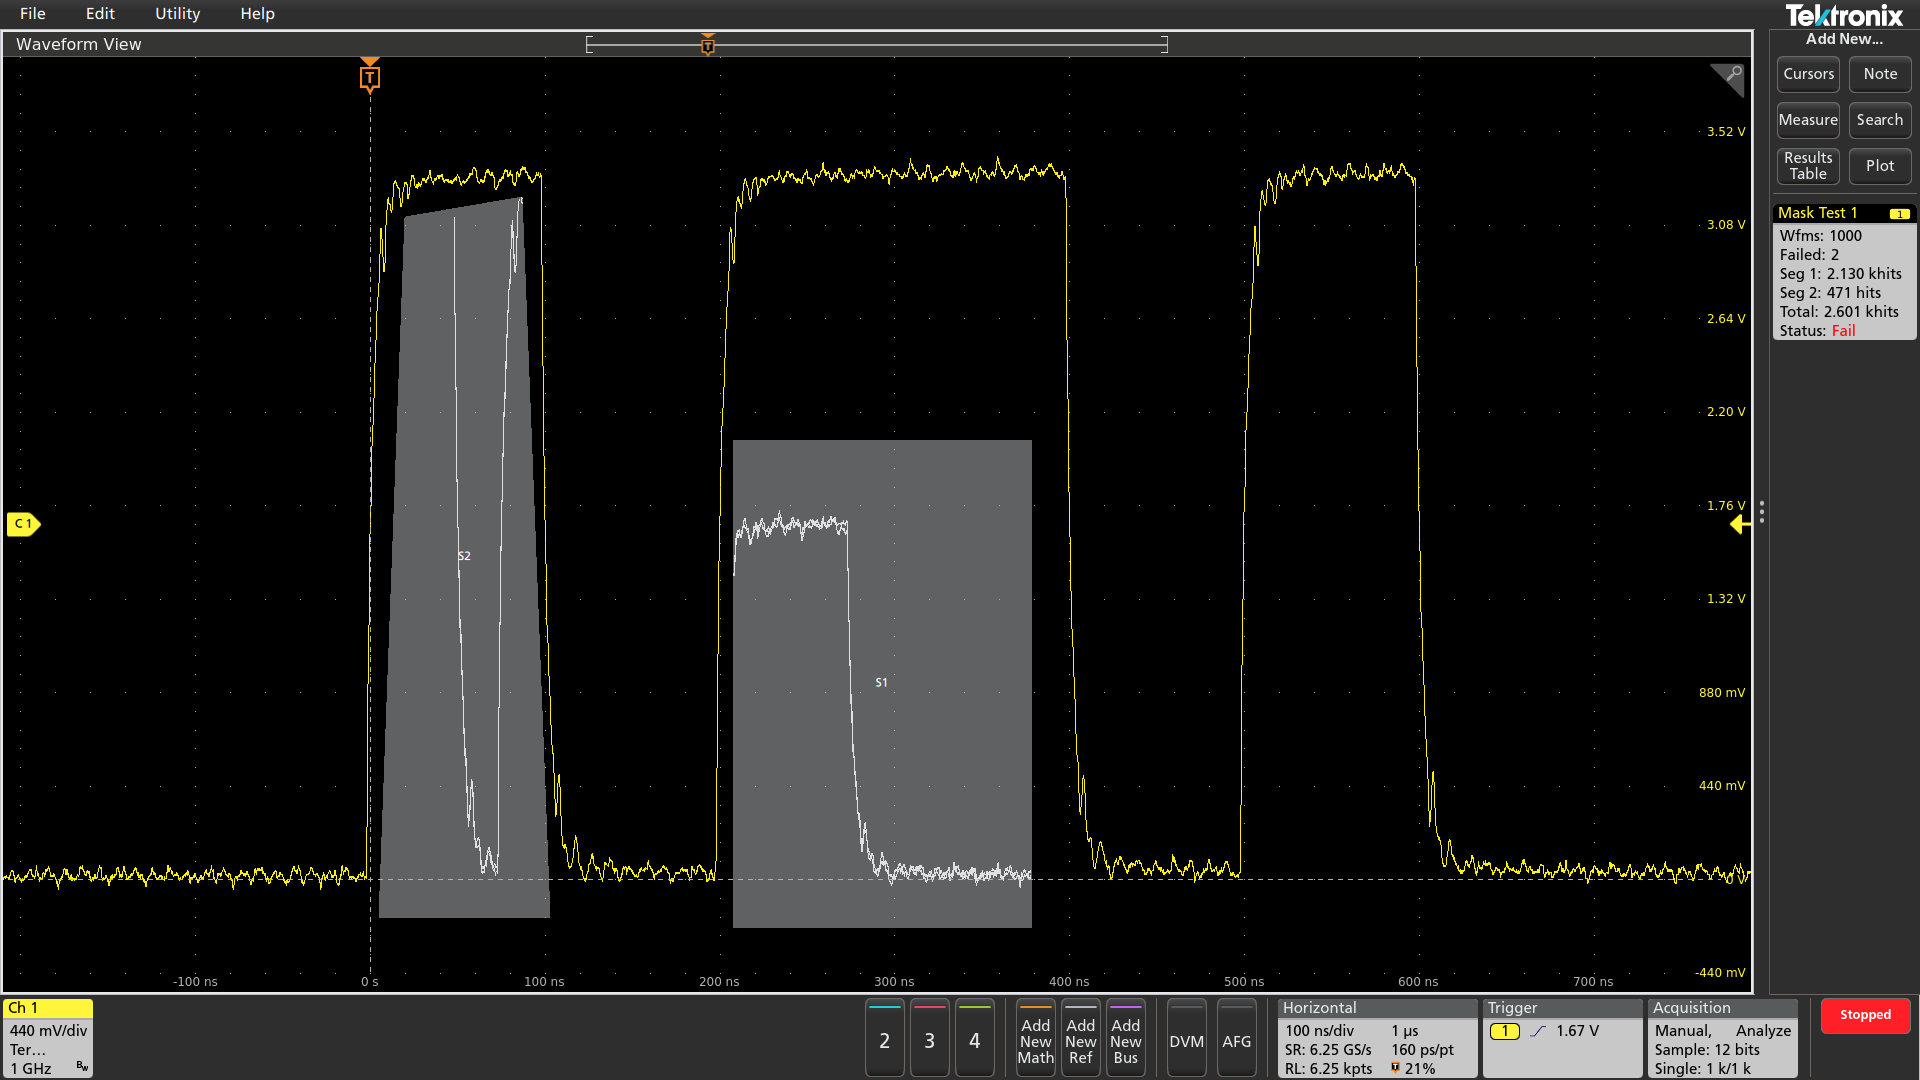
Whether you are focused on signal integrity or setting up pass/fail conditions for production, mask testing is an efficient tool to characterize the behavior of certain signals in a system. Quickly create custom masks by drawing mask segments on the screen. Tailor a test to your specific requirements and set actions to take when a mask hit is registered, or when a complete test passes or fails.
Limit testing is an insightful way to monitor the long-term behavior of signals, helping you characterize a new design or confirm hardware performance during production line testing. Limit tests compare your live signal to an ideal, or "golden" version of the same signal with user-defined vertical and horizontal tolerances.
You can easily tailor a mask or limit test to your specific requirements by:
- Defining test duration in number of waveforms
- Setting a violation threshold that must be met before considering a test a failure
- Counting violations/failures and reporting statistical information
- Setting actions upon violations, test failure, and test complete
Protocol decode and analysis (optional)
During debugging, it can be invaluable to trace the flow of activity through a system by observing the traffic on one or more serial buses. It could take many minutes to manually decode a single serial packet, much less the thousands of packets that may be present in a long acquisition.
And if you know the event of interest that you are attempting to capture occurs when a particular command is sent across a serial bus, wouldn't it be nice if you could trigger on that event? Unfortunately, it's not as easy as simply specifying an edge or a pulse width trigger.
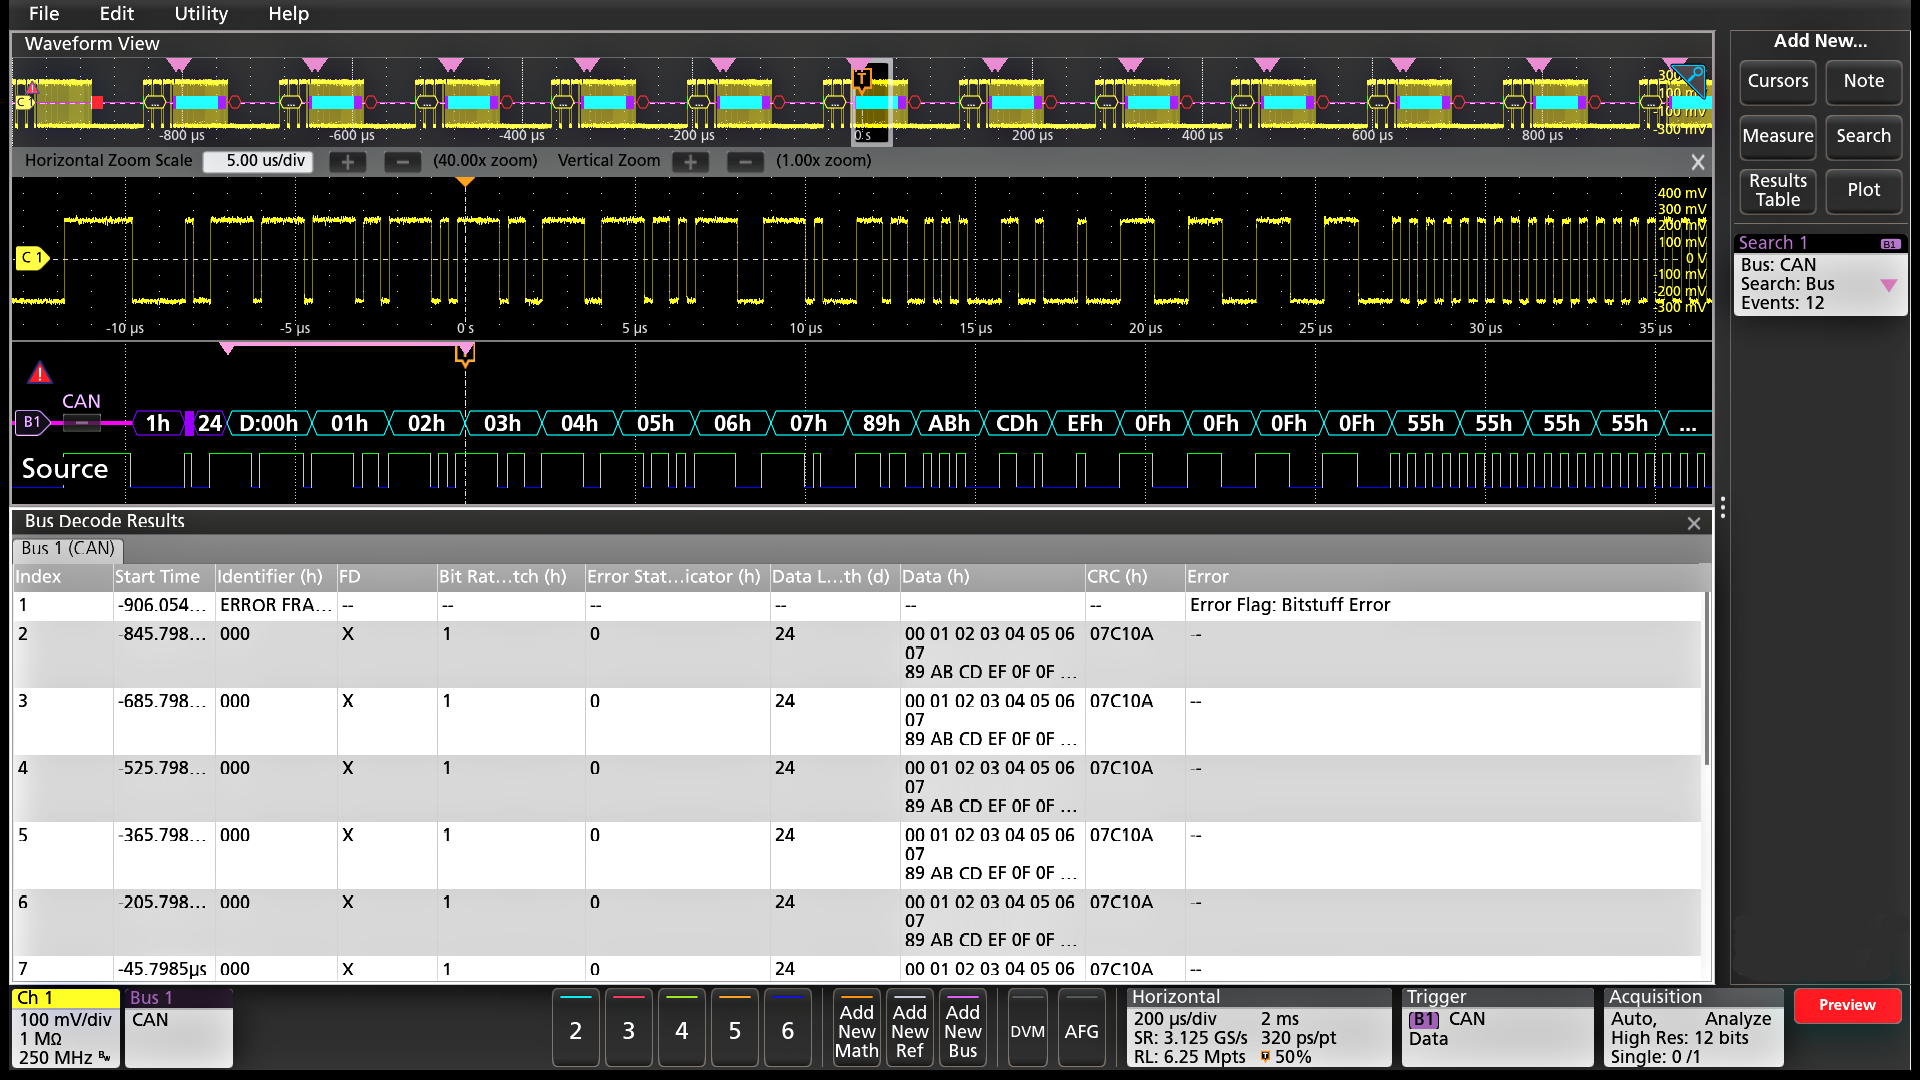
The 4 Series MSO offers a robust set of tools for working with the most common serial buses found in embedded design including I2C, SPI, eSPI, I3C, RS-232/422/485/UART, SPMI, SMBus, CAN, CAN FD, CAN XL, LIN, FlexRay, SENT, PSI5, CXPI, USB 1.0 (1.5 Mbps), USB 1.1 (12 Mbps), USB 2.0 (480 Mbps), eUSB2.0, Ethernet 10/100, EtherCAT, Audio (I2S/LJ/RJ/TDM), MIL-STD-1553, ARINC 429, Spacewire, NRZ, Manchester, SVID, SDLC, 1-Wire, MDIO, and NFC.
Protocol search enables you to search through a long acquisition of serial packets and find the ones that contain the specific packet content you specify. Each occurrence is highlighted by a search mark. Rapid navigation between marks is as simple as pressing the Previous ( ← ) and Next ( → ) buttons on the front panel or in the Search badge that appears in the Results Bar.
The tools described for serial buses also work on parallel buses. Support for parallel buses is standard in the instrument. Parallel buses can be up to 48 bits wide and can include a combination of analog and digital channels.
- Serial protocol triggering lets you trigger on specific packet content including start of packet, specific addresses, specific data content, unique identifiers, and errors.
- Bus waveforms provide a higher-level, combined view of the individual signals (clock, data, chip enable, and so on) that make up your bus, making it easy to identify where packets begin and end, and identifying sub-packet components such as address, data, identifier, CRC, and so on.
- The bus waveform is time aligned with all other displayed signals, making it easy to measure timing relationships across various parts of the system under test.
- Bus decode tables provide a tabular view of all decoded packets in an acquisition much like you would see in a software listing. Packets are time stamped and listed consecutively with columns for each component (Address, Data, and so on).
NFC decode and analysis (optional)
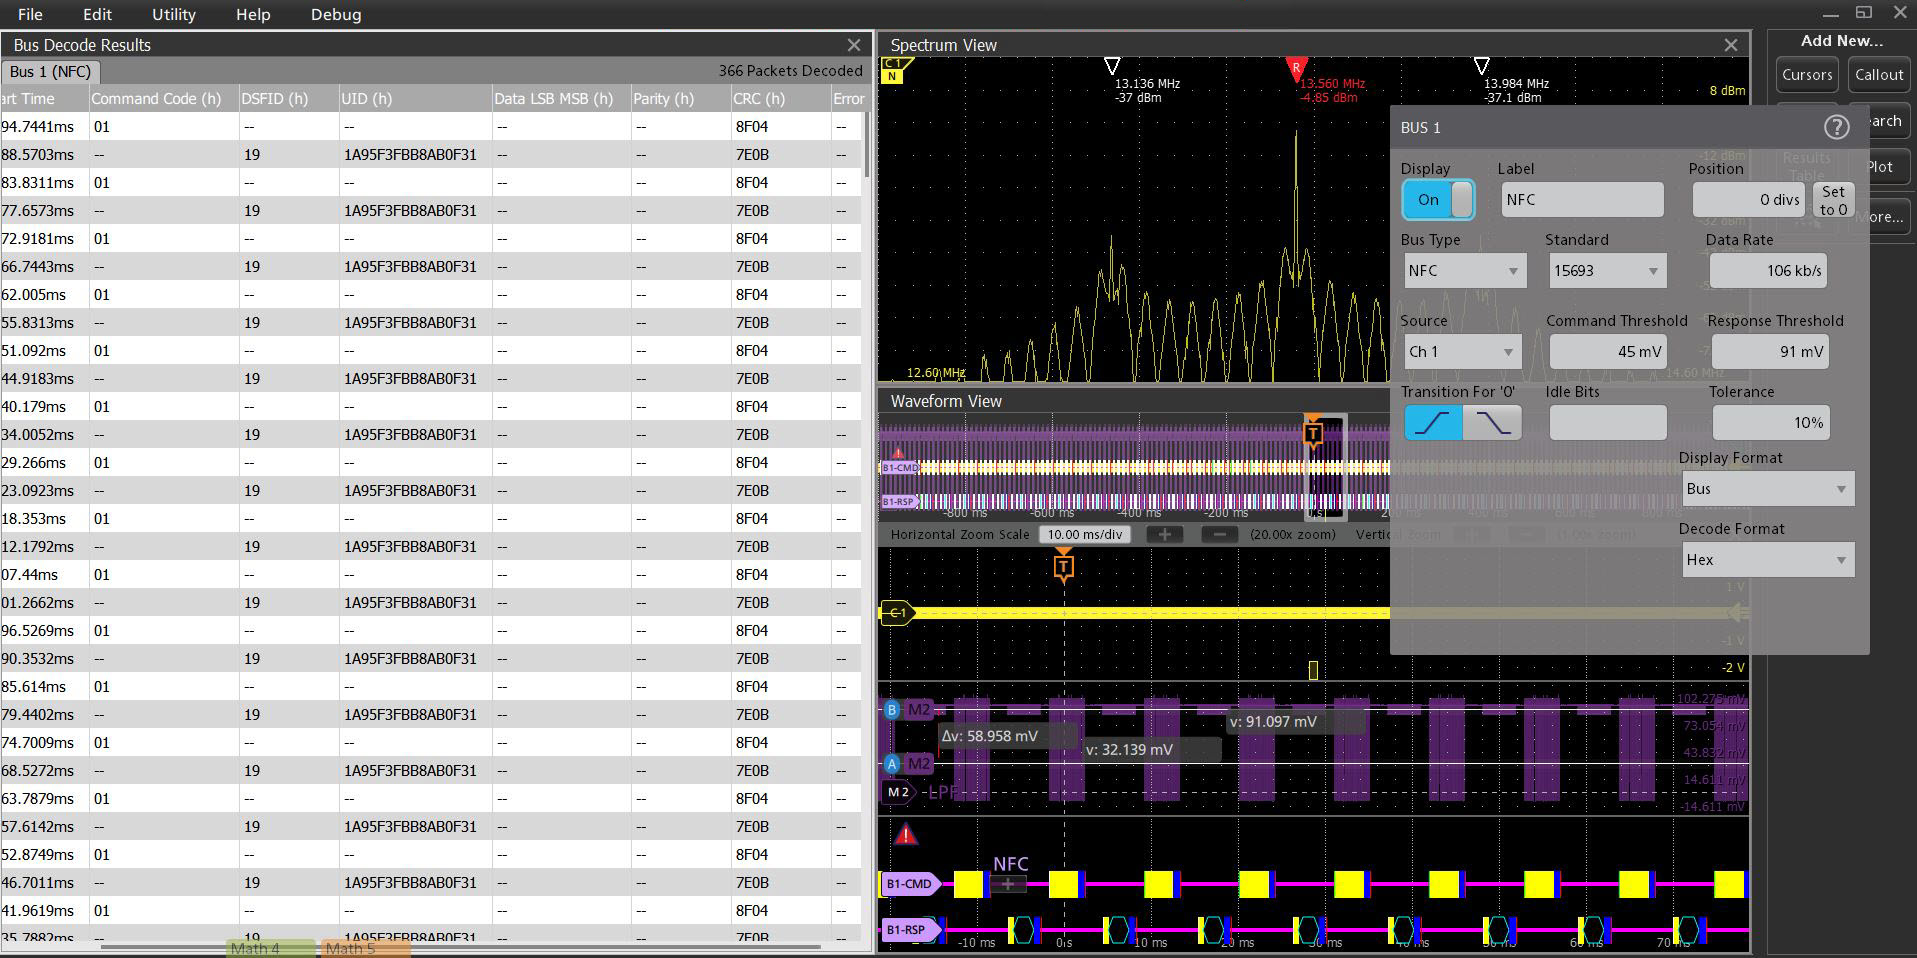
Evaluating the performance margins of NFC designs is often difficult due to an inability to trace the protocol-level result down to the parametric signal level. This means marginal passes may result in failures later in the test flow, especially when designs are susceptible to interference and signal integrity issues caused by design trade-offs or nearby electronics, requiring time consuming debug across multiple instruments like a protocol analyzer and RF signal analyzer.
The NFC Protocol Decode and Search option on the 4 Series MSO offers users the ability to view the transaction of the NFC link and trace the result through every step of signal manipulation in the standard, from the protocol-level down to the fundamental signal level to gain insight into exactly how your NFC chip, tag, reader, or mobile device is performing.
NFC transactions can be long. The software option uniquely uses the data coming from the hardware DDC used for Spectrum View, which allows for sample rate compression, saving transfer time and memory, allowing for 100s of milliseconds or even seconds of signal data to be captured and analyzed.
Additionally, because I/O signals are not always available to probe and trigger on from the device under test, triggering on the RF envelope itself is also a challenge considering NFC’s small modulation index. With Spectrum View, you can trigger on the 13.56 MHz envelope using RF vs. Time traces and triggers, which is also unique amongst instruments.
This capability simplifies up-front design validation and also provides a powerful debugging tool in a single instrument when failures do occur.
Spectrum View
It is often easier to debug an issue by viewing one or more signals in the frequency domain. Oscilloscopes have included math-based FFTs for decades in an attempt to address this need. However, FFTs are notoriously difficult to use for two primary reasons.
First, when performing frequency-domain analysis, you think about controls like Center Frequency, Span, and Resolution Bandwidth (RBW), as you would typically find on a spectrum analyzer. But then you use an FFT, where you are stuck with traditional scope controls like sample rate, record length and time/div and have to perform all the mental translations to try to get the view you’re looking for in the frequency-domain.
Second, FFTs are driven by the same acquisition system that’s delivering the analog time-domain view. When you optimize acquisition settings for the analog view, your frequency-domain view isn’t what you want. When you get the frequency-domain view you want, your analog view is not what you want. With math-based FFTs, it is virtually impossible to get optimized views in both domains.
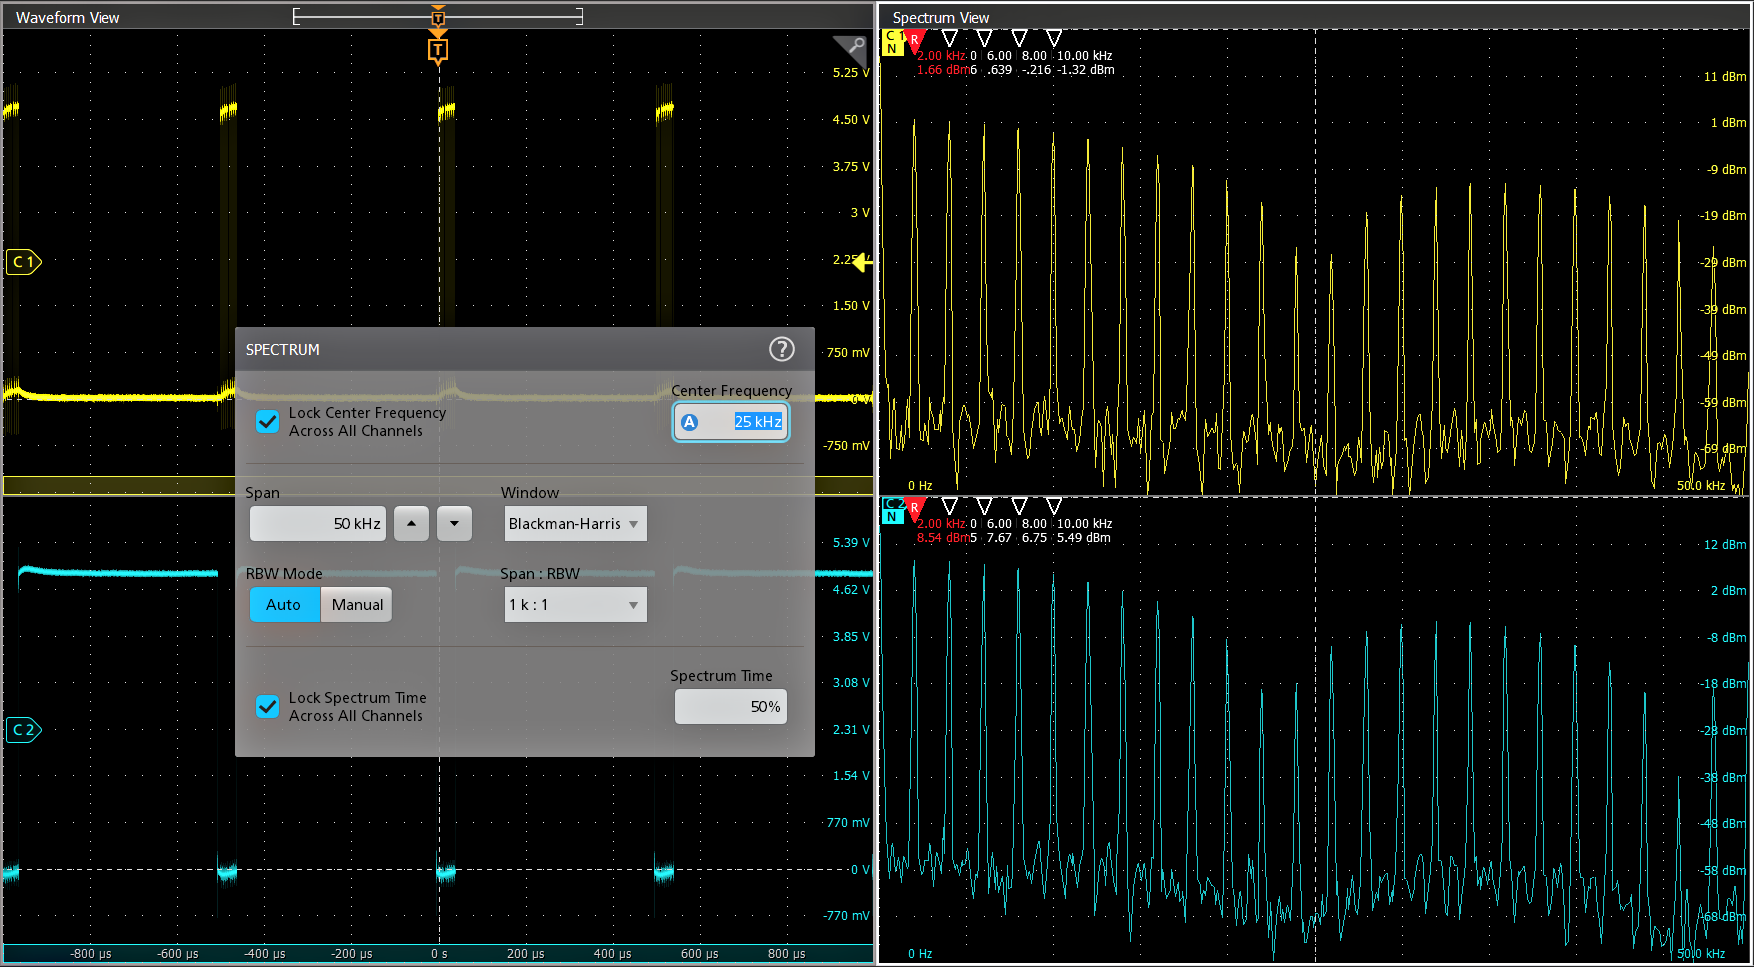
Spectrum View changes all of this. Tektronix’ patented technology provides both a decimator for the time-domain and a digital downconverter (DDC) for the frequency-domain behind each FlexChannel. The two different acquisition paths let you simultaneously observe both time- and frequency-domain views of the input signal with independent acquisition settings for each domain. Other manufacturers offer various ‘spectral analysis’ packages that claim ease-of-use, but they all exhibit the limitations described above. Only Spectrum View provides both exceptional ease-of-use and the ability to achieve optimal views in both domains simultaneously.
Traditionally, performing RF measurements, such as RF Channel Power (CHP), Adjacent Channel Power Ratio (ACPR), and Occupied Bandwidth (OBW), required a dedicated spectrum or signal analyzer or spectrum analyzer software. This additional hardware or software leads to more complexity and higher costs. Available standard with Spectrum View, integrated RF Measurements on each channel saves users time, bench space, and costs with the ability to validate RF transmitter CHP, ACPR, and OBW directly on the oscilloscope.
Additionally, the DDC significantly reduces the required sample rate to resolve a signal compared to a conventional FFT since it becomes a function of span rather than center frequency. This allows for reduced file sizes, improved frequency resolution, and faster spectrum update rates, leading to a more responsive and accurate solution capable of capturing 10's of seconds of spectrum data.
Visualizing changes in the RF signal (optional)
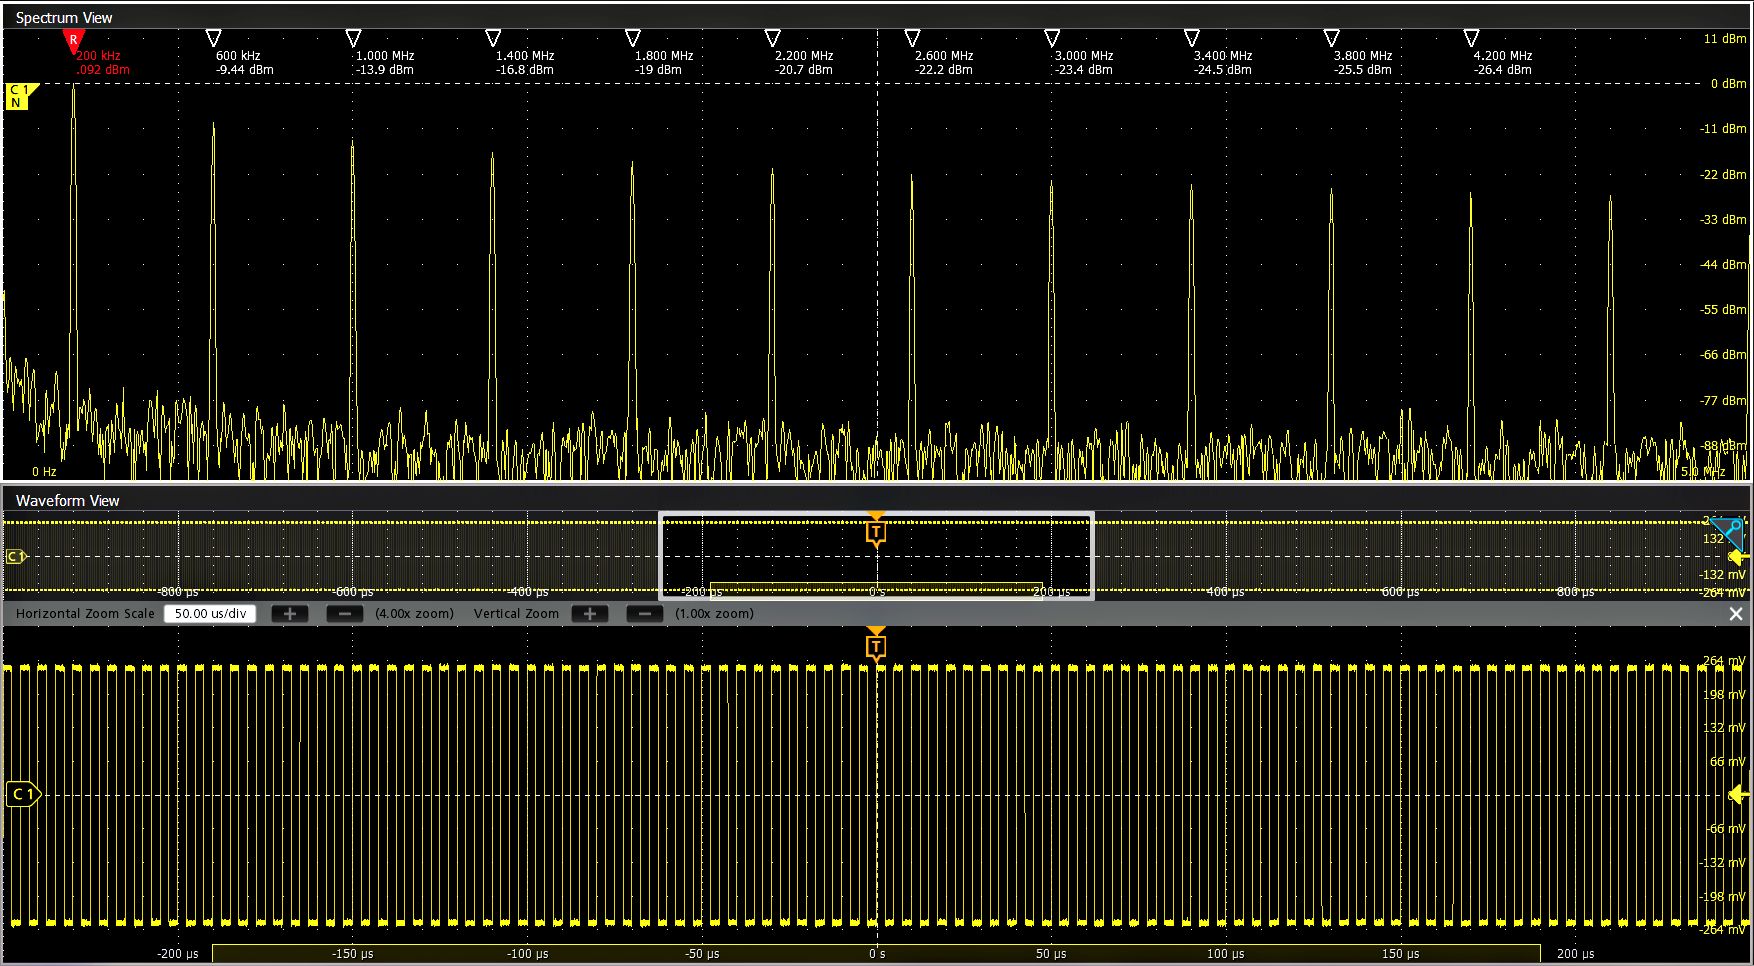
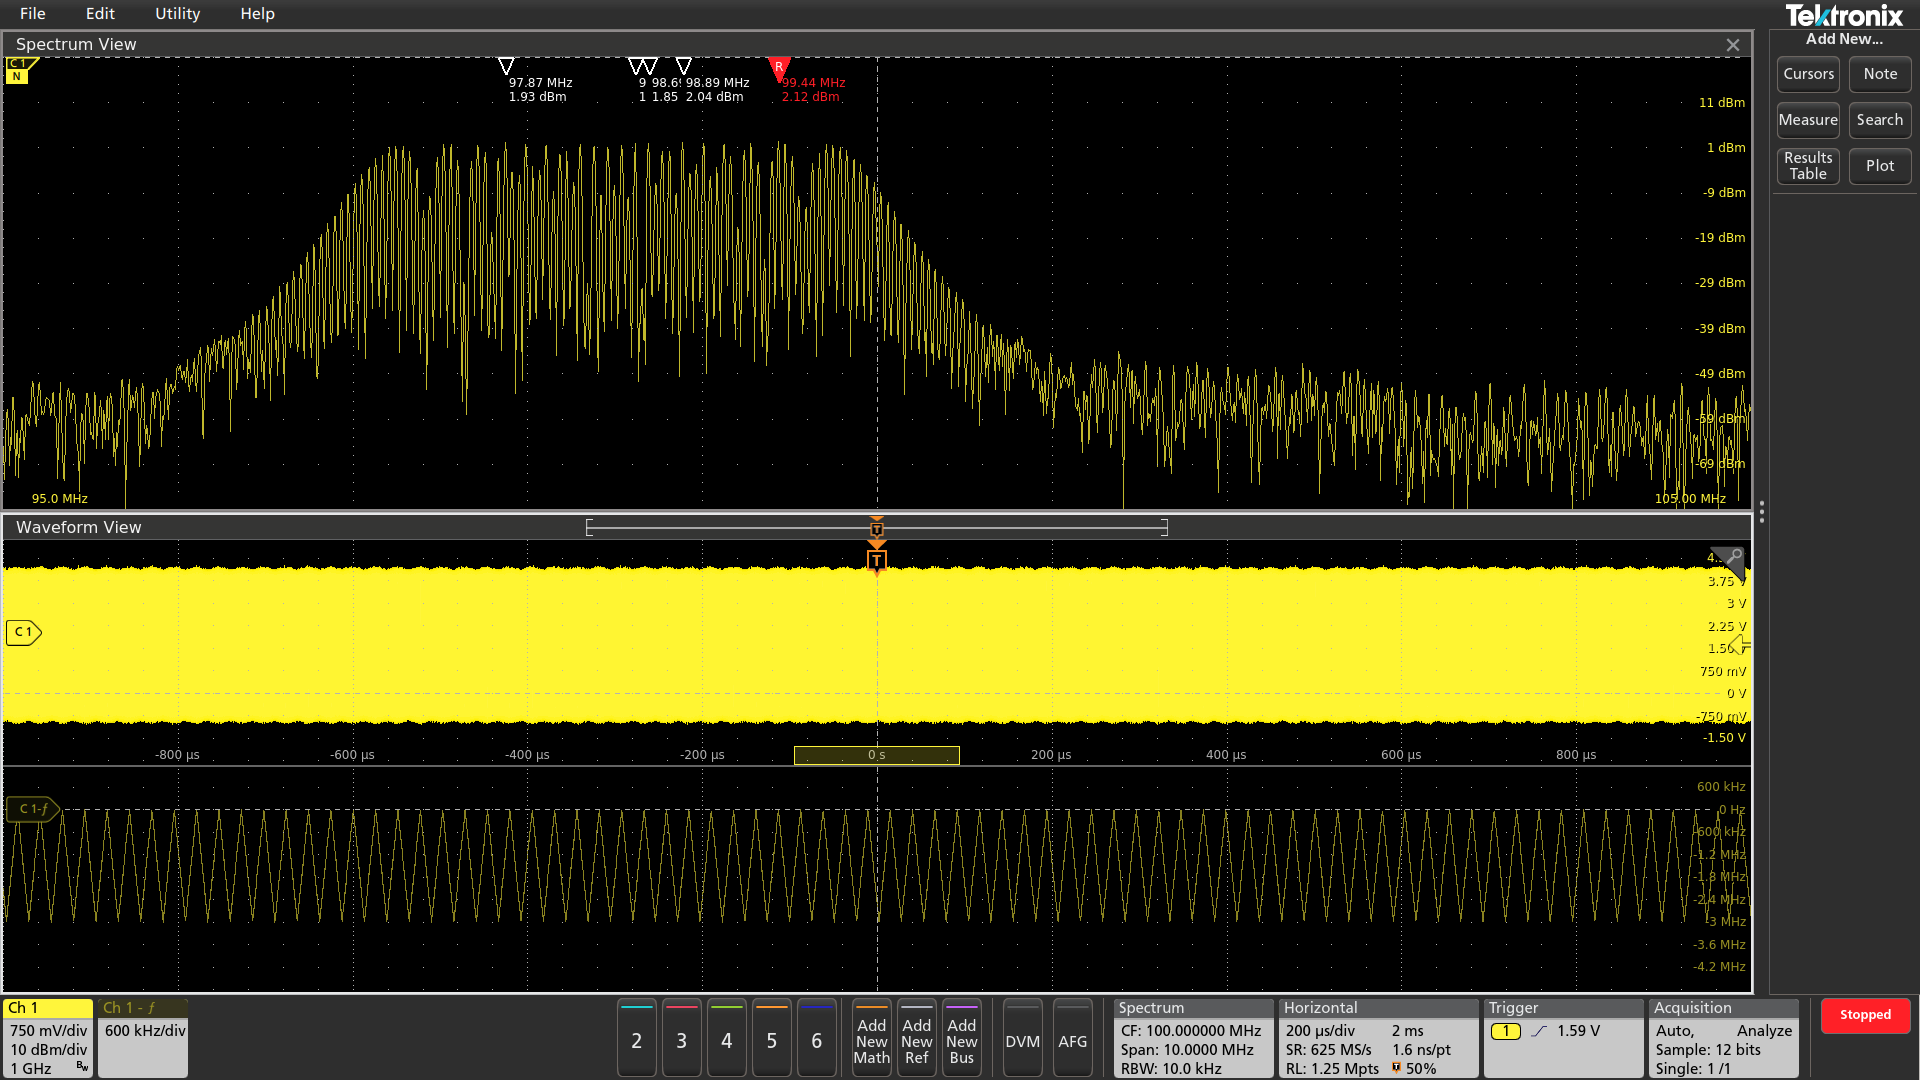
RF time domain traces make it easy to understand what’s happening with a time-varying RF signal. There are three RF time domain traces that are derived from the underlying I and Q data of Spectrum View:
- Magnitude – The instantaneous amplitude of the spectrum vs. time.
- Frequency – The instantaneous frequency of the spectrum relative to the center frequency vs. time.
- Phase – The instantaneous phase of the spectrum relative to the center frequency vs. time.
Each of these traces can be turned on and off independently, and all three can be displayed simultaneously.
The data is stored as in-phase and quadrature (I&Q) samples and precise synchronization is maintained between the time domain data and the I&Q data.
When RF vs. Time traces are activated, IQ data can be captured and exported to file for more advanced analysis within 3rd party applications.
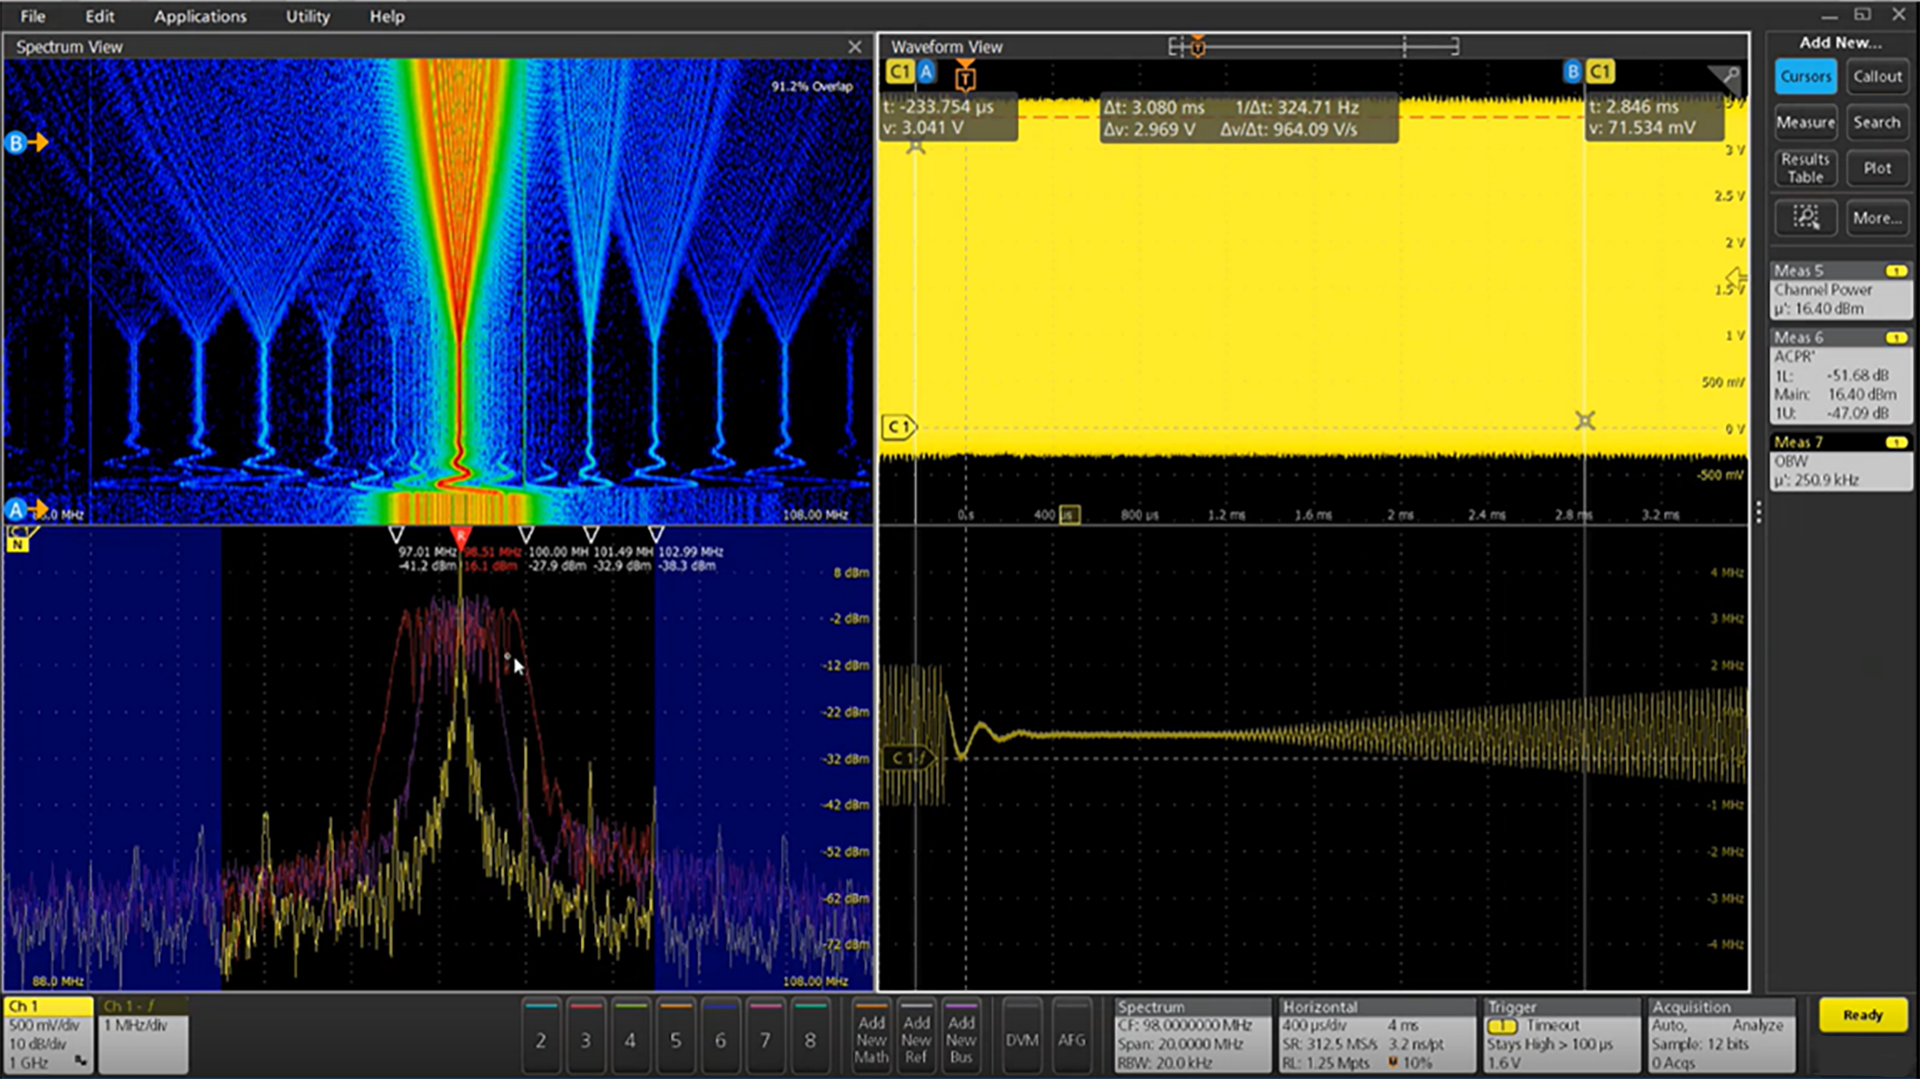
With frequency on the x-axis, time on the y-axis, and power level indicated by variations in color, the Spectrogram display (included with option RFVT) offers enhanced insight into changes in signal amplitude and frequency content over time, allowing you to see where and when changes in spectral activity occur. This makes it ideal for displaying trends in spectral data such as when diagnosing complex spurious, frequency hopping, multi-channel, and dynamic signals.
Spectrogram benefits include:
- Ability to view all spectrum activity in a given span and acquisition immediately, without having to specify FFT overlap or Spectrum Time
- Quickly compare spectrum at different moments in time using time-correlated cursors and up to three overlaid spectrum traces
- Pinch and zoom in on spectral activity of interest with display resolution and FFT overlap automatically optimized
- Adjust center frequency, span, RBW, and amplitude color-scaling as needed to view all signals of interest
- Simultaneously view trends in multi-channel or non-contiguous spectrum by activating spectrograms on each available oscilloscope channel and independently setting center frequency and amplitude scaling
Triggering on changes in the RF signal (optional)
Whether you need to find the source of electromagnetic interference or understand the behavior of a VCO, hardware triggers for RF versus time make it easy to isolate, capture, and understand the RF signal behavior. Trigger on edges, pulse widths, and timeout behavior of RF magnitude vs. time and RF frequency vs. time.
Power analysis (optional)
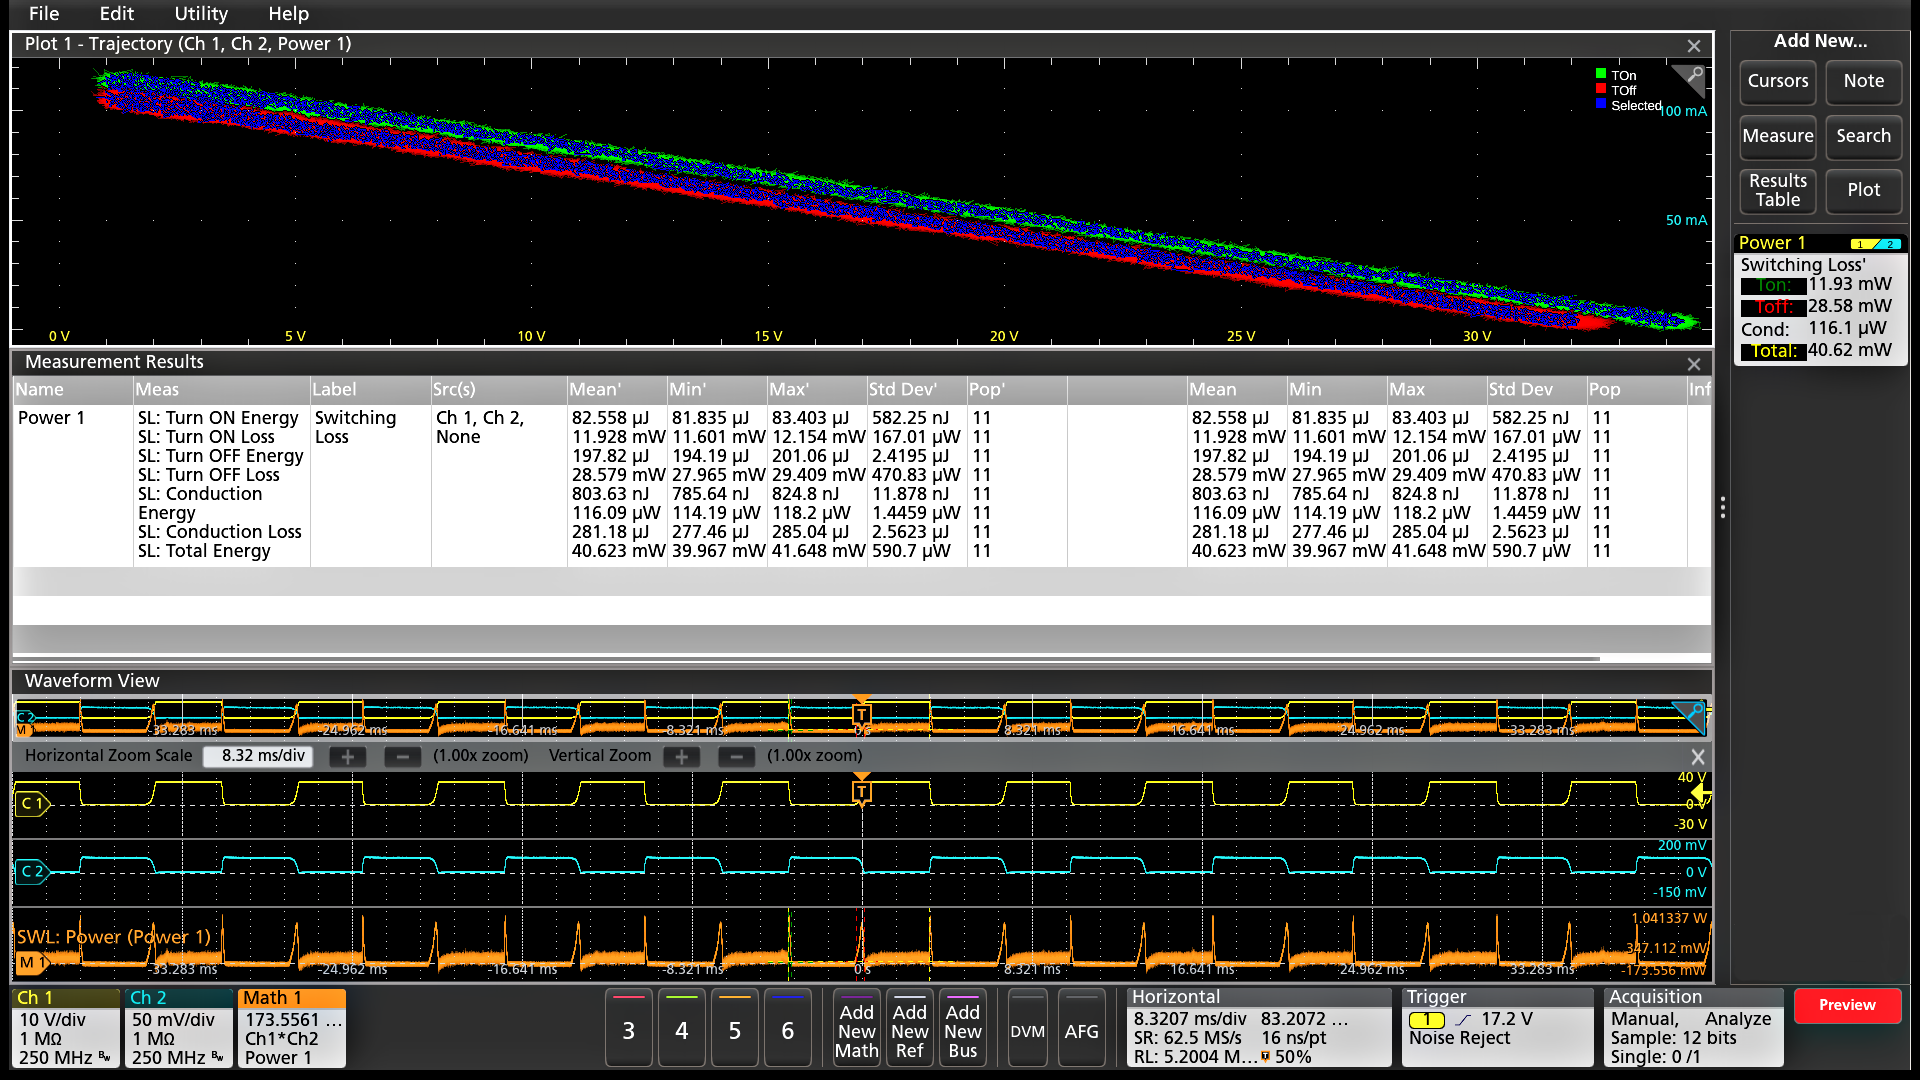
The 4 Series MSO has also integrated the optional power analysis package into the oscilloscope automatic measurement system to enable quick and repeatable analysis of power quality, input capacitance, in-rush current, harmonics, switching loss, safe operating area (SOA), modulation, ripple, efficiency, amplitude and timing measurements, and slew rate (dv/dt and di/dt).
Measurement automation optimizes the measurement quality and repeatability at the touch of a button, without the need for an external PC or complex software setup.
An optional advanced power analysis package provides all the measurements delivered by power analysis package plus Magnetics measurements, Control Loop Response (Bode Plot), and Power Supply Rejection Ratio (PSRR). See the ordering information section for more information.
Three-phase electrical analysis (optional)
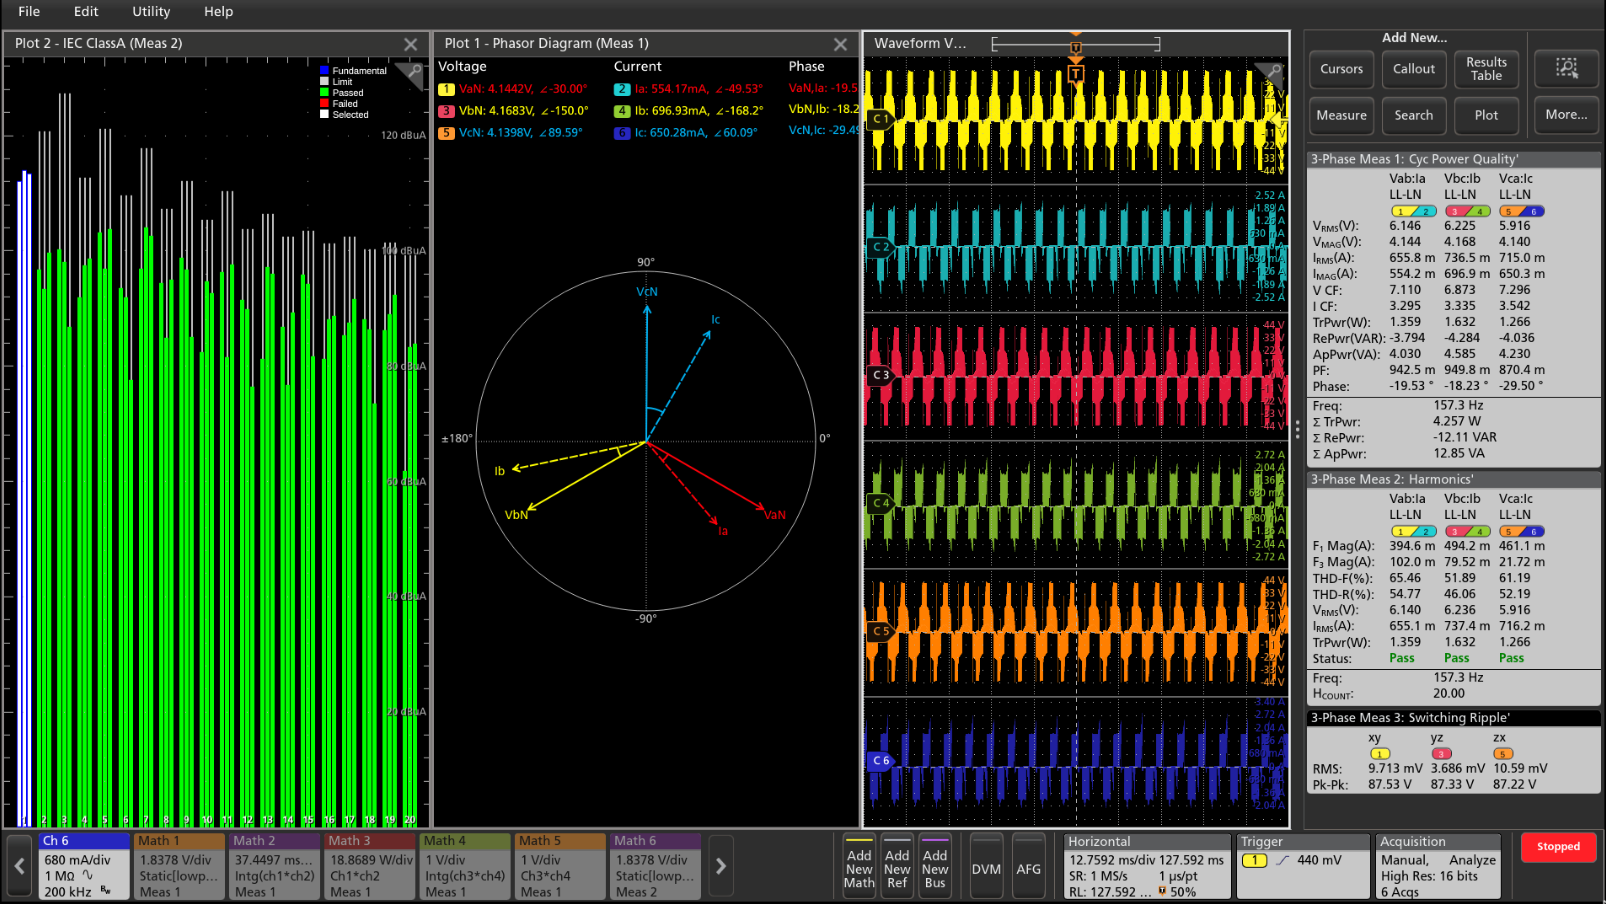
Measurements and analysis of the three-phase power systems are inherently more complex than on the single-phase systems. Although oscilloscopes can capture voltage and current waveforms with high sample rates, further calculations are required to generate the key power measurements from the data. The oscilloscope based three-phase solution captures the three-phase voltage and current waveforms with the higher sample rates and longer record lengths using the High Res acquisition mode up to 16-bits. Also, the three-phase solution generates the key power test results with the support of automated measurements. The power converters based on the Pulse Width Modulation (PWM) can complicate measurements since it is very important to extract precise zero crossings for the PWM signals, thus making an oscilloscope a recommended test tool for validation and troubleshooting for designers.
The software is designed specially to automate the power analysis that simplifies the important three-phase power measurements on the PWM systems and helps the engineers to get faster insights into their designs. The three-phase analysis solution from Tektronix helps the engineer's design better and more efficient three-phase systems, taking full advantage of the advanced user interface, six analog input channels, and High Res mode (16 bits) on the instrument. The solution provides fast, accurate, and repeatable results for the supported electrical measurements. It can also be configured to measure DC to three-phase AC converters, such as those used in the electric vehicles.
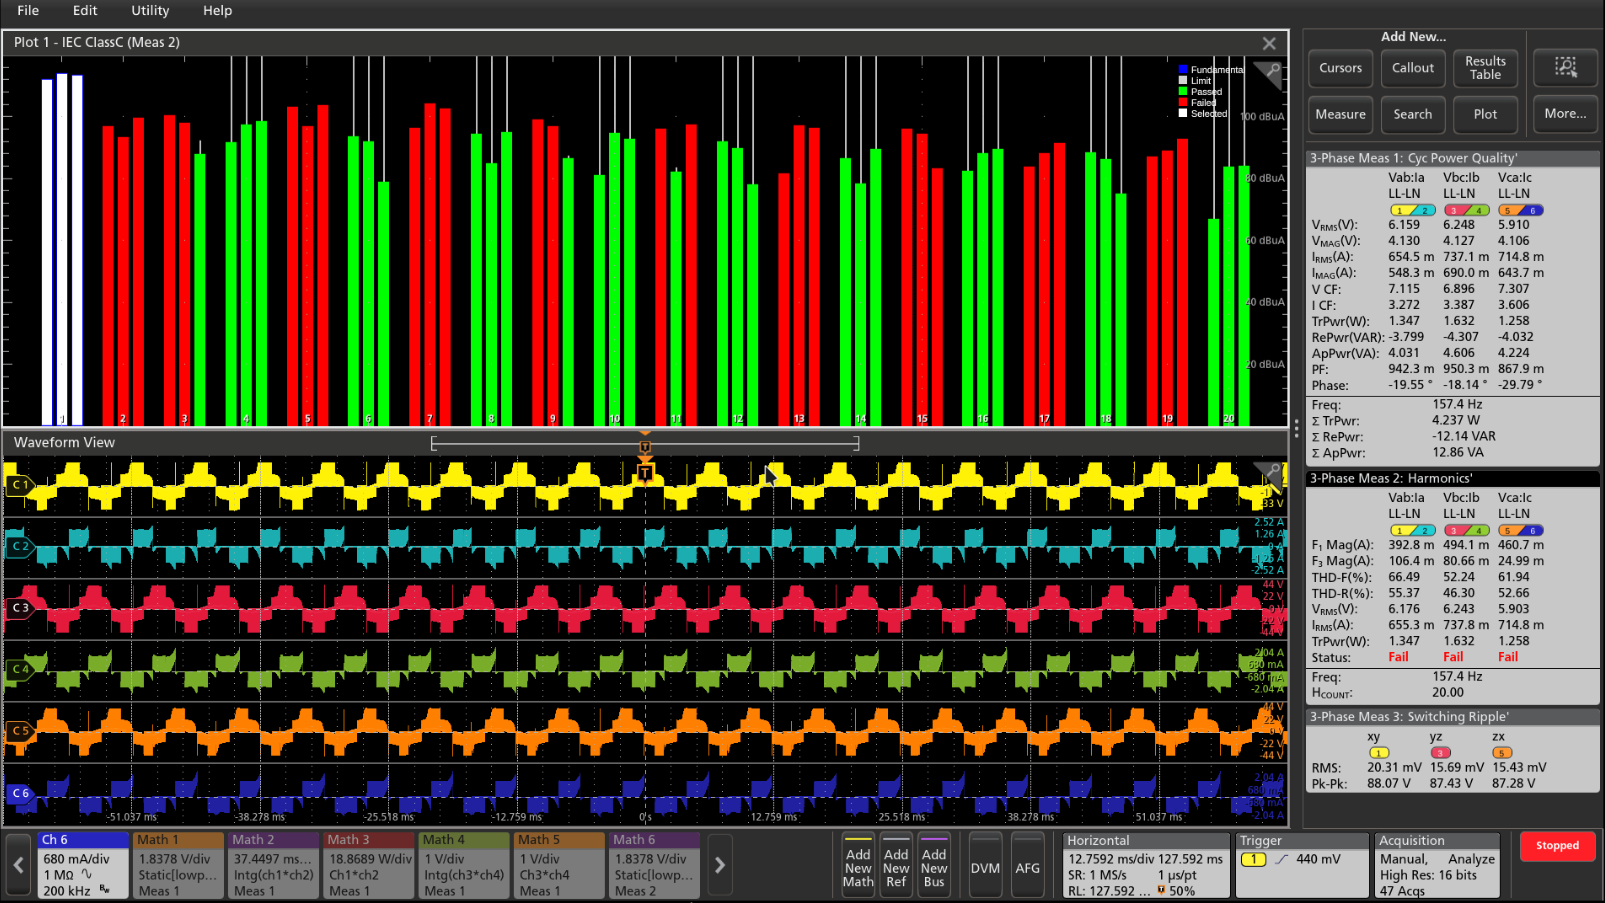
Key features and specifications:
- Accurately analyze three-phase PWM signals.
- Unique oscilloscope-based phasor diagrams indicate the VRMS, IRMS, VMAG, IMAG, and phase relationships at a glance for the configured wiring pairs.
- Debug the three-phase designs by viewing the drive input / output voltage and current signals in the time domain simultaneously with the phasor diagram.
- The Three-phase Autoset feature configures the oscilloscope for the optimal horizontal, vertical, trigger, and acquisition parameters for acquiring three-phase signals.
- Measures three-phase harmonics as per the IEEE-519 standard or using custom limits.
- Quickly add and configure measurements through the intuitive drag and drop interface on the 4 Series MSO.
- Analyze Inverter and automotive three-phase designs for DC-AC topology.
- Displays the PWM filtered edge qualifier waveform during the analysis
- Displays the test results per record, or per cycle mode during analysis for specific measurements.
- Supports Time trend and Acquisition trend plots for specific measurements.
- Supports mathematical conversion of Line-to-Line to Line-to-Neutral for specific wirings.
Measurement overview
The three-phase analysis on the 4 Series MSO automates key electrical measurements which are grouped into three categories:
- Input analysis
- Output analysis
- Ripple analysis
Each of these sections includes key measurements that are critical to the three-phase applications.
Wide Bandgap Double Pulse Test (optional)
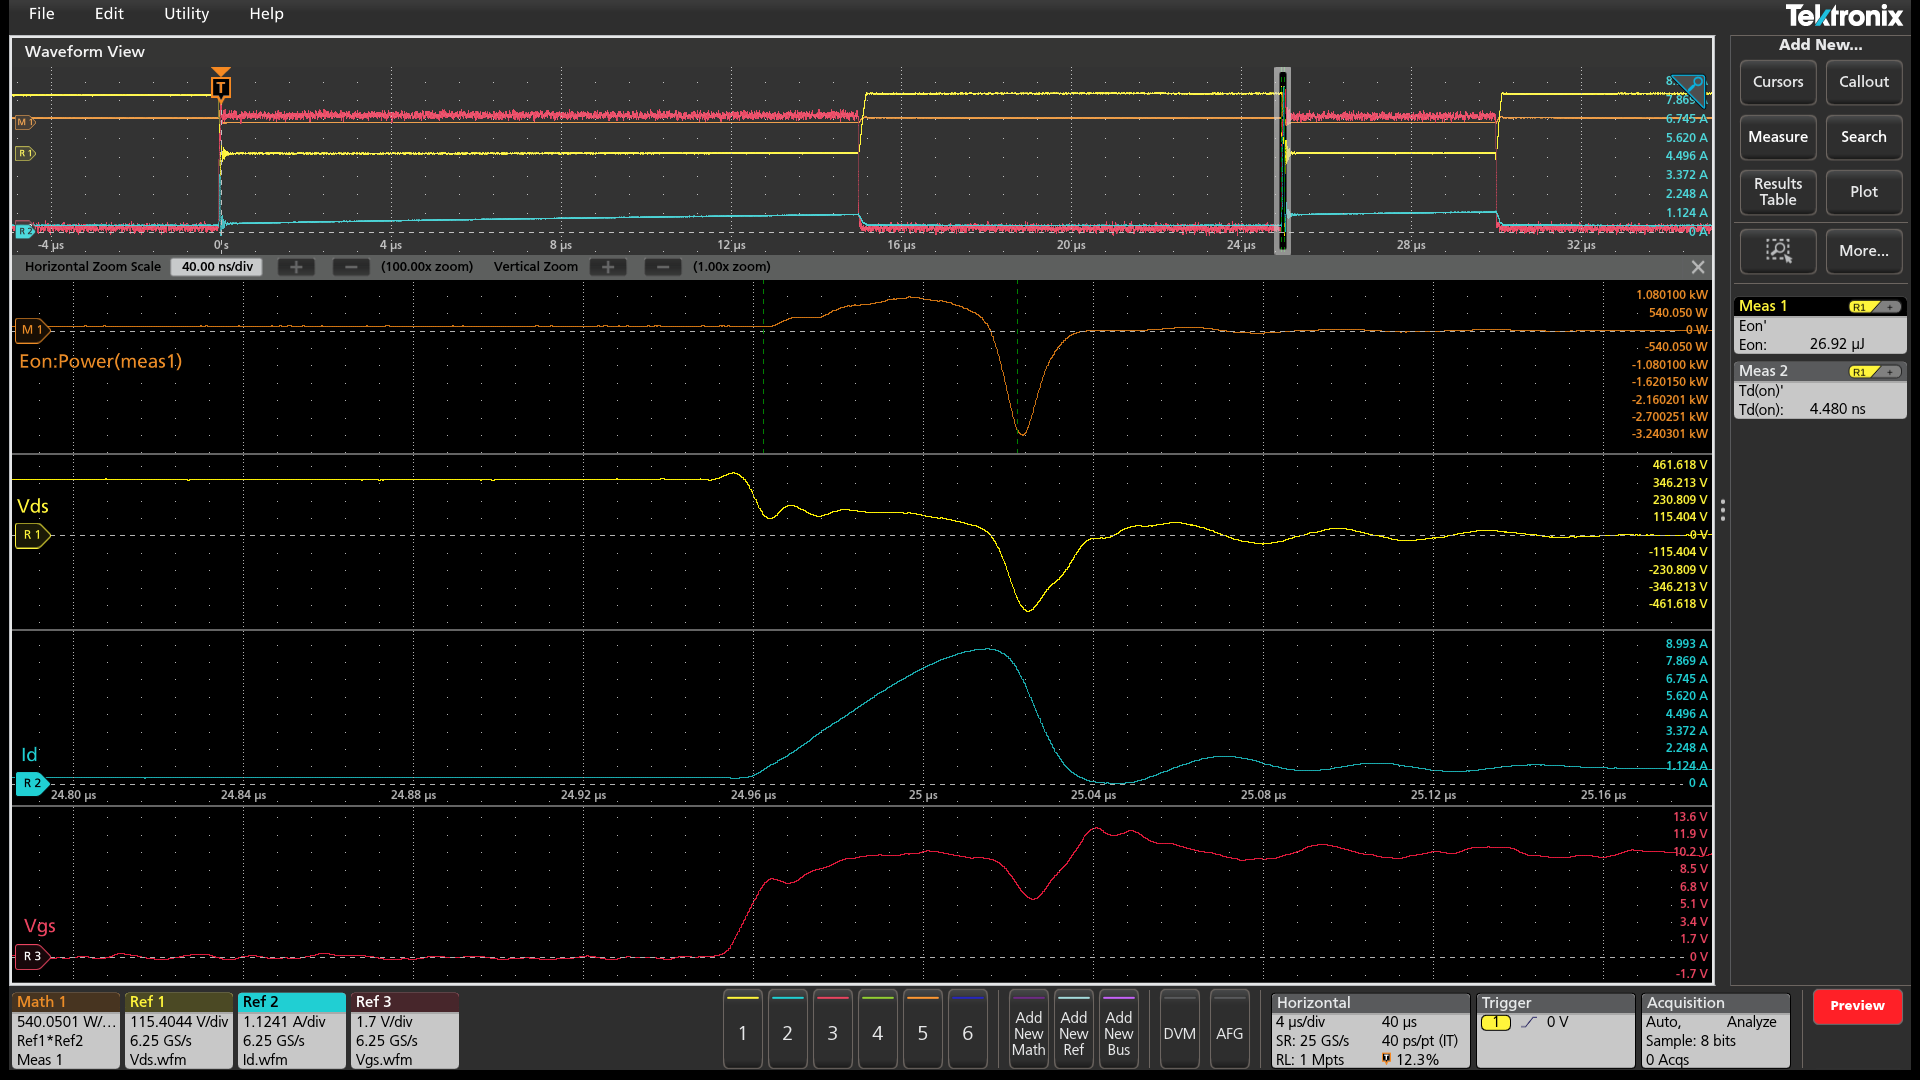
The Wide Bandgap Double Pulse Test application offers precise Wide Bandgap measurements that make device and the system validation easier. It has an ability to test SiC or GaN devices and also Si MOSFET and IGBTs. The application is compatible with all the Tektronix VPI probes and when used with the Tektronix IsoVu™ probes, it helps uncover all the hidden artifacts of SiC or GaN devices at the circuit level. The application offers automated measurements as per the JEDEC and IEC standards. It offers unique features such as per-cycle analysis with annotation, flexibility with custom reference level settings, configurable integration points, and power preset that can be set based on the DUT designs.
Following measurements are performed:
- Low side switching parameters and High side diode reverse recovery measurements
- Low side and High side switching parameters
Designed with your needs in mind
Connectivity
The 4 Series MSO contains a number of ports which you can use to connect the instrument to a network, directly to a PC, or to other test equipment.
- Three USB 2.0 ports on the front and two more USB 2.0 host ports on the rear panel enable easy transfer of screen shots, instrument settings, and waveform data to a USB mass storage device. A USB mouse and keyboard can also be attached to USB host ports for instrument control and data entry.
- The rear panel USB Device port is useful for controlling the oscilloscope remotely from a PC.
- The standard 10/100/1000BASE-T Ethernet port on the rear of the instrument enables easy connection to networks and provides LXI Core 2011 compatibility.
- The HDMI port on the rear of the instrument let you duplicate the instrument display on an external monitor or projector with 1,920 x 1,080 resolution.
Remote operation to improve collaboration
Want to collaborate with a design team on the other side of the world?
Simply enter the IP address or network name of the oscilloscope and a web page will be served to the browser. Control the oscilloscope remotely in the exact same way that you do in-person using the built-in touchscreen.
The industry-standard TekVISA™ protocol interface is included for using and enhancing Windows applications for data analysis and documentation. IVI-COM instrument drivers are included to enable easy communication with the oscilloscope using LAN or USBTMC connections from an external PC.
PC-based analysis and remote connection to your oscilloscope
Get the analysis capability of an award-winning oscilloscope on your PC. Analyze waveforms anywhere, anytime. The basic license lets you view and analyze waveforms, perform many types of measurements and decode the most common serial buses - all while remotely accessing your oscilloscope. Advanced license options add capabilities such as multi-scope analysis, more serial bus decoding options, and power measurements.
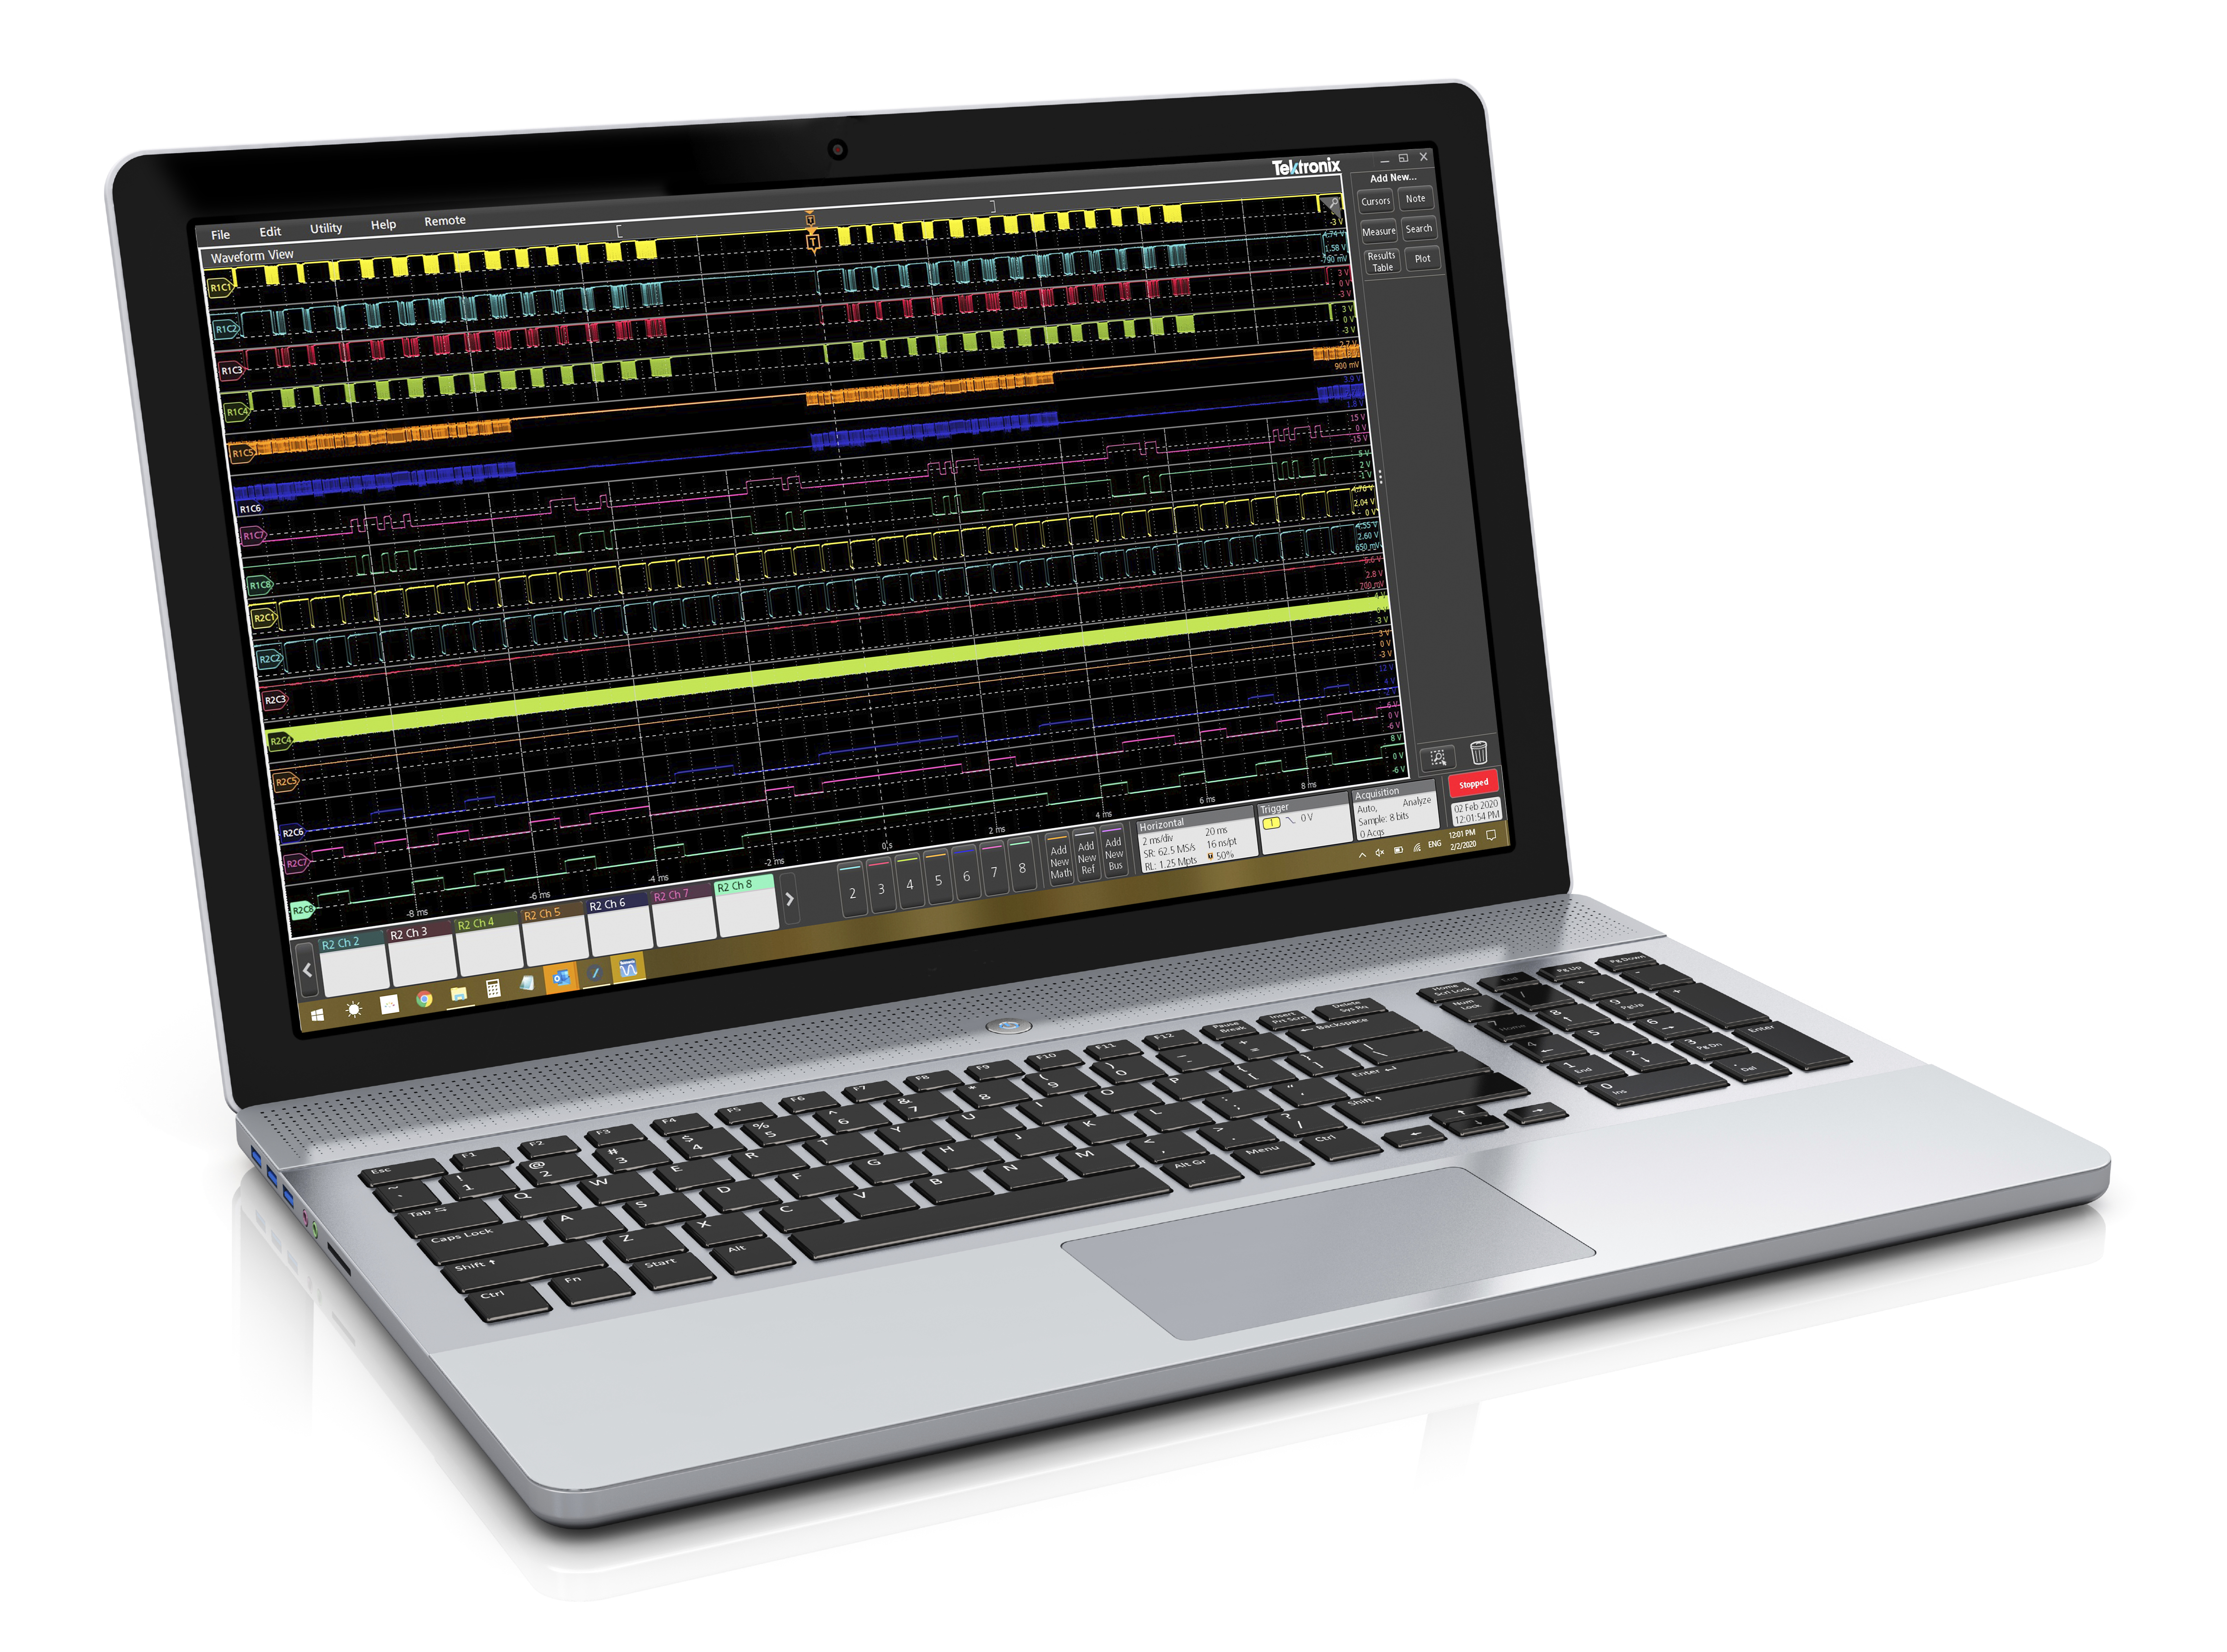
Key features of the TekScope PC analysis software include:
- Recall Tektronix oscilloscope sessions and waveform files from the equipment made by Tektronix and other vendors.
- Waveform file formats supported include .wfm, .isf, .csv, .h5, .tr0, .trc, and .bin
- Remotely connect to the Tektronix 4/5/6 Series MSO to acquire data in real-time
- Share the data remotely with your colleagues so that they can perform analysis and make measurements as if they were sitting in front of the oscilloscope
- Synchronize waveforms from the multiple oscilloscopes in real-time
- Perform advanced analysis even if your oscilloscope is not equipped with TekScope PC analysis software
TekDrive collaborative test and measurement workspace
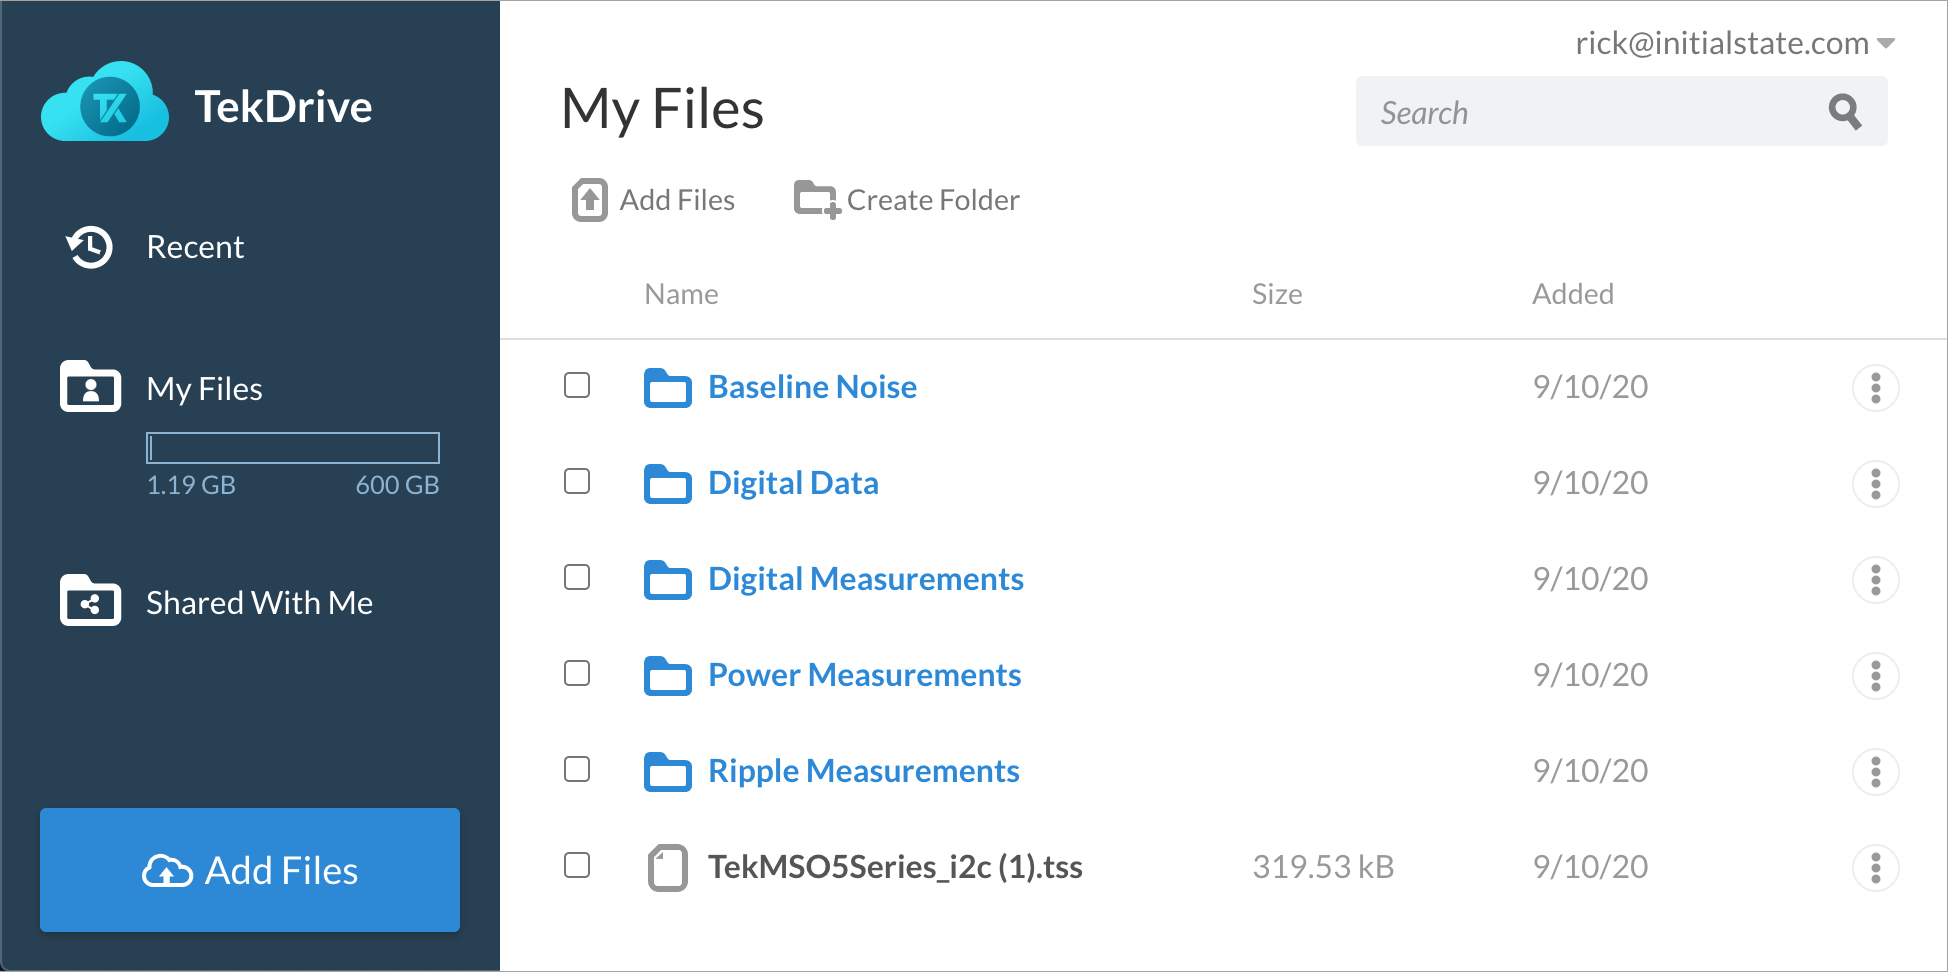
Using TekDrive, you can upload, store, organize, search, download, and share any file type from any connected device. TekDrive is natively integrated into the instrument for seamless sharing and recalling of files - no USB stick is required. Analyze and explore standard files like .wfm, .isf, .tss, and .csv, directly in a browser with smooth interactive waveform viewers. TekDrive is purpose built for integration, automation, and security.
Arbitrary/Function Generator (AFG)
The instrument contains an optional integrated arbitrary/function generator, perfect for simulating sensor signals within a design or adding noise to signals to perform margin testing. The integrated function generator provides output of predefined waveforms up to MHz for sine, square, pulse, ramp/triangle, DC, noise, sin(x)/x (Sinc), Gaussian, Lorentz, exponential rise/fall, Haversine and cardiac. The AFG can load waveform records up to 128 k points in size from an internal file location or a USB mass storage device.
The AFG feature is compatible with Tektronix' ArbExpress PC-based waveform creation and editing software, making creation of complex waveforms fast and easy.
Digital Voltmeter (DVM) and Trigger Frequency Counter
The instrument contains an integrated 4-digit digital voltmeter (DVM) and 8-digit trigger frequency counter. Any of the analog inputs can be a source for the voltmeter, using the same probes that are already attached for general oscilloscope usage. The trigger frequency counter provides a very precise readout of the frequency of the trigger event on which you’re triggering.
Both the DVM and trigger frequency counter are available for free and are activated when you register your product.
Enhanced security
The 4 Series MSO provides you with the option to protect company data through the Security menu. This includes the option to restrict access to the instrument by password-protecting remote network access, I/O ports, and firmware updates to ensure the security of the data. By default, the oscilloscope disables remote access on initial use and gives you the option to enable remote access with or without a password.
To clear user data, run TekSecure from the menu. Sanitize the oscilloscope by removing the SSD from the bottom of the instrument. 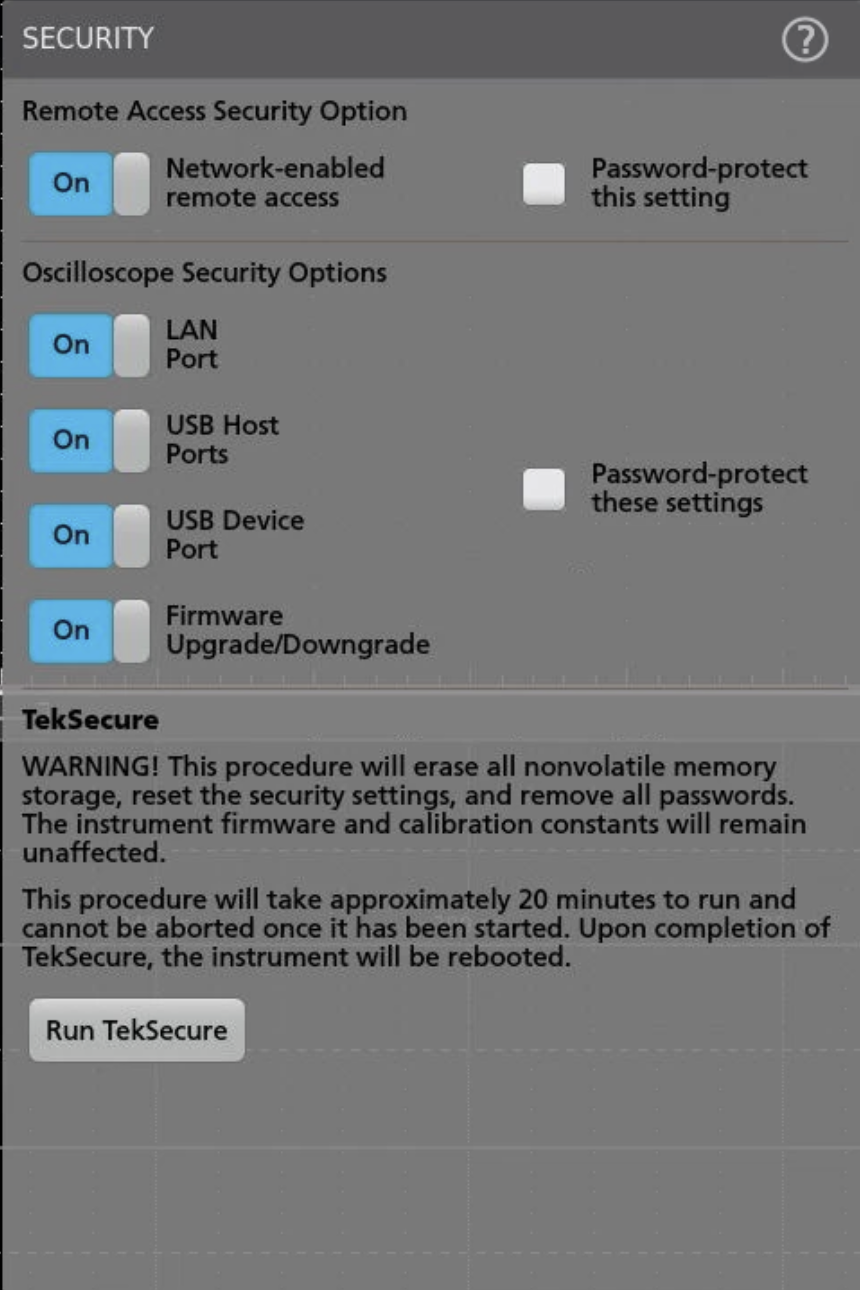
Help when you need it
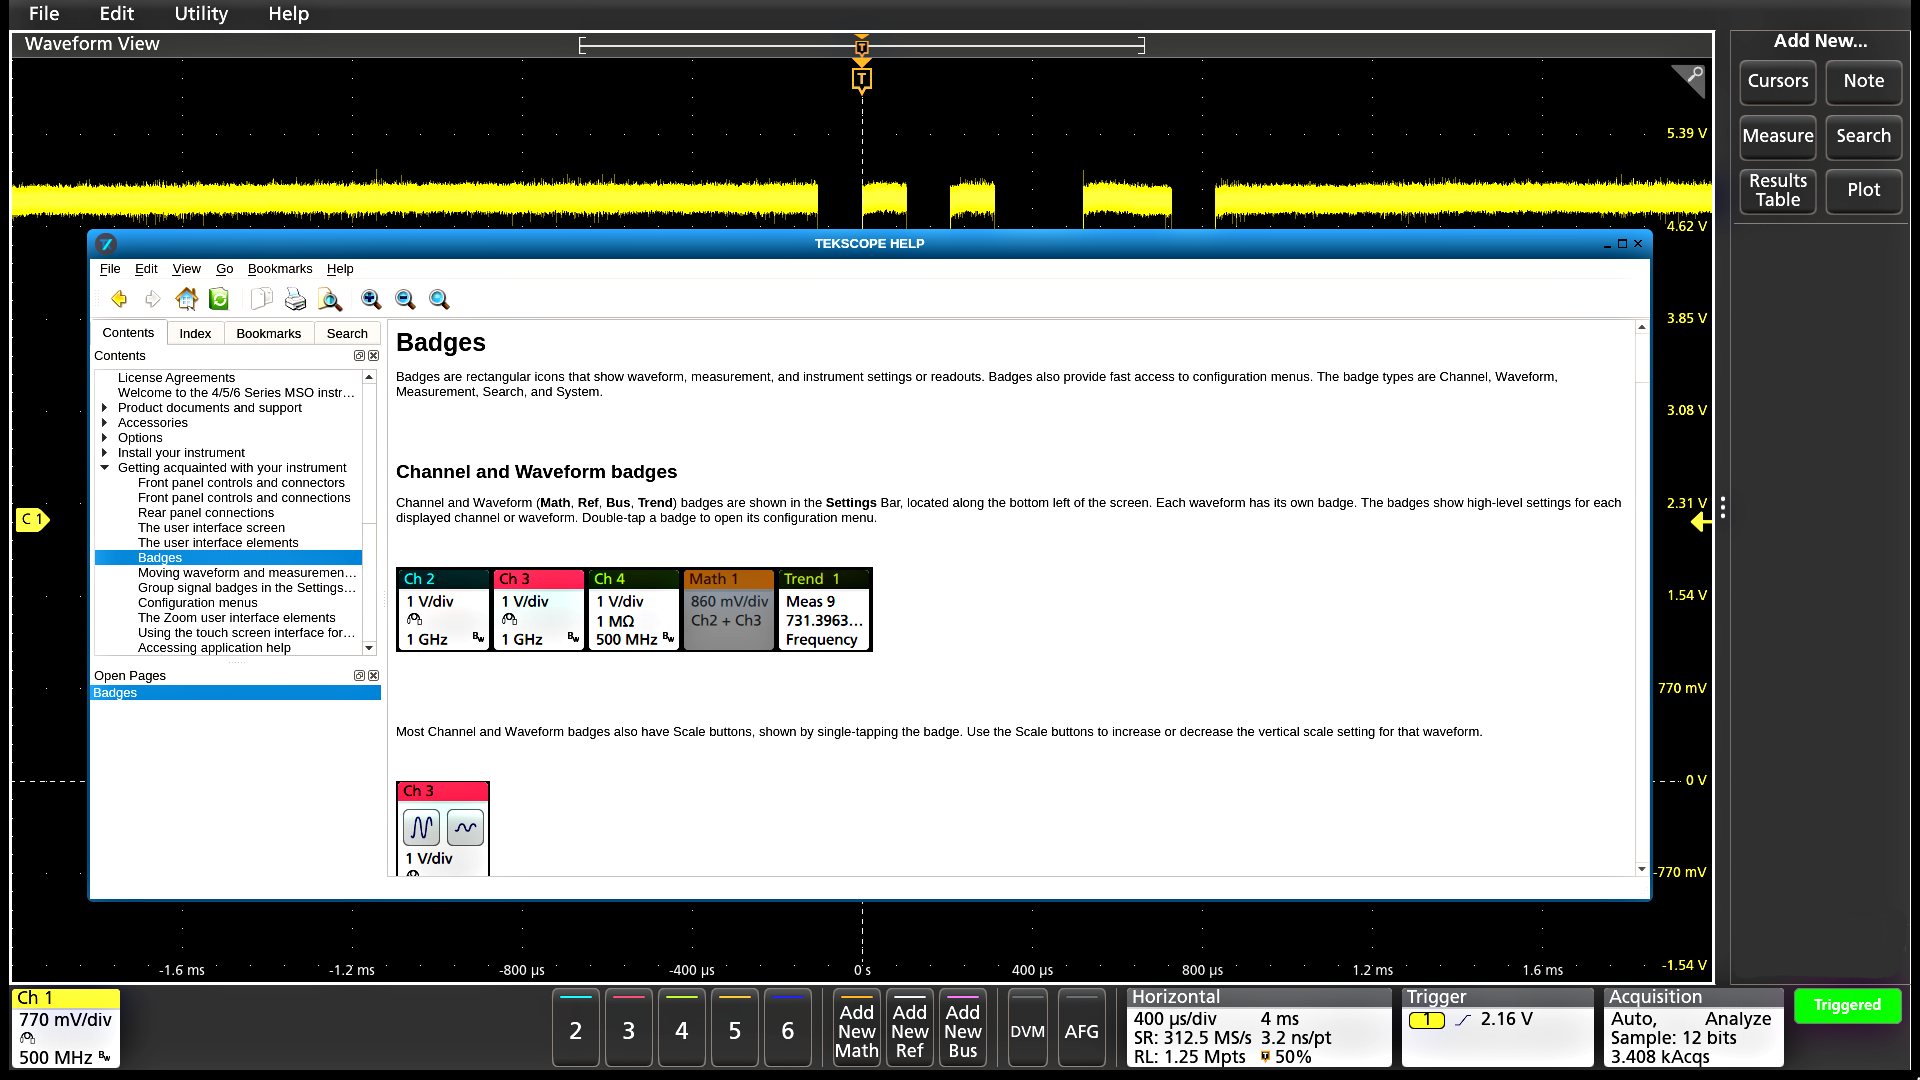
Several helpful resources are included so you can get your questions answered rapidly without having to find a manual or go to a website:
- Graphical images and explanatory text are used in numerous menus to provide quick feature overviews.
- All menus include a question mark icon in the upper right that takes you directly to the portion of the integrated help system that applies to that menu.
- A short user interface tutorial is included in the Help menu for new users to come up to speed on the instrument in a matter of a few minutes.
Specifications
All specifications are guaranteed and apply to all models unless noted otherwise.
Model overview
| MSO44 | MSO46 | ||
|---|---|---|---|
| FlexChannel inputs | 4 | 6 | |
| Maximum analog channels | 4 | 6 | |
| Maximum digital channels (with optional logic probes) | 32 | 48 | |
| Auxiliary Trigger Input | ≤300 V RMS (Edge Trigger only) | ||
| Bandwidth (calculated rise time) | 200 MHz (2.3 ns), 350 MHz (1.3 ns), 500 MHz (900 ps), 1 GHz (450 ps), 1.5 GHz (333 ps) | ||
| DC Gain Accuracy | 50 Ω: ±1%, (±2.5% at 1 mV/Div and 500 µV/Div settings), de-rated at 0.100%/°C above 30 °C 1 MΩ and 250 kΩ: ±1.0%, (±2.0% at 1 mV/Div and 500 µV/Div settings) | ||
| ADC Resolution | 12 bits | ||
| Vertical Resolution | 8 bits @ 6.25 GS/s 12 bits @ 3.125 GS/s 13 bits @ 1.25 GS/s (High Res) 14 bits @ 625 MS/s (High Res) 15 bits @ 312.5 MS/s (High Res) 16 bits @ ≤125 MS/s (High Res) | ||
| Sample Rate | 6.25 GS/s on all analog / digital channels (160 ps resolution) | ||
| Record Length (std.) | 31.25 Mpoints on all analog / digital channels | ||
| Record Length (opt.) | 62.5 Mpoints on all analog / digital channels | ||
| Waveform Capture Rate, typical | >500,000 wfms/s | ||
| Arbitrary/Function Generator (opt.) | 13 predefined waveform types with up to 50 MHz output | ||
| DVM | 4-digit DVM (free with product registration) | ||
| Trigger Frequency Counter | 8-digit frequency counter (free with product registration) | ||
Vertical system- analog channels
- Bandwidth selections
- 50 Ω: 20 MHz, 250 MHz, and the full bandwidth value of your model
- 1 MΩ: 20 MHz, 250 MHz, 500 MHz
- Input coupling
- DC, AC
- Input impedance
- 50 Ω ± 1%
- 1 MΩ ± 1% with 13.0 pF ± 1.5 pF
- Input sensitivity range
- 1 MΩ
- 500 µV/div to 10 V/div in a 1-2-5 sequence
- 50 Ω
- 500 µV/div to 1 V/div in a 1-2-5 sequence
- 500 μV/div is a 2X digital zoom of 1 mV/div or a 4x digital zoom of 2 mV/div, depending on the instrument bandwidth configuration
- Maximum input voltage
- 50 Ω: 5 VRMS, with peaks ≤ ±20 V (DF ≤ 6.25%)
- 1 MΩ: 300 VRMS
- Derate at 20 dB/decade between 4.5 MHz and 45 MHz; derate 14 dB/decade between 45 MHz and 450 MHz. Above 450 MHz, 5.5 VRMS
- Effective bits (ENOB), typical
- High Res mode, 50 Ω, 10 MHz input with 90% full screen
Bandwidth ENOB 1.5 GHz 7.1 1 GHz 7.6 500 MHz 7.9 350 MHz 8.2 250 MHz 8.2 20 MHz 8.9
- Calculated rise time, typical
Model 50 Ω TP1000 Probe TPP0500 Probe TPP0250 Probe 500 µV-1 V 5 mV-10 V 5 mV-10 V 5 mV-10 V 1.5 GHz 333ps 450ps 900ps 1.8ns 1 GHz 450ps 450ps 900ps 1.8ns 500 MHz 900ps 900ps 900ps 1.8ns 350 MHz 1.3ns 1.3ns 1.3ns 1.8ns 200 MHz 2.3ns 2.3ns 2.3ns 2.3ns
- Random noise, RMS, typical
- 1.5 GHz, 1 GHz, 500 MHz, 350 MHz, 200 MHz models, High Res mode (RMS), typical
50 Ω 1 MΩ V/div 1 GHz 500 MHz 350 MHz 250 MHz 20 MHz 500 MHz 350 MHz 250 MHz 20 MHz ≤1 mV/div 260 μV 200 μV 150 μV 125 μV 75.0 μV 200 μV 140 μV 120 μV 75.0 μV 2 mV/div 280 μV 200 μV 150 μV 125 μV 75.0 μV 200 μV 140 μV 120 μV 75.0 μV 5 mV/div 305 μV 235 μV 185 μV 135 μV 75.0 μV 210 μV 150 μV 130 μV 75.0 μV 10 mV/div 335 μV 275 μV 220 μV 160 μV 80.0 μV 230 μV 160 μV 150 μV 80.0 μV 20 mV/div 425 μV 360 μV 270 μV 230 μV 110 μV 280 μV 200 μV 200 μV 100 μV 50 mV/div 800 μV 800 μV 570 μV 460 μV 200 μV 520 μV 370 μV 410 μV 180 μV 100 mV/div 1.62 mV 1.23 mV 1.04 mV 1.04 mV 470 μV 1.24 mV 880 μV 930 μV 460 μV 1 V/div 13.0 mV 9.90 mV 8.95 mV 8.95 mV 3.78 mV 14.30 mV 10.20 mV 10.30 mV 5.45 mV
- DC gain accuracy
- 50 Ohm
±2.0%1 (±2.0% at 2 mV/div, ±4% at 1 mV/div, typical)
±1.0%2 of full scale, (±1.0% of full scale at 2 mV/div, ± 2% at 1 mV/div, typical)
- Position range
- ±5 divisions
- Offset ranges, maximum
- All models
- Input signal cannot exceed maximum input voltage for the 50 Ω input path.
Volts/div Setting Maximum offset range, 50 Ω Input 1 mV/div - 99 mV/div ±1 V 100 mV/div - 1 V/div ±10 V Volts/div Setting Maximum offset range, 50 Ω Input 500 µV/div - 99 mV/div ±1 V 100 mV/div - 1 V/div ±10 V Volts/div Setting Maximum offset range, 1 MΩ Input 500 µV/div - 63 mV/div ±1 V 64 mV/div - 999 mV/div ±10 V 1 V/div - 10 V/div ±100 V
- Offset accuracy
±(0.005 X | offset - position | + 0.2 div (0.4 div in 500 μV/div))
- Crosstalk (channel isolation), typical
- ≥ 200:1 up to the rated bandwidth for any two channels having equal Volts/div settings
Vertical system - digital channels
- Number of channels
- 8 digital inputs (D7-D0) per installed TLP058 (traded off for one analog channel)
- Vertical resolution
- 1 bit
- Minimum detectable pulse width, typical
- 1 ns
- Thresholds
- One threshold per digital channel
- Threshold range
- ±40 V
- Threshold resolution
- 10 mV
- Threshold accuracy
± [100 mV + 3% of threshold setting after calibration]
- Input hysteresis, typical
- 100 mV at the probe tip
- Input dynamic range, typical
- 30 Vpp for Fin ≤ 200 MHz, 10 Vpp for Fin > 200 MHz
- Absolute maximum input voltage, typical
- ±42 V peak
- Minimum voltage swing, typical
- 400 mV peak-to-peak
- Input impedance, typical
- 100 kΩ
- Probe loading, typical
- 2 pF
Horizontal system
- Time base range
- 200 ps/div to 1,000 s/div
- Sample rate range
- 1.5625 S/s to 6.25 GS/s (real time)
- 12.5 GS/s to 500 GS/s (interpolated)
- Record length range
- Standard
- 1 kpoints to 31.25 Mpoints in single sample increments
- Optional
- 62.5 Mpoints
- Aperture uncertainty
- ≤ 0.450 ps + (10-11 * Measurement Duration)RMS, for measurements having duration ≤ 100 ms
- Timebase accuracy
- ±2.5 x 10⁻⁶ over any ≥1 ms time interval
Description Specification Factory Tolerance ±5.0 x10⁻⁷ ; at calibration, 25 °C ambient, over any ≥1 ms interval Temperature stability, typical ±5.0 x10⁻⁷ ; tested at operating temperatures Crystal aging ±1.5 x 10⁻⁶ ; frequency tolerance change at 25 °C over a period of 1 year
- Delta-time measurement accuracy, nominal

(assume edge shape that results from Gaussian filter response)
The formula to calculate delta-time measurement accuracy (DTA) for a given instrument setting and input signal assumes insignificant signal content above Nyquist frequency, where:
SR 1 = Slew Rate (1st Edge) around 1st point in measurement
SR 2 = Slew Rate (2nd Edge) around 2nd point in measurement
N = input-referred guaranteed noise limit (VRMS)
TBA = time base accuracy or reference frequency error
t p = delta-time measurement duration (sec)
- Maximum duration at highest sample rate
- 5 ms (std.) or 10 ms (opt.)
- Time base delay time range
- -10 divisions to 5,000 s
- Deskew range
- -125 ns to +125 ns with a resolution of 40 ps
- Delay between analog channels, full bandwidth, typical
≤ 100 ps for any two channels with input impedance set to 50 Ω, DC coupling with equal Volts/div or above 10 mV/div
- Delay between analog and digital FlexChannels, typical
- 3 ns when using a TLP058 and a passive probe matching the bandwidth of the scope, with no bandwidth limits applied
- Delay between any two digital FlexChannels, typical
- 3 ns from bit 0 of a FlexChannel to bit 0 of any other FlexChannel
- Delay between any two bits of a digital FlexChannel, typical
- 160 ps
Trigger system
- Trigger modes
- Auto, Normal, and Single
- Trigger coupling
DC, HF Reject (attenuates > 50 kHz), LF Reject (attenuates < 50 kHz), noise reject (reduces sensitivity)
- Trigger holdoff range
- 0 ns to 20 seconds
- Edge-type trigger sensitivity, DC coupled, typical
Path Range Specification 1 MΩ path (all models) 0.5 mV/div to 0.99 mV/div 4.5 div from DC to instrument bandwidth ≥ 1 mV/div The greater of 5 mV or 0.7 div 50 Ω path, all models The greater of 5.6 mV or 0.7 div for frequencies between DC and 500 MHz or the instrument bandwidth (whichever is lower) The greater of 7 mV or 0.8 div for frequencies above 500 MHz (if applicable)
- Trigger jitter, typical
- ≤ 7 psRMS for sample mode and edge-type trigger
- Trigger level ranges
- This specification applies to logic and pulse thresholds.
Source Range Any Channel ±5 divs from center of screen Aux In Trigger, typical ±8 V Line Fixed at about 50% of line voltage
- Trigger types
- Edge:
- Positive, negative, or either slope on any channel. Coupling includes DC, AC, noise reject, HF reject, and LF reject
- Pulse Width:
Trigger on width of positive or negative pulses. Event can be time- or logic-qualified
- Timeout:
- Trigger on an event which remains high, low, or either, for a specified time period. Event can be logic-qualified
- Runt:
- Trigger on a pulse that crosses one threshold but fails to cross a second threshold before crossing the first again. Event can be time- or logic-qualified
- Window:
- Trigger on an event that enters, exits, stays inside or stays outside of a window defined by two user-adjustable thresholds. Event can be time- or logic-qualified
- Logic:
- Trigger when logic pattern goes true, goes false, or occurs coincident with a clock edge. Pattern (AND, OR, NAND, NOR) specified for all input channels defined as high, low, or don't care. Logic pattern going true can be time-qualified
- Setup & Hold:
- Trigger on violations of both setup time and hold time between clock and data present on any input channels
- Rise / Fall Time:
- Trigger on pulse edge rates that are faster or slower than specified. Slope may be positive, negative, or either. Event can be logic-qualified
- Video (option 4-VID):
- Trigger on all lines, odd, even, or all fields of NTSC, PAL, and SECAM video signals
- Sequence:
- Trigger on B event X time or N events after A trigger with a reset on C event. In general, A and B trigger events can be set to any trigger type with a few exceptions: logic qualification is not supported, if A event or B event is set to Setup & Hold, then the other must be set to Edge, and Ethernet and High Speed USB (480 Mbps) are not supported
- Visual trigger
- Qualifies standard triggers by scanning all waveform acquisitions and comparing them to on-screen areas (geometric shapes). An unlimited number of areas can be defined with In, Out, or Don't Care as the qualifier for each area. A boolean expression can be defined using any combination of visual trigger areas to further qualify the events that get stored into acquisition memory. Shapes include rectangle, triangle, trapezoid, hexagon and user-defined.
- Parallel Bus:
- Trigger on a parallel bus data value. Parallel bus can be from 1 to 48 bits (from the digital and analog channels) in size. Supports Binary and Hex radices
- I2C Bus (option 4-SREMBD):
- Trigger on Start, Repeated Start, Stop, Missing ACK, Address (7 or 10 bit), Data, or Address and Data on I2C buses up to 10 Mb/s
- I3C Bus (option 4-SRI3C)
- Trigger on Start, Repeated Start, Stop, Address, Data, I3C SDR Direct, I3C SDR Broadcast, Missing ACK, T-Bit Error, Broadcast Address Error, Hot-Join, HDR Restart, HDR Exit on I3C buses up to 10 Mb/s
- SPI Bus (option 4-SREMBD):
- Trigger on Slave Select, Idle Time, or Data (1-16 words) on SPI buses up to 20 Mb/s
- RS-232/422/485/UART Bus (option 4-SRCOMP):
- Trigger on Start Bit, End of Packet, Data, and Parity Error up to 15 Mb/s
- CAN Bus (option 4-SRAUTO):
- Trigger on Start of Frame, Type of Frame (Data, Remote, Error, or Overload), Identifier, Data, Identifier and Data, End Of Frame, Missing Ack, and Bit Stuff Error on CAN buses up to 1 Mb/s
- CAN FD Bus (option 4-SRAUTO):
- Trigger on Start of Frame, Type of Frame (Data, Remote, Error, or Overload), Identifier (Standard or Extended), Data (1-8 bytes), Identifier and Data, End Of Frame, Error (Missing Ack, Bit Stuffing Error, FD Form Error, Any Error) on CAN FD buses up to 16 Mb/s
- LIN Bus (option 4-SRAUTO):
- Trigger on Sync, Identifier, Data, Identifier and Data, Wakeup Frame, Sleep Frame, and Error on LIN buses up to 1 Mb/s
- FlexRay Bus (option 4-SRAUTO):
- Trigger on Start of Frame, Indicator Bits (Normal, Payload, Null, Sync, Startup), Frame ID, Cycle Count, Header Fields (Indicator Bits, Identifier, Payload Length, Header CRC, and Cycle Count), Identifier, Data, Identifier and Data, End Of Frame, and Errors on FlexRay buses up to 10 Mb/s
- SENT Bus (option 4-SRAUTOSEN)
- Trigger on Start of Packet, Fast Channel Status and Data, Slow Channel Message ID and Data, and CRC Errors
- SPMI Bus (option 4-SRPM):
- Trigger on Sequence Start Condition, Reset, Sleep, Shutdown, Wakeup, Authenticate, Master Read, Master Write, Register Read, Register Write, Extended Register Read, Extended Register Write, Extended Register Read Long, Extended Register Write Long, Device Descriptor Block Master Read, Device Descriptor Block Slave Read, Register 0 Write, Transfer Bus Ownership, and Parity Error
- USB 2.0 LS/FS/HS Bus (option 4-SRUSB2):
- Trigger on Sync, Reset, Suspend, Resume, End of Packet, Token (Address) Packet, Data Packet, Handshake Packet, Special Packet, Error on USB buses up to 480 Mb/s
- Ethernet Bus (option 4-SRENET):
- Trigger on Start of Frame, MAC Addresses, MAC Q-tag, MAC Length/Type, MAC Data, IP Header, TCP Header, TCP/IPV4 Data, End of Packet, and FCS (CRC) Error on 10BASE-T and 100BASE-TX buses
- Audio (I2S, LJ, RJ, TDM) Bus (option 4-SRAUDIO):
- Trigger on Word Select, Frame Sync, or Data. Maximum data rate for I2S/LJ/RJ is 12.5 Mb/s. Maximum data rate for TDM is 25 Mb/s
- MIL-STD-1553 Bus (option 4-SRAERO):
- Trigger on Sync, Command (Transmit/Receive Bit, Parity, Subaddress / Mode, Word Count / Mode Count, RT Address), Status (Parity, Message Error, Instrumentation, Service Request, Broadcast Command Received, Busy, Subsystem Flag, Dynamic Bus Control Acceptance, Terminal Flag), Data, Time (RT/IMG), and Error (Parity Error, Sync Error, Manchester Error, Non-contiguous Data) on MIL-STD-1553 buses
- ARINC 429 Bus (option 4-SRAERO):
- Trigger on Word Start, Label, Data, Label and Data, Word End, and Error (Any Error, Parity Error, Word Error, Gap Error) on ARINC 429 buses up to 1 Mb/s
- RF Magnitude vs. Time and RF Frequency vs. Time (option 4-SV-RFVT):
- Trigger on edge, pulse width and timeout events
Acquisition system
- Sample
- Acquires sampled values
- Peak Detect
- Captures glitches as narrow as 640 ps at all sweep speeds
- Averaging
- From 2 to 10,240 waveforms
- Fast Hardware Averaging
- An acquisition mode for acquiring a large number of averages in a short amount of time. Fast hardware averaging optimizes the acquisition path, reducing storage truncation error and smoothing out fine scale non-linearity imperfections via an optional offset dithering technique. This feature is available through programmatic interface commands.
- From 2 to 1,000,000 waveforms
- Maximum averaging speed = 32,000 waveforms/s
- Envelope
- Min-max envelope reflecting Peak Detect data over multiple acquisitions
- High Res
Applies a unique Finite Impulse Response (FIR) filter for each sample rate that maintains the maximum bandwidth possible for that sample rate while preventing aliasing and removing noise from the oscilloscope amplifiers and ADC above the usable bandwidth for the selected sample rate.
High Res mode always provides at least 12 bits of vertical resolution and extends all the way to 16 bits of vertical resolution at ≤ 125 MS/s sample rates.
- FastAcq®
FastAcq optimizes the instrument for analysis of dynamic signals and capture of infrequent events by capturing >500,000 wfms/s (one channel active; >100K wfms/s with all channels active).
- Roll mode
- Scrolls sequential waveform points across the display in a right-to-left rolling motion, at timebase speeds of 40 ms/div and slower, when in Auto trigger mode.
- History mode
- Makes use of the maximum record length, allowing you to capture many triggered acquisitions, stop when you see something of interest, and quickly review all stored triggered acquisitions.
The number of available acquisitions stored in history is (Maximum record length) / (Current record length setting).
- FastFrame™
Acquisition memory divided into segments.
Maximum trigger rate >5,000,000 waveforms per second
Minimum frame size = 50 points
Maximum Number of Frames: For frame size ≥ 1,000 points, maximum number of frames = record length / frame size.
For 50 point frames, maximum number of frames = 1,500,000
Waveform measurements
- Cursor types
- Waveform, V Bars, H Bars, V&H Bars, and Polar (XY/XYZ plots only)
- DC voltage measurement accuracy, Average acquisition mode
Measurement Type DC Accuracy (In Volts) Average of ≥ 16 waveforms ±((DC Gain Accuracy) * |reading - (offset - position)| + Offset Accuracy + 0.1 * V/div setting) Delta volts between any two averages of ≥ 16 waveforms acquired with the same oscilloscope setup and ambient conditions ±(DC Gain Accuracy * |reading| + 0.05 div)
- Automatic measurements
- 36, of which an unlimited number can be displayed as either individual measurement badges or collectively in a measurement results table
- Amplitude measurements
- Amplitude, Maximum, Minimum, Peak-to-Peak, Positive Overshoot, Negative Overshoot, Mean, RMS, AC RMS, Top, Base, and Area
- Timing measurements
- Period, Frequency, Unit Interval, Data Rate, Positive Pulse Width, Negative Pulse Width, Skew, Delay, Rise Time, Fall Time, Phase, Rising Slew Rate, Falling Slew Rate, Burst Width, Positive Duty Cycle, Negative Duty Cycle, Time Outside Level, Setup Time, Hold Time, Duration N-Periods, High Time, Low Time, Time to Minimum, and Time to Maximum
- Measurement statistics
- Mean, Standard Deviation, Maximum, Minimum, and Population. Statistics are available on both the current acquisition and all acquisitions
- Reference levels
- User-definable reference levels for automatic measurements can be specified in either percent or units. Reference levels can be set to global for all measurements, per source channel or signal, or unique for each measurement
- Gating
- Screen, Cursors, Logic, Search, or Time. Specifies the region of an acquisition in which to take measurements. Gating can be set to Global (affects all measurements set to Global) or Local (all measurements can have a unique Time gate setting; only one Local gate is available for Screen, Cursors, Logic, and Search actions).
- Measurement plots
- Histogram, Time Trend, and Spectrum
- Measurement limits
- Pass/fail testing for user-definable limits on measurement values. Act on event for measurement value failures include Save Screen Capture, Save Waveform, System Request (SRQ), and Stop Acquisitions
- Three-phase electrical analysis (option 4-3PHASE) adds the following:
- Measurements
Input Analysis (Power Quality, Harmonics, Input Voltage, Input Current, Input Power)
Ripple analysis (Line ripple, Switching Ripple)
Output analysis (Phasor Diagram)
- Measurement plots
Harmonics Bar Graph, Phasor Diagram
- Power analysis (option 4-PWR-BAS) and advanced power analysis (option 4-PWR) adds the following:
- Measurements
Input Analysis (Frequency, VRMS, IRMS, voltage and current Crest Factors, True Power, Apparent Power, Reactive Power, Power Factor, Phase Angle, Harmonics, Inrush Current, Input Capacitance )
Amplitude Analysis (Cycle Amplitude, Cycle Top, Cycle Base, Cycle Maximum, Cycle Minimum, Cycle Peak-to-Peak)
Timing Analysis (Period, Frequency, Negative Duty Cycle, Positive Duty Cycle, Negative Pulse Width, Positive Pulse Width)
Switching Analysis (Switching Loss, dv/dt, di/dt, Safe Operating Area, RDSon)
Output Analysis (Line Ripple, Switching Ripple, Efficiency, Turn-on Time, Turn-off Time)
Magnetic Analysis (Inductance, I vs. Intg(V), Magnetic Loss, Magnetic Property)- with option 4-PWR only
Frequency Response Analysis (Control Loop Response Bode Plot, Power Supply Rejection Ratio, Impedance) - with options 4-PWR only
- Measurement Plots
- Harmonics Bar Graph, Switching Loss Trajectory Plot, and Safe Operating Area
- Measurement limits
- Pass/fail testing for user-definable limits on measurement values. Act on event for measurement value failures include Save Screen Capture, Save Waveform, System Request (SRQ), and Stop Acquisitions
Waveform math
- Number of math waveforms
- Unlimited
- Arithmetic
- Add, subtract, multiply, and divide waveforms and scalars
- Algebraic expressions
- Define extensive algebraic expressions including waveforms, scalars, user-adjustable variables, and results of parametric measurements. Perform math on math using complex equations. For example (Integral (CH1 - Mean(CH1)) X 1.414 X VAR1)
- Math functions
- Invert, Integrate, Differentiate, Square Root, Exponential, Log 10, Log e, Abs, Ceiling, Floor, Min, Max, Degrees, Radians, Sin, Cos, Tan, ASin, ACos, and ATan
- Relational
- Boolean result of comparison >, <, ≥, ≤, =, and ≠
- Logic
- AND, OR, NAND, NOR, XOR, and EQV
- Filtering function (standard)
- Loading of user-definable filters. Users specify a file containing the coefficients of the filter.
- FFT functions
- Spectral Magnitude and Phase, and Real and Imaginary Spectra
- FFT vertical units
Magnitude: Linear and Log (dBm)
Phase: Degrees, Radians, and Group Delay
- FFT window functions
- Hanning, Rectangular, Hamming, Blackman-Harris, Flattop2, Gaussian, Kaiser-Bessel, and TekExp
Spectrum View
- Center Frequency
- Limited by instrument analog bandwidth
- Span
- 18.6 Hz to 312.5 MHz
18.6 Hz to 500 MHz (with option 4 -SV-BW-1)
Coarse adjustment in a 1-2-5 sequence
- RF Measurements
- Channel Power (CHP), Adjacent Channel Power Ratio (ACPR), and Occupied Bandwidth (OBW) measurements on Spectrum View trace data and display
- RF vs. Time Traces
- Magnitude vs. time, Frequency vs. time, Phase vs. time (with option 4-SV-RFVT)
- RF vs. Time Trigger
- Edge, pulse width, and timeout trigger on RF Magnitude vs. Time and RF Frequency vs. Time (with option 4-SV-RFVT)
- Spectrograms
- RF Frequency vs. Time vs. Amplitude display with frequency on x-axis, time on y-axis, and power level indicated by variations in color (with option 4-SV-RFVT)
- Resolution Bandwidth (RBW)
18.6 μHz to 15.625 MHz
18.6 μHz to 25 MHz (with option 4-SV-BW-1)
- IQ capture
- The data is stored as in-phase and quadrature (I&Q) samples and precise synchronization is maintained between the time domain data and the I&Q data.
- When RF vs. Time traces are activated (with option 4-SV-RFVT), IQ data can be captured and exported to file for more analysis within 3rd party applications.
- The max acquisition time varies with span and sample rate. At 6.25 GS/s and 500 MHz span, the max acquisition time is 0.021 seconds. For 312.5 MHz span, the max acquisition time is 0.043 seconds. For 40 MHz span, the max acquisition time is 0.172 seconds. For 1 MHz span, the max acquisition time is 10.995 seconds.
- Window types and factors
Window type Factor Blackman-Harris 1.90 Flat-Top 2 3.77 Hamming 1.30 Hanning 1.44 Kaiser-Bessel 2.23 Rectangular 0.89
- Spectrum Time
- FFT Window Factor / RBW
- Reference level
- Reference level is automatically set by the analog channel Volts/div setting
- Setting range: -42 dBm to +44 dBm
- Vertical Position
- -100 divs to +100 divs
- Vertical units
- dBm, dBµW, dBmV, dBµV, dBmA, dBµA
- Horizontal scaling
- Linear, Log
- Multi-channel spectrum analysis
- Each FlexChannel input can be configured with Spectrum View, RF vs. Time traces (with option RFVT), and Spectrogram (with option RFVT).
- Multiple RF measurements can be performed simultaneously across channels.
- Spectrum Time and Center Frequency settings can be unlocked and moved independently from each other across channels. All Spectrum View channels must share the same Span, Resolution Bandwidth and Window Type.
Search
- Number of searches
- Unlimited
- Search types
- Search through long records to find all occurrences of user specified criteria including edges, pulse widths, timeouts, runt pulses, window violations, logic patterns, setup & hold violations, rise/fall times, and bus protocol events. Search results can be viewed in the Waveform View or in the Results table.
Save
- Save
- Save files directly to the oscilloscope or USB media, to a remote network drive, or to your TekDrive collaboration workspace.
- Waveform type
- Tektronix Waveform Data (.wfm), Comma Separated Values (.csv), MATLAB (.mat)
- Waveform gating
- Cursors, Screen, Resample (save every nth sample)
- Screen capture type
- Portable Network Graphic (*.png)
- Setup type
- Tektronix Setup (.set)
- Report type
- Adobe Portable Documents (.pdf), Single File web Pages (.mht)
- Session type
- Tektronix Session Setup (.tss)
Display
- Display type
- 13.3 in. (338 mm) liquid-crystal TFT color display
- Display resolution
- 1,920 horizontal × 1,080 vertical pixels
- Display modes
Overlay: traditional oscilloscope display where traces overlay each other
Stacked: display mode where each waveform is placed in its own slice and can take advantage of the full ADC range while still being visually separated from other waveforms. Groups of channels can also be overlaid within a slice to simplify visual comparison of signals.
- Zoom
- Horizontal and vertical zooming is supported in all waveform and plot views.
- Interpolation
- Sin(x)/x and Linear
- Waveform styles
- Vectors, dots, variable persistence, and infinite persistence
- Graticules
- Movable and fixed graticules, selectable between Grid, Time, Full, and None
- Color palettes
Normal and inverted for screen captures
Individual waveform colors are user-selectable
- Format
- YT, XY, and XYZ
- Local Language User Interface
- English, Japanese, Simplified Chinese, Traditional Chinese, French, German, Italian, Spanish, Portuguese, Russian, Korean
- Local Language Help
- English, Japanese, Simplified Chinese
Arbitrary-Function Generator (optional)
- Function types
- Arbitrary, sine, square, pulse, ramp, triangle, DC level, Gaussian, Lorentz, exponential rise/fall, sin(x)/x, random noise, Haversine, Cardiac
- Sine waveform
- Frequency range
- 0.1 Hz to MHz
- Frequency setting resolution
- 0.1 Hz
- Frequency accuracy
- 130 ppm (frequency ≤ 10 kHz), 50 ppm (frequency > 10 kHz)
- This is for Sine, Ramp, Square and Pulse waveforms only.
- Amplitude range
- 20 mVpp to 5 Vpp into Hi-Z; 10 mVpp to 2.5 Vpp into 50 Ω
- Amplitude flatness, typical
- ±0.5 dB at 1 kHz
- ±1.5 dB at 1 kHz for < 20 mVpp amplitudes
- Total harmonic distortion, typical
- 1% for amplitude ≥ 200 mVpp into 50 Ω load
- 2.5% for amplitude > 50 mV AND < 200 mVpp into 50 Ω load
- This is for Sine wave only.
- Spurious free dynamic range, typical
- 40 dB (Vpp ≥ 0.1 V); 30 dB (Vpp ≥ 0.02 V), 50 Ω load
- Square and pulse waveform
- Frequency range
- 0.1 Hz to MHz
- Frequency setting resolution
- 0.1 Hz
- Frequency accuracy
- 130 ppm (frequency ≤ 10 kHz), 50 ppm (frequency > 10 kHz)
- Amplitude range
- 20 mVpp to 5 Vpp into Hi-Z; 10 mVpp to 2.5 Vpp into 50 Ω
- Duty cycle range
- 10% - 90% or 10 ns minimum pulse, whichever is larger
- Minimum pulse time applies to both on and off time, so maximum duty cycle will reduce at higher frequencies to maintain 10 ns off time
- Duty cycle resolution
- 0.1%
- Minimum pulse width, typical
- 10 ns. This is the minimum time for either on or off duration.
- Rise/Fall time, typical
- 5.5 ns, 10% - 90%
- Pulse width resolution
- 100 ps
- Overshoot, typical
- < 4 % for signal steps greater than 100 mVpp
- This applies to overshoot of the positive-going transition (+overshoot) and of the negative-going (-overshoot) transition
- Asymmetry, typical
- ±1% ±5 ns, at 50% duty cycle
- Jitter, typical
- < 60 ps TIERMS, ≥ 100 mVpp amplitude, 40%-60% duty cycle
- Ramp and triangle waveform
- Frequency range
- 0.1 Hz to
- Frequency setting resolution
- 0.1 Hz
- Frequency accuracy
- 130 ppm (frequency ≤ 10 kHz), 50 ppm (frequency > 10 kHz)
- Amplitude range
- 20 mVpp to 5 Vpp into Hi-Z; 10 mVpp to 2.5 Vpp into 50 Ω
- Variable symmetry
- 0% - 100%
- Symmetry resolution
- 0.1%
- DC level range
±2.5 V into Hi-Z
±1.25 V into 50 Ω
- Random noise amplitude range
20 mVpp to 5 Vpp into Hi-Z
10 mVpp to 2.5 Vpp into 50 Ω
- Sin(x)/x
- Maximum frequency
- MHz
- Gaussian pulse, Haversine, and Lorentz pulse
- Maximum frequency
- MHz
- Lorentz pulse
- Frequency range
- 0.1 Hz to MHz
- Amplitude range
- 20 mVpp to 2.4 Vpp into Hi-Z
10 mVpp to 1.2 Vpp into 50 Ω
- Cardiac
- Frequency range
- 0.1 Hz to
- Amplitude range
- 20 mVpp to 5 Vpp into Hi-Z
10 mVpp to 2.5 Vpp into 50 Ω
- Arbitrary
- Memory depth
- 1 to 128 k
- Amplitude range
- 20 mVpp to 5 Vpp into Hi-Z
10 mVpp to 2.5 Vpp into 50 Ω
- Repetition rate
- 0.1 Hz to MHz
- Sample rate
- 250 MS/s
- Signal amplitude accuracy
- ±[ (1.5% of peak-to-peak amplitude setting) + (1.5% of absolute DC offset setting) + 1 mV ] (frequency = 1 kHz)
- Signal amplitude resolution
1 mV (Hi-Z)
500 μV (50 Ω)
- Sine and ramp frequency accuracy
- 1.3 x 10⁻⁴ (frequency ≤10 kHz)
- 5.0 x 10⁻⁵ (frequency >10 kHz)
- DC offset range
±2.5 V into Hi-Z
±1.25 V into 50 Ω
- DC offset resolution
1 mV (Hi-Z)
500 μV (50 Ω)
- DC offset accuracy
±[ (1.5% of absolute offset voltage setting) + 1 mV ]
Add 3 mV of uncertainty per 10 °C change from 25 °C ambient
Digital volt meter (DVM)
- Measurement types
DC, ACRMS+DC, ACRMS
- Voltage resolution
- 4 digits
- Voltage accuracy
- DC:
±((1.5% * |reading - offset - position|) + (0.5% * |(offset - position)|) + (0.1 * Volts/div))
De-rated at 0.100%/°C of |reading - offset - position| above 30 °C
Signal ± 5 divisions from screen center
- AC:
± 2% (40 Hz to 1 kHz) with no harmonic content outside 40 Hz to 1 kHz range
AC, typical: ± 2% (20 Hz to 10 kHz)
For AC measurements, the input channel vertical settings must allow the VPP input signal to cover between 4 and 10 divisions and must be fully visible on the screen
Trigger frequency counter
- Resolution
- 8-digits
- Accuracy
±(1 count + time base accuracy * input frequency)
The signal must be at least 8 mVpp or 2 div, whichever is greater.
- Maximum input frequency
- 10 Hz to maximum bandwidth of the analog channel
- The signal must be at least 8 mVpp or 2 div, whichever is greater.
Processor system
- Host processor
- ARM 1.5 GHz, 32-bit, dual core processor
- Operating system
- Closed Linux
- Internal storage
- 64 GB eMMC
Input-Output ports
- HDMI video port
A 29-pin HDMI connector
Supported resolution: 1920 x 1080 @ 60Hz (only). The monitor must be attached before powering on the instrument
- Probe compensator signal, typical
- Connection:
- Connectors are located on the lower right-hand side of the instrument
- Amplitude:
- 0 to 2.5 V
- Frequency:
- 1 kHz
- Source impedance:
- 1 kΩ
- External reference input
The time-base system can phase lock to an external 10 MHz reference signal (±4 ppm).
- USB interface (Host, Device ports)
- Front panel USB Host ports: Three USB 2.0 Hi-Speed ports
- Rear panel USB Host ports: Two USB 2.0 Hi-Speed ports
- Rear panel USB Device port: One USB 2.0 High Speed Device port providing USBTMC support
- Ethernet interface
- 10/100/1000 Mb/s
- Auxiliary output
Rear-panel BNC connector. Output can be configured to provide a positive or negative pulse out when the oscilloscope triggers, the internal oscilloscope reference clock out, or an AFG sync pulse
Characteristic Limits Vout (HI) ≥ 2.5 V open circuit; ≥ 1.0 V into a 50 Ω load to ground Vout (LO) ≤ 0.7 V into a load of ≤ 4 mA; ≤0.25 V into a 50 Ω load to ground
- Kensington-style lock
- Rear-panel security slot connects to standard Kensington-style lock
- LXI
Class: LXI Core 2016
Version: 1.5
Power source
- Power
- Power consumption
400 Watts maximum
- Source voltage
- 100 - 240 V ±10% at 50 Hz to 60 Hz
Physical characteristics
- Dimensions
Height: 11.299 in (286.99 mm), feet folded in, handle to back
Height: 13.8 in (351 mm) feet folded in, handle up
Width: 15.9 in (405 mm) from handle hub to handle hub
Depth: 6.1 in (155 mm) from back of feet to front of knobs, handle up
Depth: 10.4 in (265 mm) feet folded in, handle to the back
- Weight
- < 16.8 lbs (7.6 kg)
- Cooling
- The clearance requirement for adequate cooling is 2.0 in (50.8 mm) on the right side of the instrument (when viewed from the front) and on the rear of the instrument
- Rackmount configuration
- 7U (with optional RM4 Rackmount Kit)
Environmental specifications
- Temperature
- Operating
- +0 °C to +50 °C (32 °F to 122 °F)
- Non-operating
- -30 °C to +70 °C (-22 °F to 158 °F)
- Humidity
- Operating
- 5% to 90% relative humidity (% RH) at up to +40 °C
- 5% to 50% RH above +40 °C up to +50 °C, noncondensing, and as limited by a maximum wet-bulb temperature of +39 °C
- Non-operating
- 5% to 90% relative humidity (% RH) at up to +40 °C
- 5% to 50% RH above +40 °C up to +50 °C, noncondensing, and as limited by a maximum wet-bulb temperature of +39 °C
- Altitude
- Operating
- Up to 3,000 meters (9,843 feet)
- Non-operating
- Up to 12,000 meters (39,370 feet)
- Temperature
- Operating
- +0 °C to +50 °C (32 °F to 122 °F)
- Non-operating
-30 °C to +70 °C (-22 °F to 158 °F)
- Humidity
- Operating
5% to 90% relative humidity (% RH) at up to +40 °C
5% to 50% RH above +40 °C up to +50 °C, noncondensing, and as limited by a maximum wet-bulb temperature of +39 °C
- Non-operating
5% to 90% relative humidity (% RH) at up to +40 °C
5% to 50% RH above +40 °C up to +50 °C, noncondensing, and as limited by a maximum wet-bulb temperature of +39 °C
- Altitude
- Operating
- Up to 3,000 meters (9,843 feet)
- Non-operating
- Up to 12,000 meters (39,370 feet)
EMC, Environmental, and Safety
- Safety certification
- US NRTL Listed - UL61010-1 and UL61010-2-030
- Canadian Certification - CAN/CSA-C22.2 No. 61010.1 and CAN/CSA-C22.2 No 61010.2.030
- EU Compliance - Low Voltage Directive 2014-35-EU and EN61010-1.
- International Compliance - IEC 61010-1 and IEC61010-2-030
- Regulatory
CE marked for the European Union and CSA approved for the USA and Canada
RoHS compliant
Software
- IVI driver
Provides a standard instrument programming interface for common applications such as LabVIEW, LabWindows/CVI, Microsoft .NET, and MATLAB. Compatible with Python, C/C++/C# and many other languages through VISA.
- TekDrive
- Upload, store, organize, search, download, and share any file type from any connected device. TekDrive is natively integrated into the instrument for seamless sharing and recalling of files - no USB stick is required. Analyze and explore standard files like .wfm, .isf, .tss, and .csv, directly in a browser. Visit http://www.tek.com/software/tekdrive to learn more.
- LXI Web interface
Connect to the oscilloscope through a standard Web browser by simply entering the oscilloscope's IP address or network name in the address bar of the browser. The Web interface enables viewing of instrument status and configuration, status and modification of network settings, and instrument control through a SCPI talker/listener.
- Programming Examples
Programming with the 4/5/6 Series platforms has never been easier. With a programmers manual and a GitHub site you have many commands and examples to help you get started remotely automating your instrument. See https://github.com/tektronix/programmatic-control-examples.
Ordering information
Use the following steps to select the appropriate instrument and options for your measurement needs.
Step 1
- Start by selecting a model based on the number of FlexChannel inputs you need. Each FlexChannel input supports 1 analog or 8 digital input signals, interchangeably.
Model Number of FlexChannels MSO44 4 MSO46 6
- Each model includes
- One passive analog probe per channel:
- TPP0250 250 MHz probes with 200 MHz bandwidth models
- TPP0500B 500 MHz probes with 350 MHz and 500 MHz bandwidth models
- TPP1000 1 GHz probes with 1 GHz and 1.5 GHz models
- Installation and safety manual
- Embedded Help
- Power cord
- Calibration certificate documenting traceability to National Metrology Institute(s) and ISO9001/ISO17025 quality system registration
- Three -year warranty covering all parts and labor on the instrument.
- One-year warranty covering all parts and labor on included probes
Step 2
- Select a bandwidth
Configure your oscilloscope by selecting the analog channel bandwidth you need. You can upgrade it later by purchasing an upgrade option.
Bandwidth Option Bandwidth 4-BW-200 200 MHz 4-BW-350 350 MHz 4-BW-500 500 MHz 4-BW-1000 1 GHz 4-BW-1500 1.5 GHz
Step 3
- Add an option bundle
Three classes of option bundles are offered (Starter, Pro, Ultimate), providing a range of options depending on your budget and application needs. For detailed information on the current contents of each bundle, please visit our website and view the software bundle brochure at https://www.tek.com/document/brochure/software-bundles-for-the-4-5-and-6-series-mso-oscilloscopes.
- Starter bundle offers the most common serial bus decoding, protocol analysis, power measurements and analysis, and hardware enhancing options bundled together.
- Pro bundles are application-specific (Serial trigger and decode, Power Integrity, Signal Integrity, Automotive, Military Government Aerospace) and, include all options from the Starter bundle.
- Ultimate bundle includes all options from the Starter bundle in addition to the all options from all Pro bundles.
1 Year license Perpetual license Bundle description 4-STARTER-1Y 4-STARTER-PER Includes I2C, SPI, RS-232/422/UART serial trigger and analysis, AFG (Arbitrary/Function Generator), and power measurements and analysis 4-PRO-SERIAL-1Y 4-PRO-SERIAL-PER Includes 4-STARTER plus 62.5 MS/ch record length and additional select serial analysis options 4-PRO-POWER-1Y 4-PRO-POWER-PER Includes 4-STARTER plus 62.5 MS/ch record length and select power analysis options 4-PRO-AUTO-1Y 4-PRO-AUTO-PER Includes 4-STARTER plus 62.5 MS/ch record length and select automotive analysis options 4-PRO-MILGOV-1Y 4-PRO-MILGOV-PER Includes 4-STARTER plus 62.5 MS/ch record length and additional select serial analysis options 4-ULTIMATE-1Y 4-ULTIMATE-PER Includes 4-STARTER, all 4-PRO bundle options plus 62.5 MS/ch record length and RF vs Time traces, triggers, Spectrograms, and IQ capture, extended Spectrum View capture bandwidth, and video trigger options - Each purchased bundle has two duration options
- A 1-year subscription includes all features and free upgrades for the purchased bundle for one year; after which time the features are disabled. Additional 1-year subscription can be purchased for the selected bundle.
- A perpetual subscription enables all features for the purchased bundle permanently. A perpetual subscription includes 1-year of free upgrades to the bundle feature set. After the year, the feature set is frozen to those enabled by the last update made.
Perpetual bundles can continue to receive upgrades following the 1 year activation period with the purchase of a maintenance license. Maintenance license information can be found in the maintenance license table below and must be purchased for an existing Starter, Pro, or Ultimate bundle.
Maintenance license Description 4-STARTER-MNT-1Y Includes Perpetual Starter Bundle updates for 1 Year 4-PRO-MNT-1Y Includes Perpetual Pro Bundle updates for 1 Year 4-ULTIMATE-MNT-1Y Includes Perpetual Ultimate Bundle updates for 1 Year
Step 4
- Add instrument functionality
Instrument functionality can be ordered with the instrument or later as an upgrade kit.
Instrument option Built-in functionality 4-RL-1 Extend record length to 62.5 Mpoints/channel 4-AFG Add Arbitrary/Function Generator
Step 5
- Add optional protocol triggering, decode, and search capabilities
- Choose the protocol support you need today by choosing from these analysis options. You can upgrade later by purchasing an upgrade kit.
Instrument option Protocols supported 4-RFNFC ISO/IEC 15693, 14443A, 14443B, and FeliCa (decode and search only) 4-SRAERO Aerospace (MIL-STD-1553, ARINC 429) 4-SRAUDIO Audio (I2S, LJ, RJ, TDM) 4-SRAUTO Automotive (CAN, CAN FD, CAN XL, LIN, FlexRay, and CAN symbolic decoding) 4-SRAUTOSEN Automotive sensor (SENT) 4-SRCOMP Computer (RS-232/422/485/UART) 4-SRCXPI CXPI (decode and search only) 4-SREMBD Embedded (I2C, SPI) 4-SRENET Ethernet (10BASE-T, 100BASE-TX) 4-SRESPI eSPI (decode and search only) 4-SRETHERCAT EtherCAT (decode and search only) 4-SRI3C MIPI I3C 4-SRMANCH Manchester (decode and search only) 4-SRMDIO MDIO (decode and search only) 4-SRNRZ NRZ (decode and search only) 4-SRONEWIRE One wire (1-Wire decode and search only) 4-SRPM Power Management (SPMI) 4-SRPSI5 PSI5 (decode and search only) 4-SRSMBUS SMBus (decode and search only) 4-SRSPACEWIRE Spacewire (decode and search only) 4-SRSDLC Synchronous Data Link Control Protocol (decode and search only) 4-SRSVID SVID 4-SRUSB2 USB (USB2.0 LS, FS, HS) 4-SREUSB2 eUSB2.0 (decode and search only) Differential serial bus? Be sure to check Add analog probes and adapters for differential probes.
Step 6
- Add optional analysis capabilities
Instrument option Advanced analysis 4-3PHASE Three-phase electrical analysis (6 channel model only) 4-PWR Advanced Power Measurements and Analysis (includes all 4-PWR-BAS measurements, FRA, and Magnetics) 4-MTM Mask and Limit testing 4-TDR Time Domain Reflectometry 4-VID NTSC, PAL, and SECAM video triggering 4-PWR-BAS Power Measurements and analysis (this option is not compatible with option 4-PS2 ) 4-SV-BW-1 Increase Spectrum View capture bandwidth to 500 MHz 4-PS2 Power Solution Bundle (4-PWR-BAS, THDP0200, TCP0030A, 067-1686-xx deskew fixture) 4-WBG-DPT Wide Bandgap SiC/GaN Double Pulse Test Measurements and Analysis
Step 7
- Add digital probes
- Each FlexChannel input can be configured as eight digital channels simply by connecting a TLP058 logic probe to a FlexChannel input. You can order TLP058 probes with the instrument or separately.
For this instrument Order To add MSO44 1 to 4 TLP058 Probes 8 to 32 digital channels MSO46 1 to 6 TLP058 Probes 8 to 48 digital channels
Step 8
- Add analog probes and adapters
- Add additional recommended probes and adapters
Recommended Probe / Adapter Description TAP1500 1.5 GHz TekVPI® active single-ended voltage probe, ±8 V input voltage TAP2500 2.5 GHz TekVPI® active single-ended voltage probe, ±4 V input voltage TCP0030A 30 A AC/DC TekVPI® current probe, 120 MHz BW TCP0020 20 A AC/DC TekVPI® current probe, 50 MHz BW TCP0030A 30 A AC/DC TekVPI current probe, 120 MHz BW TCP0150 150 A AC/DC TekVPI® current probe, 20 MHz BW TRCP0300 30 MHz AC current probe, 250 mA to 300 A TRCP0600 30 MHz AC current probe, 500 mA to 600 A TRCP3000 16 MHz AC current probe, 500 mA to 3000 A TDP0500 500 MHz TekVPI® differential voltage probe, ±42 V differential input voltage TDP1000 1 GHz TekVPI® differential voltage probe, ±42 V differential input voltage TDP1500 1.5 GHz TekVPI® differential voltage probe, ±8.5 V differential input voltage THDP0100 ±6 kV, 100 MHz TekVPI® high-voltage differential probe THDP0200 ±1.5 kV, 200 MHz TekVPI® high-voltage differential probe TMDP0200 ±750 V, 200 MHz TekVPI® high-voltage differential probe TPR1000 1 GHz, Single-Ended TekVPI® Power-Rail Probe; includes one TPR4KIT accessory kit TIVP02 Isolated Probe; 200 MHz, ±5 V to ±2500 V depending on tip; 2 meter cable TIVP02L Isolated Probe; 200 MHz, ±5 V to ±2500 V depending on tip; 10 meter cable TIVP05 Isolated Probe; 500 MHz, ±5 V to ±2500 V depending on tip; 2 meter cable TIVP05L Isolated Probe; 500 MHz, ±5 V to ±2500 V depending on tip; 10 meter cable TIVP1 Isolated Probe; 1 GHz, ±5 V to ±2500 V depending on tip; 2 meter cable TIVP1L Isolated Probe; 1 GHz, ±5 V to ±2500 V depending on tip; 10 meter cable TPP0502 500 MHz, 2X TekVPI® passive voltage probe, 12.7 pF input capacitance TPP0850 2.5 kV, 800 MHz, 50X TekVPI® passive high-voltage probe TPP1000 1 GHz, 10X TekVPI® passive voltage probe, 1.3 Meter cable, 3.9 pF input capacitance P6015A 20 kV, 75 MHz high-voltage passive probe TPA-BNC TekVPI® to TekProbe™ BNC adapter (recommended for connecting your existing TekProbe probes to this instrument) TEK-DPG TekVPI deskew pulse generator signal source 067-1686-xx Power measurement deskew and calibration fixture - Looking for other probes? Check out the probe selector tool at www.tek.com/probes.
Step 9
- Add accessories
Add traveling or mounting accessories
Optional Accessory Description HC4 Hard carrying case with instrument front protective cover RM4 Rackmount kit SC4 Soft carrying case with instrument front protective cover GPIB to Ethernet Adapter Order model 4865B (GPIB to Ethernet to Instrument Interface) directly from ICS Electronics www.icselect.com/gpib_instrument_intfc.html
Step 10
- Select power cord option
Power Cord Option Description A0 North America power plug (115 V, 60 Hz) A1 Universal Euro power plug (220 V, 50 Hz) A2 United Kingdom power plug (240 V, 50 Hz) A3 Australia power plug (240 V, 50 Hz) A5 Switzerland power plug (220 V, 50 Hz) A6 Japan power plug (100 V, 50/60 Hz) A10 China power plug (50 Hz) A11 India power plug (50 Hz) A12 Brazil power plug (60 Hz) A99 No power cord
Step 11
- Add extended service and calibration options
Service Option Description T3 Three-year Total Protection Plan, includes repair or replacement coverage from wear and tear, accidental damage, ESD or EOS. C3 Calibration service for 3 years. Includes traceable calibration or functional verification where applicable, for recommended calibrations. Coverage includes the initial calibration plus 2 years of calibration coverage. T5 Five year Total Protection Plan, includes repair or replacement coverage from wear and tear, accidental damage, ESD or EOS. R5 Standard warranty extended to 5 years. Covers parts, labor and 2-day shipping within country. Guarantees faster repair time than without coverage. All repairs include calibration and updates. Hassle free - a single call starts the process. C5 Calibration service for 5 years. Includes traceable calibration or functional verification where applicable, for recommended calibrations. Coverage includes the initial calibration plus 4 years of calibration coverage. D1 Calibration data report D3 Calibration data report 3 years (with Option C3) D5 Calibration data report 5 years (with Option C5)
Feature upgrades after purchase
- Add feature upgrades in the future
- You can easily add functionality after the initial purchase. Node-locked licenses permanently enable optional features on a single product. Floating licenses allow license-enabled options to be easily moved between compatible instruments.
| Upgrade feature | Node-locked license upgrade | Floating license upgrade | Description |
|---|---|---|---|
| Add instrument functions | SUP4-AFG | SUP4-AFG-FL | Add arbitrary function generator |
| SUP4-RL-1 | SUP4-RL-1-FL | Extend record length to 62.5 Mpts / channel | |
| Add protocol analysis | SUP4-RFNFC | SUP4-RFNFC-FL | ISO/IEC 15693 and ISO/IEC14443A (decode and search only) |
| SUP4-SRAERO | SUP4-SRAERO-FL | Aerospace serial triggering and analysis (MIL-STD-1553, ARINC 429) | |
| SUP4-SRAUDIO | SUP4-SRAUDIO-FL | Audio serial triggering and analysis (I2S, LJ, RJ, TDM) | |
| SUP4-SRAUTO | SUP4-SRAUTO-FL | Automotive serial triggering and analysis (CAN, CAN FD, CAN XL, LIN, FlexRay, and CAN symbolic decoding) | |
| SUP4-SRAUTOSEN | SUP4-SRAUTOSEN-FL | Automotive sensor serial triggering and analysis (SENT) | |
| SUP4-SRCOMP | SUP4-SRCOMP-FL | Computer serial triggering and analysis (RS-232/422/485/UART) | |
| SUP4-SRCXPI | SUP4-SRCXPI-FL | CXPI serial decoding and analysis | |
| SUP4-SREMBD | SUP4-SREMBD-FL | Embedded serial triggering and analysis (I2C, SPI) | |
| SUP4-SRENET | SUP4-SRENET-FL | Ethernet serial triggering and analysis (10Base-T, 100Base-TX) | |
| SUP4-SRESPI | SUP4-SRESPI-FL | eSPI serial decoding and analysis | |
| SUP4-SRETHERCAT | SUP4-SRETHERCAT-FL | EtherCAT serial decoding and analysis | |
| SUP4-SRI3C | SUP4-SRI3C-FL | MIPI I3C serial trigger and analysis | |
| SUP4-SRMANCH | SUP4-SRMANCH-FL | Manchester (decode and search only) | |
| SUP4-SRMDIO | SUP4-SRMDIO-FL | Management Data Input/Output (MDIO) serial decoding and analysis | |
| SUP4-SRNRZ | SUP4-SRNRZ-FL | NRZ serial analysis | |
| SUP4-SRONEWIRE | SUP4-SRONEWIRE-FL | One wire (1-Wire) serial decoding and analysis | |
| SUP4-SRPM | SUP4-SRPM-FL | Power Management serial triggering and analysis (SPMI) | |
| SUP4-SRPSI5 | SUP4-SRPSI5-FL | PSI5 serial analysis | |
| SUP4-SRSMBUS | SUP4-SRSMBUS-FL | SMBus serial decoding and analysis | |
| SUP4-SRSPACEWIRE | SUP4-SRSPACEWIRE-FL | Spacewire serial analysis | |
| SUP4-SRSDLC | SUP4-SRSDLC-FL | Synchronous Data Link Control | |
| SUP4-SRSVID | SUP4-SRSVID-FL | Serial Voltage Identification (SVID) serial decoding and analysis | |
| SUP4-SRUSB2 | SUP4-SRUSB2-FL | USB 2.0 serial bus triggering and analysis (LS, FS, and HS) | |
| SUP4-SREUSB2 | SUP4-SREUSB2-FL | Embedded USB 2.0 (eUSB 2.0) serial decoding and analysis | |
| Add advanced analysis | SUP4-3PHASE | SUP4-3PHASE-FL | Three-phase electrical analysis (6 channel model only) |
| SUP4-MTM | SUP4-MTM-FL | Mask and Limit Testing | |
| SUP4-PS2 | N/A | Power Solution Bundle (4-PWR, THDP0200, TCP0030A, 067-1686-xx deskew fixture) | |
| SUP4-PWR-BAS | SUP4-PWR-BAS-FL | Power measurements and analysis | |
| SUP4-PWR | SUP4-PWR-FL | Advanced power measurements and analysis (includes all SUP4-PWR-BAS measurements) | |
| SUP4-SV-BW-1 | SUP4-SV-BW-1-FL | Increase Spectrum View capture bandwidth to 500 MHz | |
| SUP4-SV-RFVT | SUP4-SV-RFVT-FL | Spectrum View RF vs. Time traces, triggers, Spectrograms, and IQ capture | |
| SUP4-TDR | SUP4-TDR-FL | Time Domain Reflectometry | |
| SUP4-VID | SUP4-VID-FL | NTSC, PAL and SECAM video triggering | |
| SUP4-WBG-DPT | SUP4-WBG-DPT-FL | Wide Bandgap SiC/GaN Double Pulse Test Measurements and Analysis | |
| Add digital voltmeter | N/A | N/A | Add digital voltmeter / trigger frequency counter (free with product registration at www.tek.com/register4mso) |
Bandwidth upgrades after purchase
- Add bandwidth upgrades in the future
- You can easily upgrade the analog bandwidth of products after initial purchase. Bandwidth upgrades are purchased based on the number of FlexChannel inputs, the current bandwidth, and the desired bandwidth.
All models can be upgraded in the field to any bandwidth.
| Oscilloscope model owned | Bandwidth upgrade product | Upgrade option | Upgrade option description |
|---|---|---|---|
| MSO44 | SUP4-BW4 | 4-BW2T3-4 | License; Bandwidth Upgrade; Upgrade from 200 MHz to 350 MHz bandwidth on a (4) FlexChannel model; Node Locked |
| 4-BW2T5-4 | License; Bandwidth Upgrade; Upgrade from 200 MHz to 500 MHz bandwidth on a (4) FlexChannel model; Node Locked | ||
| 4-BW2T10-4 | License; Bandwidth Upgrade; Upgrade from 200 MHz to 1 GHz bandwidth on a (4) FlexChannel model; Node Locked | ||
| 4-BW2T15-4 | License; Bandwidth Upgrade; Upgrade from 200 MHz to 1.5 GHz bandwidth on a (4) FlexChannel model; Node Locked | ||
| 4-BW3T5-4 | License; Bandwidth Upgrade; Upgrade from 350 MHz to 500 MHz bandwidth on a (4) FlexChannel model; Node Locked | ||
| 4-BW3T10-4 | License; Bandwidth Upgrade; Upgrade from 350 MHz to 1 GHz bandwidth on a (4) FlexChannel model; Node Locked | ||
| 4-BW3T15-4 | License; Bandwidth Upgrade; Upgrade from 350 MHz to 1.5 GHz bandwidth on a (4) FlexChannel model; Node Locked | ||
| 4-BW5T10-4 | License; Bandwidth Upgrade; Upgrade from 500 MHz to 1 GHz bandwidth on a (4) FlexChannel model; Node Locked | ||
| 4-BW5T15-4 | License; Bandwidth Upgrade; Upgrade from 500 MHz to 1.5 GHz bandwidth on a (4) FlexChannel model; Node Locked | ||
| 4-BW10T15-4 | License; Bandwidth Upgrade; Upgrade from 1 GHz to 1.5 GHz bandwidth on a (4) FlexChannel model; Node Locked | ||
| MSO46 | SUP4-BW6 | 4-BW2T3-6 | License; Bandwidth Upgrade; Upgrade from 200 MHz to 350 MHz bandwidth on a (6) FlexChannel model; Node Locked |
| 4-BW2T5-6 | License; Bandwidth Upgrade; Upgrade from 200 MHz to 500 MHz bandwidth on a (6) FlexChannel model; Node Locked | ||
| 4-BW2T10-6 | License; Bandwidth Upgrade; Upgrade from 200 MHz to 1 GHz bandwidth on a (6) FlexChannel model; Node Locked | ||
| 4-BW2T15-6 | License; Bandwidth Upgrade; Upgrade from 200 MHz to 1.5 GHz bandwidth on a (6) FlexChannel model; Node Locked | ||
| 4-BW3T5-6 | License; Bandwidth Upgrade; Upgrade from 350 MHz to 500 MHz bandwidth on a (6) FlexChannel model; Node Locked | ||
| 4-BW3T10-6 | License; Bandwidth Upgrade; Upgrade from 350 MHz to 1 GHz bandwidth on a (6) FlexChannel model; Node Locked | ||
| 4-BW3T15-6 | License; Bandwidth Upgrade; Upgrade from 350 MHz to 1.5 GHz bandwidth on a (6) FlexChannel model; Node Locked | ||
| 4-BW5T10-6 | License; Bandwidth Upgrade; Upgrade from 500 MHz to 1 GHz bandwidth on a (6) FlexChannel model; Node Locked | ||
| 4-BW5T15-6 | License; Bandwidth Upgrade; Upgrade from 500 MHz to 1.5 GHz bandwidth on a (6) FlexChannel model; Node Locked | ||
| 4-BW10T15-6 | License; Bandwidth Upgrade; Upgrade from 1 GHz to 1.5 GHz bandwidth on a (6) FlexChannel model; Node Locked |


