In part one of this series, we discussed the importance of setting the correct RBW value so that a spectrum analyzer can mimic the sensitivity of the victim receiver, and some of the trade-offs that occur. Once we have made sure that our spectrum analyzer has enough sensitivity, how do we figure out how often the interference is occurring?
Traditionally, the various trace modes available in a spectrum analyzer are used to help characterize RF signals of interest. Peak hold, average and minimum hold are common. Even when employing these trace modes, it is still difficult to determine how often a signal is occurring or if one signal is somehow related to other signals in the same span.
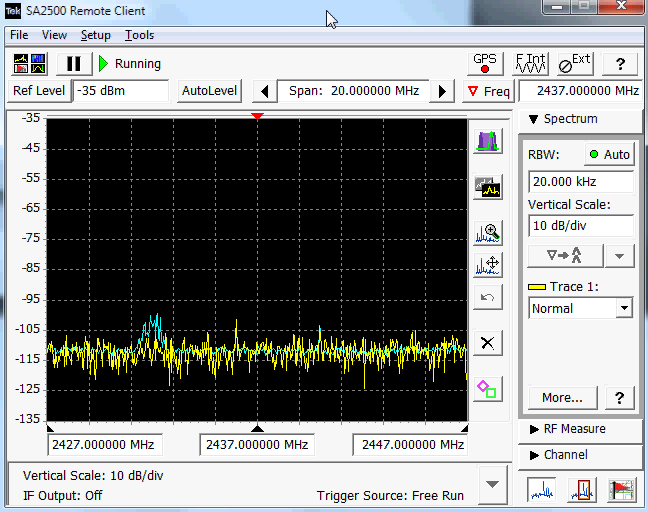
RTSAs provide a solution to this problem: a fast spectrum display with persistence effects. Remember that in a real-time spectrum analyzer, for any span up to the maximum real-time span, the instrument is not sweeping, which means it is capable of measuring the spectrum tens of thousands of times per second. But the spectrum cannot be displayed that fast. To solve that problem, spectrum analyzers with persistent displays were developed as shown below.


A real-time spectrum analyzer display shows much more information than a traditional display.
A persistence display (or digital phosphor display) keeps track—pixel by pixel—of how often energy is being measured. The color of the pixel indicates how often a signal is present. With temperature scaling, red means a signal is on often while blue means it’s on less often. With the combination of fast spectrum measurements and persistence, infrequent events can be more easily identified.
When operating with a real-time display, it’s important to take care when selecting the RBW filter. Just like in a regular spectrum display, the RBW filter selection will greatly affect the speed of the spectrum measurements. One of the key specifications for an RTSA is the probability of intercept (POI). This specification dictates the minimum signal duration that the instrument is guaranteed to detect. Selecting a narrow RBW will change the POI for the measurement—an important factor to be aware of.
While a much greater amount of information can be obtained from the persistent display compared to a basic spectrum display, it doesn’t reveal the whole story. In modern radios there are many protocols that employ some form of clear channel assessment. Essentially, such radios are capable of determining how busy a channel is and will only transmit when no one else is using the frequency. Even a fast persistent display cannot show the timing relationships between two signals. To determine the timing of signals we need to use the spectrogram function as shown below which allows us to plot the spectrum data over time to determine how often signals are active.

The spectrogram allows you to record spectrum for long periods of time and playback problem periods.
Spectrograms are a type of waterfall display that plots the spectrum activity over time. As in a typical spectrum display, the start frequency is on the left-hand side and the stop frequency is on the right-hand side. Time is the on Y-axis and color indicates signal amplitude—red being the highest amplitude and black being the lowest. The spectrogram is composed of the peak detected data from the persistence display, and the amount of spectrum data aggregated is defined by the user.
With these controls the user can record the data for long periods of time (hours) and then export and share the results. This is especially useful when there is a stubborn interference problem and the spectrum needs to be monitored for a long time. In the event that you are dealing with an intermodulation issue, the spectrogram can help determine the fundamental elements of the mix.
Keep in mind that with RTSAs the spectrum information is instantaneously measured for the entire time span. This means that we can use the data to perform a visual carrier correlation to confirm the timing relationships between source carriers and intermodulation products.
In Part 3 of this four-part series, we will discuss how to trigger on a specific signal as well as create an automatic email notifier.
For more information on spectrum management and interference hunting be sure to visit our resource center. You’ll find a wealth of information such as our useful and informative Spectrum Allocation Poster.

Read the other entires in this series here:
Part 1: Get the insight you need to see interference in a crowded spectrum
Part 3: Use Mask Search to automatically discover when interference is happening
Part 4: Storing and sharing captures, the interference hunter’s safety net
About the Author
Robin Jackman is a field applications engineer based in Toronto, Ontario. He has been with Tektronix for more than 15 years supporting customer applications throughout North America. His work with Tektronix has covered both analog and digital design with a focus on RF applications. Prior to Tektronix he spent 12 years working for the federal government in spectrum management.