This post walks through basic time and amplitude measurements using graticule and on-screen cursors on the new TBS2000 oscilloscope. First we take a step-by-step look at performing time, phase and amplitude measurements and how to quickly take voltage and time measurements off the scope display as well as by using cursors. We then look at using automated functions that can improve speed and accuracy.
Before starting to make measurements, here are few things to check to ensure your measurements are as accurate as possible. These tips are helpful whether you’re measuring by eye or using the automatic measurements on your scope:
- Make sure the probe attenuation on your scope is set correctly for the probe you’re using.
- Make sure the signal is triggered correctly so it’s stable.
- Adjust the vertical scale to use as much of the display as you can without clipping the top or bottom.
- Set the horizontal scale to expand the part of the signal that you’re interested in. Be careful not to slow down the horizontal scale too much as that can cause under-sampling and aliasing.
The simplest way to get a quick estimate of time and amplitude measurements is by using the graticule or grid on the scope’s display. The TBS2000 graticule has 15 horizontal division, allowing you to see more and evaluate designs faster. Most basic scopes have just 10 horizontal and 10 vertical divisions (and some only have eight). Each major division is broken up into five minor divisions.
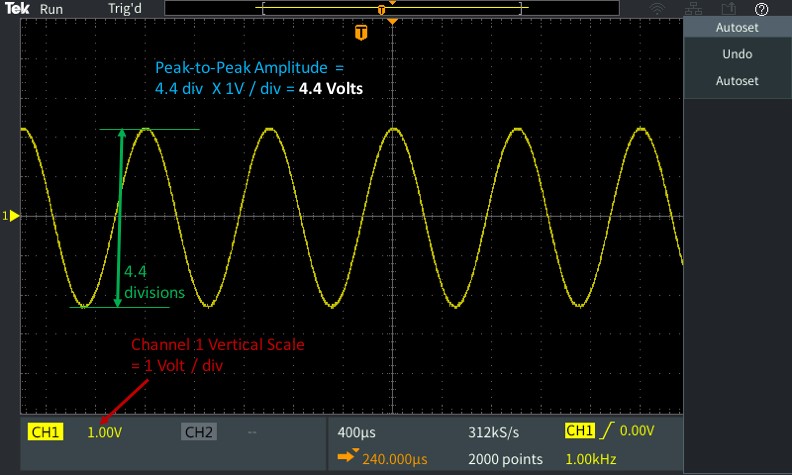
For amplitude measurements, you count the number of vertical divisions occupied by the signal’s vertical signal and then multiply by the vertical scale. The example below shows the process for measuring the peak-to-peak voltage of a signal. To make it a little easier to count the divisions, you can shift the waveform using the vertical positions knobs to align at least one end of your measurement with the major graticule divisions or centerline. Now you can measure the height in divisions. Here, the signal takes up four major divisions and two minor divisions. Each minor division is worth 0.2 divisions. So, the signal is 4.4 divisions from bottom to top and since each division represents 1 V, the signal is 4.4 V peak to peak.

Measuring amplitude
In a similar way to measuring the amplitude, you can also measure time. Simply count the number of horizontal divisions and then multiply by the horizontal scale setting as shown in the image below. This allows you to find the period of the signal.
One cycle of the waveform takes up 2.5 horizontal divisions. The horizontal scale is set to 400 microseconds per division. The period is 2.5 divisions, multiplied by 400 µs per divisions, which equals 1 ms. Once you have the period, you can calculate the frequency – the inverse of period. In this example the math is fairly simple -- a 1 ms period translates to a frequency of 1 kHz.

Measuring period
You can even get a rough idea of the phase difference between two signals with the same frequency. In the example below, the signals look like they are about 45 degrees out of phase. To confirm this with measurements, you might need a calculator. First measure the time difference between the two signals. In this instance the two signals are 120 µs out of phase. To convert the time into an angle, multiply it by 360 degrees divided by the period. In this case 360 degrees represents a 1 ms period. Therefore, the conversion factor is 360,000 degrees/second. And 120 µs times 360,000 degrees/second gives you a phase difference of about 43 degrees (which is pretty close to our initial guess!)

Phase measurement between two signals
Taking measurements by eye is quick, but it’s not very accurate and as we noted above it requires a bit of math. On-screen markers, called cursors can help you make more accurate time and amplitude measurements. On this scope you can turn on the screen markers by pressing the cursor button.
The TBS2000 scope has three types of cursors:
- Time or vertical cursors
- Amplitude or horizontal cursors
- Screen cursors
Screen cursors are a combination of both horizontal and vertical cursors for time and amplitude measurements. Let’s look closer at time cursors, which is the type you will probably use most often.
Many scopes have cursors, but the exact way you move them, will be different between instruments. On this scope you move the cursors by turning the “multipurpose knob.” The time value associated with individual cursor positions and the difference between them are shown on the screen. Even though these are called “time cursors,” they also track the waveform and show you the voltage.

Time cursors
To measure the period of a signal using the cursors, position them on exactly one cycle of the waveform. The time difference between the cursors indicates the period of the signal. Time cursors can also be used to calculate the time difference between two channels by aligning the cursors on the zero crossings of the same edge on the two channels.

Aligning time cursors
Next up are amplitude cursors. These cursors are great for measuring a voltage level or difference, without tracking the waveform. You measure the peak-to-peak voltage on a signal by positioning the cursors at the positive and negative peaks. The individual cursors will give you the maximum and minimum values and the cursor difference value will give you the peak-to-peak voltage.

Amplitude cursors
Lastly, screen cursors provide two time and two amplitude cursors that can be individually positioned to obtain time and amplitude measurements.

Screen cursors
Using the graticule or cursors provides great estimates of voltage and time. However, accuracy is limited by graticule resolution, cursor alignment and display resolution. Modern digital oscilloscopes provide built-in automated measurement functions that perform measurements on the digital signal data converted by the analog-to-digital converter in the scope. Since the measurements are performed on digitized signal values, they aren’t subject to errors introduced by the eye.
On the TBS2000 scope the measurement functions can be accessed by pressing the MEASURE button. The measurement menu provides a categorized list of all the measurement functions available. You can scroll through the measurements and select the ones you want. Useful tips also show up at the bottom to explain the differences between each measurement.

Measurement menu
The example below shows some of the most common automated measurements -- frequency, period, peak-to-peak, amplitude, max and min. The measurements show up on the display, alongside the waveform.

Display of basic measurements
Changing the vertical scale to make the most of the range of your scope will improve the accuracy of your measurements. However, the waveform should stay inside the scope display. If the waveform is clipped, the measurements will be unreliable and you’ll receive a warning. Similarly, if the horizontal scale is too low and the scope doesn’t have more than a complete cycle, it won’t be able to compute period or frequency measurements.
Some measurements involve more than one channel, like phase or delay measurements. For these measurements you have to specify which channels to use. The first channel you specify is usually the reference. In this example, we are making a phase measurement from Channel 1 to Channel 2 by turning on frequency and period measurements for the signal on Channel 2.
In this case, the phase measurement gives a negative reading, which means that Channel 1 is lagging behind Channel 2. Some measurements for Channel 2 are shown in light blue in the image below, the same color as the waveform.

Phase measurement
On some scopes, including the TBS2000, the automated measurement functions give you the option to define the portion of the waveform used to calculate the measurement, which is called measurement GATING. The default option is the entire waveform (or full record). This means that any measurement you select would be applied to the entire waveform data.

GATING sub-menu
Another gating option is to apply the measurement on the portion of the waveform that is displayed on the screen, like the image below:

GATING option to apply measurement to the displayed waveform
You can also use the cursor gating to limit the measurement to the part of the waveform between the cursors.
This concludes our tutorial on amplitude and time measurements using the graticule, screen cursors and measurement functions on a digital oscilloscope. To see the video version of this tutorial, be sure to check out the XYZs of Oscilloscopes Tutorials on the Tektronix YouTube channel.