1. Introduction
Three-phase ac motors have been the workhorse of industry since the earliest days of electrical engineering. They are reliable, efficient, cost-effective and need little or no maintenance. In addition, ac motors such as induction and reluctance motors need no electrical connection to the rotor, so can easily be made flameproof for use in hazardous environments such as in mines.
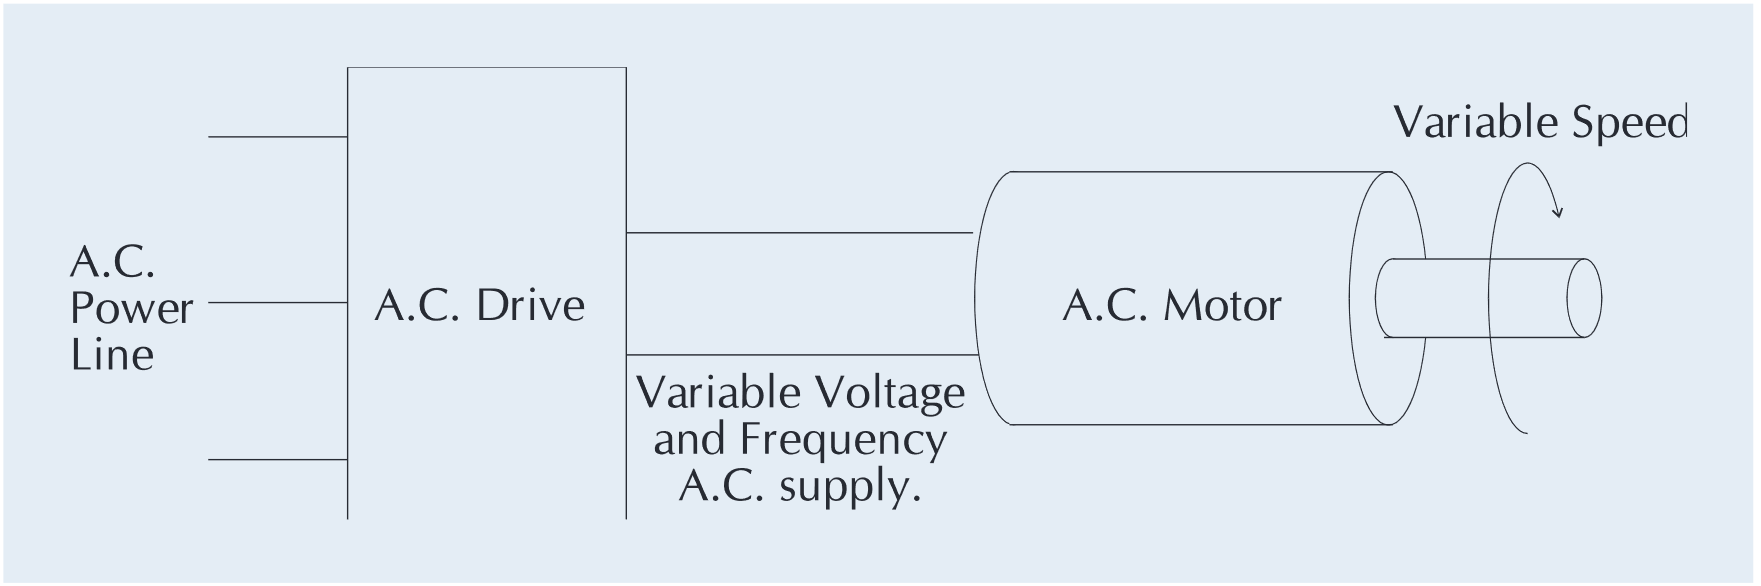
In order to provide proper speed control of an ac motor, it is necessary to supply the motor with a three phase supply of which both the voltage and the frequency can be varied. Such a supply will create a variable speed rotating field in the stator that will allow the rotor to rotate at the required speed with low slip as shown in Figure 1. This ac motor drive can efficiently provide full torque from zero speed to full speed, can overspeed if necessary, and can, by changing phase rotation, easily provide bi-directional operation of the motor. A drive with these characteristics is known as a PWM (Pulse Width Modulated) motor drive.
Although the principles of PWM drives have been understood for some years, advances in the technology of power semiconductors, control electronics, and microprocessors have greatly stimulated the use of such drives. This has been further accelerated by the use of Vector control methods which give the ac drive the capability and flexibility of a full dc motor drive. PWM motor drives are now becoming the dominant method of variable speed motor control, and are being used not only in industry, but in applications as diverse as electric vehicles and domestic air conditioners.
PWM drives produce complex waveforms, both on their output to the motor, and also on the electrical supply to the drive. This Application Note is designed to explain electrical measurements commonly performed on these drives.
2. Principles of PWM Motor Drives
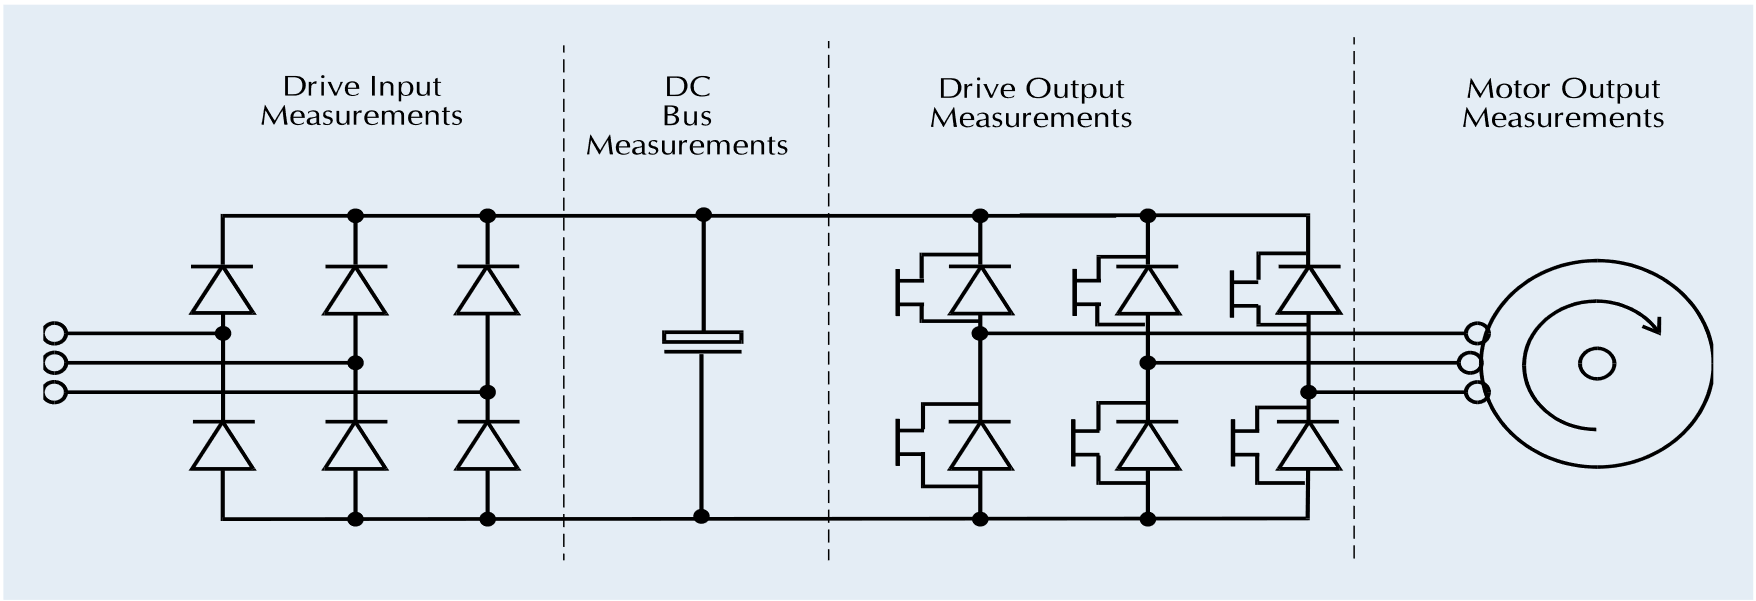
A block diagram of the essential elements of a PWM motor drive is shown in Figure 2.
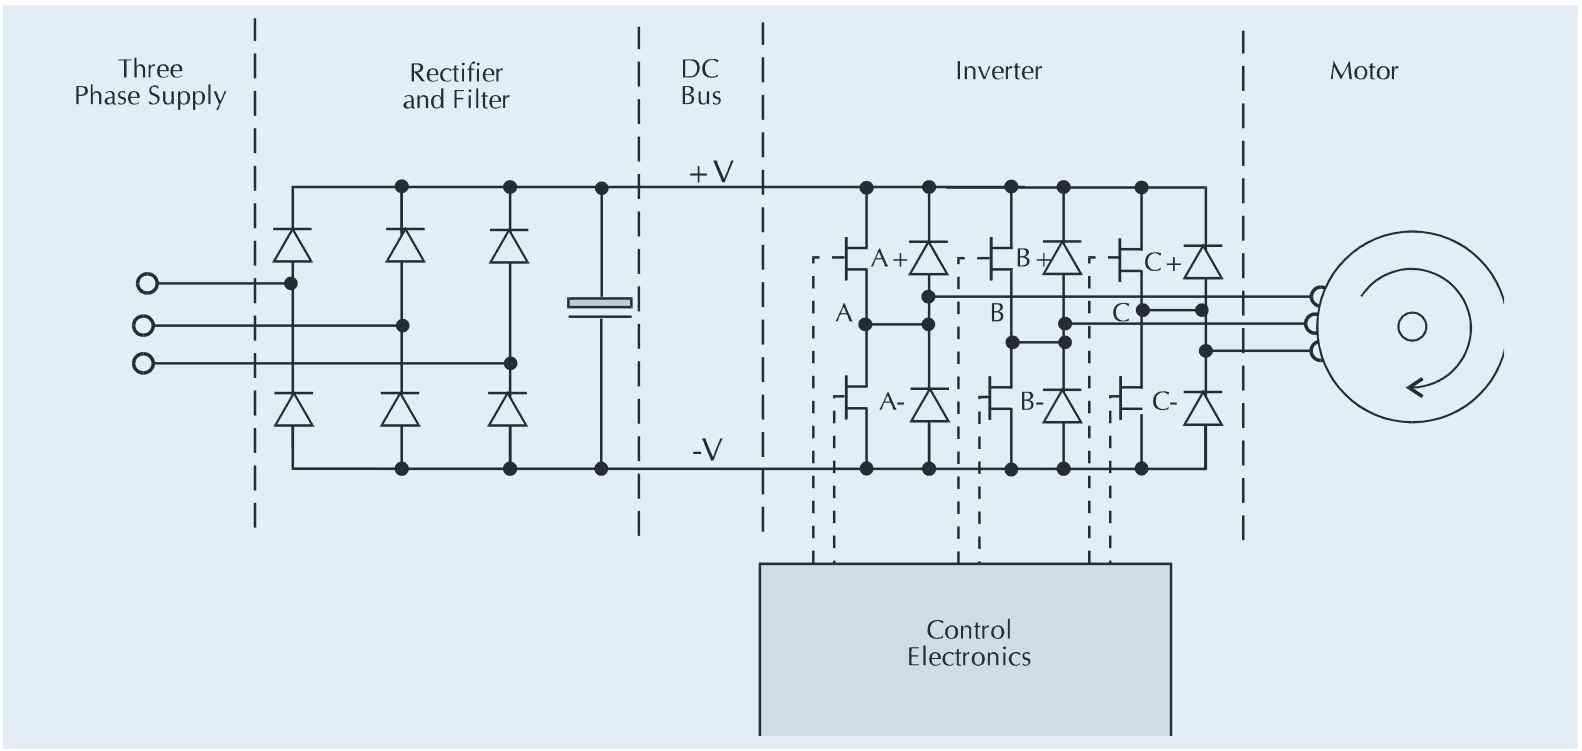
The three phase supply is rectified and filtered to produce a dc bus which powers the inverter section of the drive. The inverter consists of three pairs of semiconductor switches (MOSFET, GTO, power transistor, IGBT, etc.) with associated diodes. Each pair of switches provides the power output for one phase of the motor.
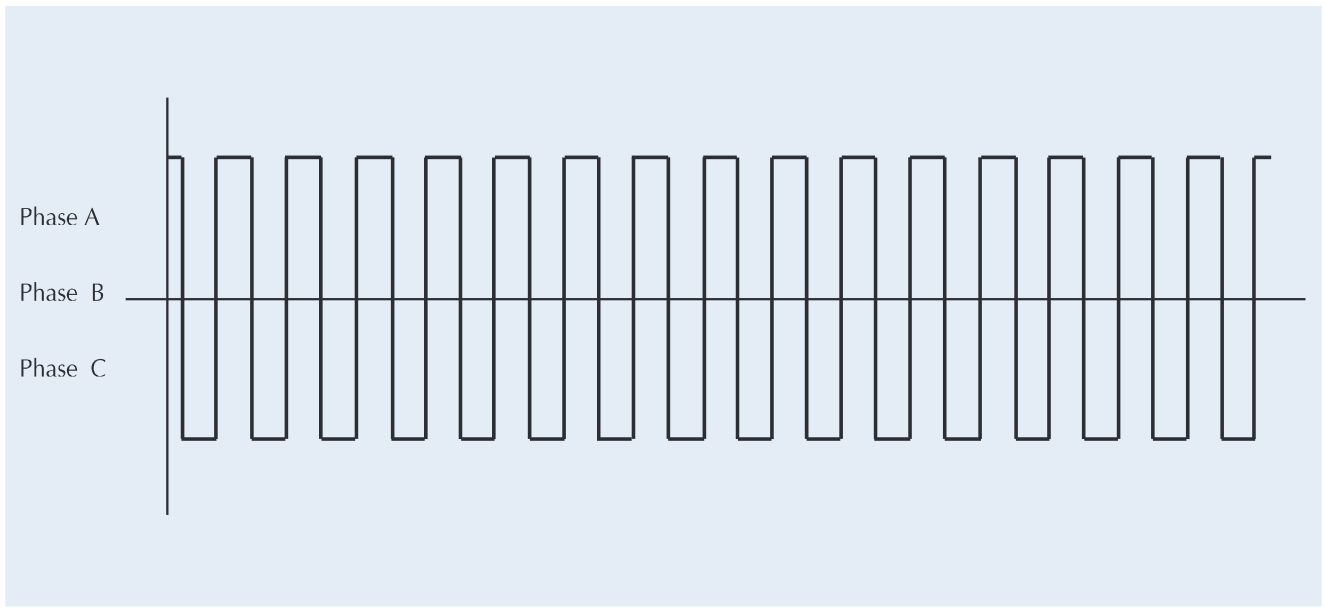
Each pair of semiconductor switches is driven by the control electronics Figure 3 shows the generated high frequency square wave carrier pulse waveform at each of the phase outputs.
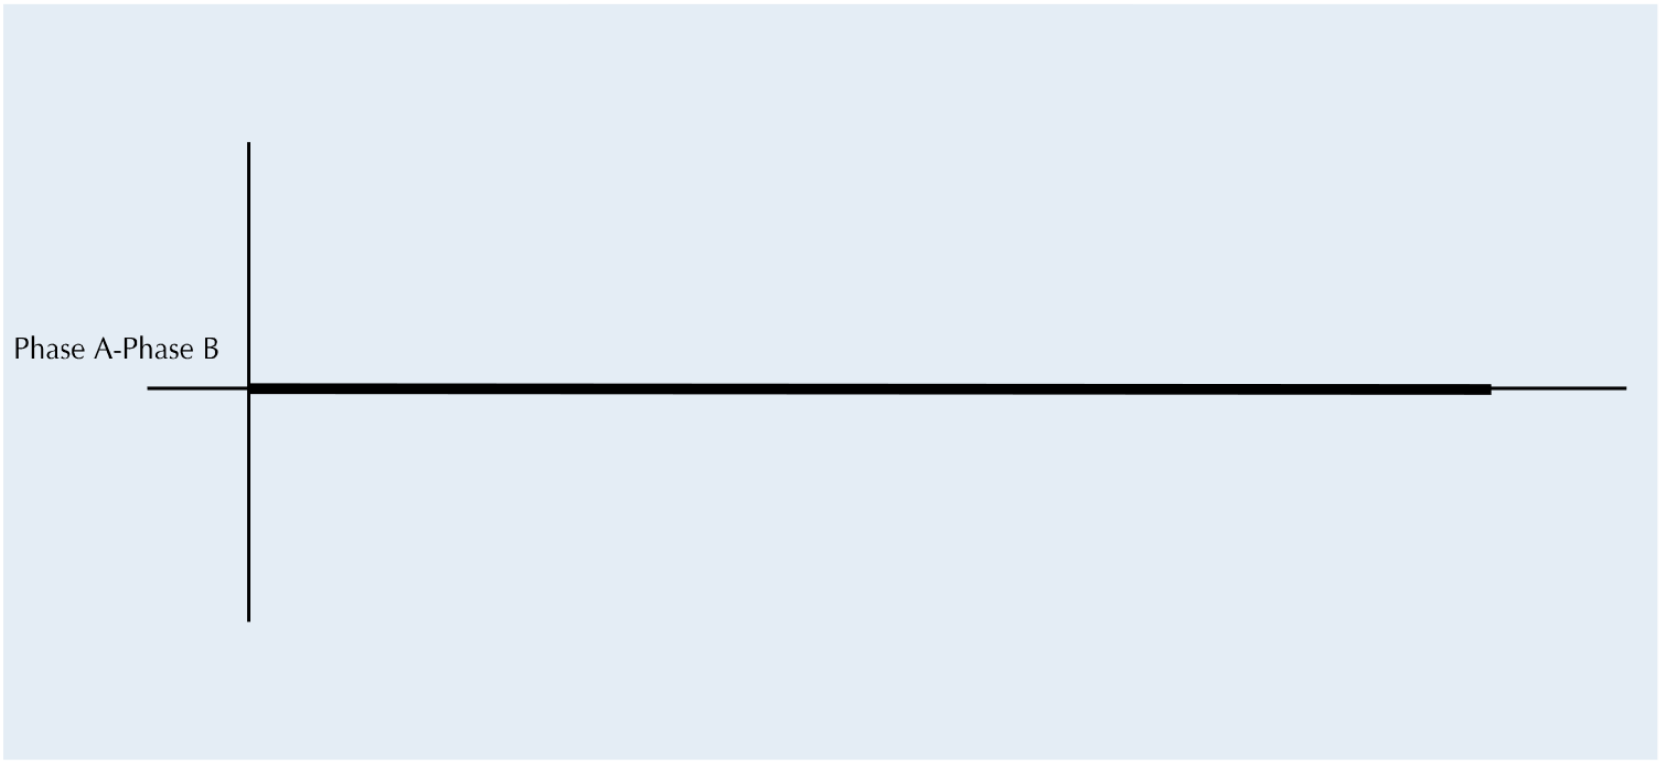
As shown in Figure 4. the carrier pulse waveform is identical on all three phases; therefore, the net voltage appearing across any phase of the motor windings due to the carrier alone will be zero.
The carrier is said to be unmodulated, and no drive power is applied to the motor.
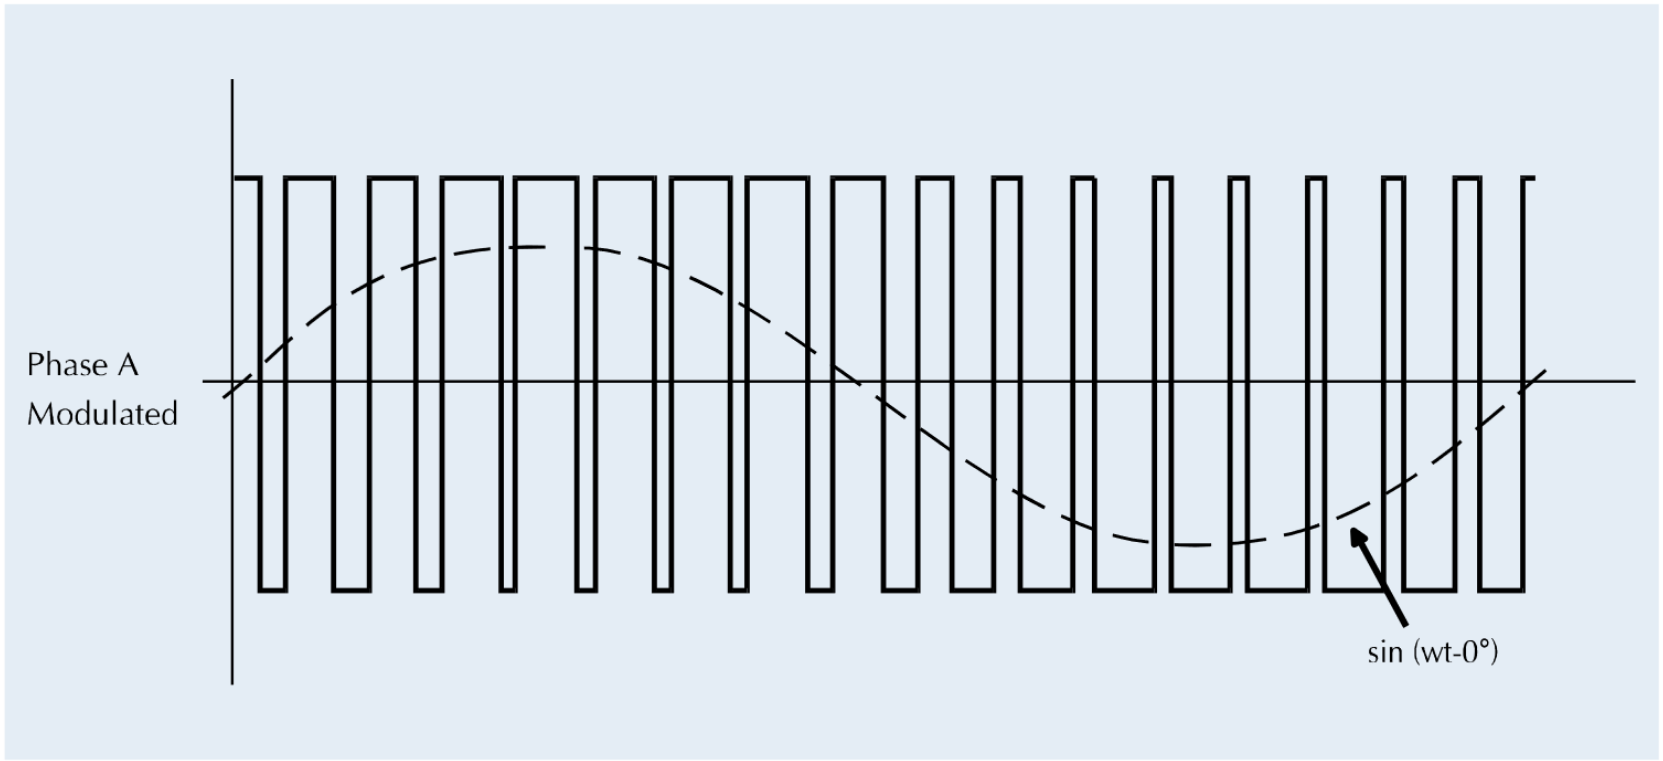
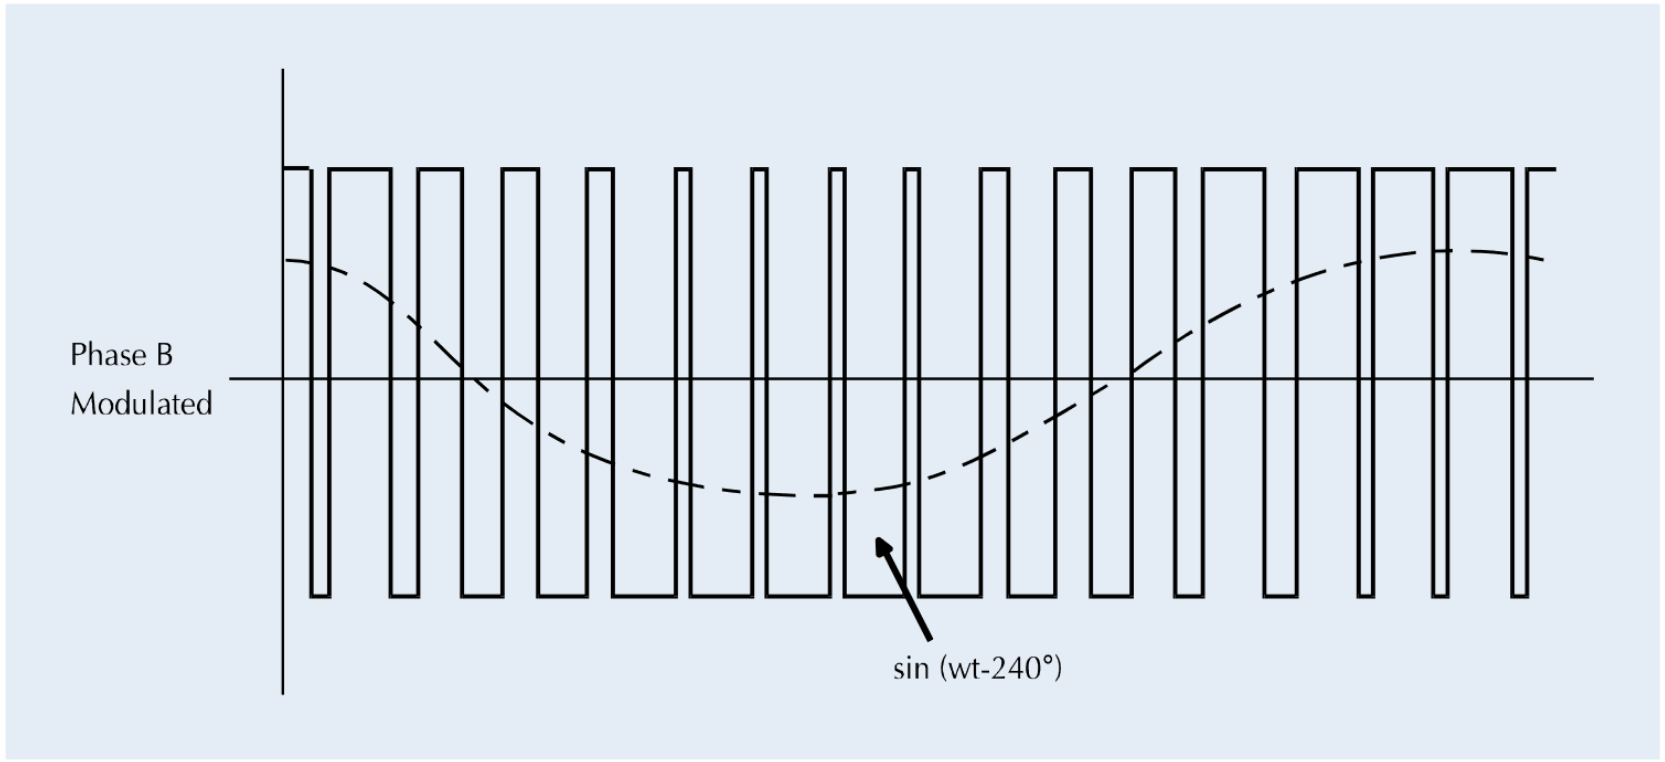
In order to drive the motor, the control electronics generates three low-frequency sinewaves, 120° apart, which modulate the carrier pulses to each pair of switches. The width of positive and negative pulse within each carrier cycle is modulated according to the amplitude of the low frequency sine waveform of that phase, shown in Figure 5a and 5b.
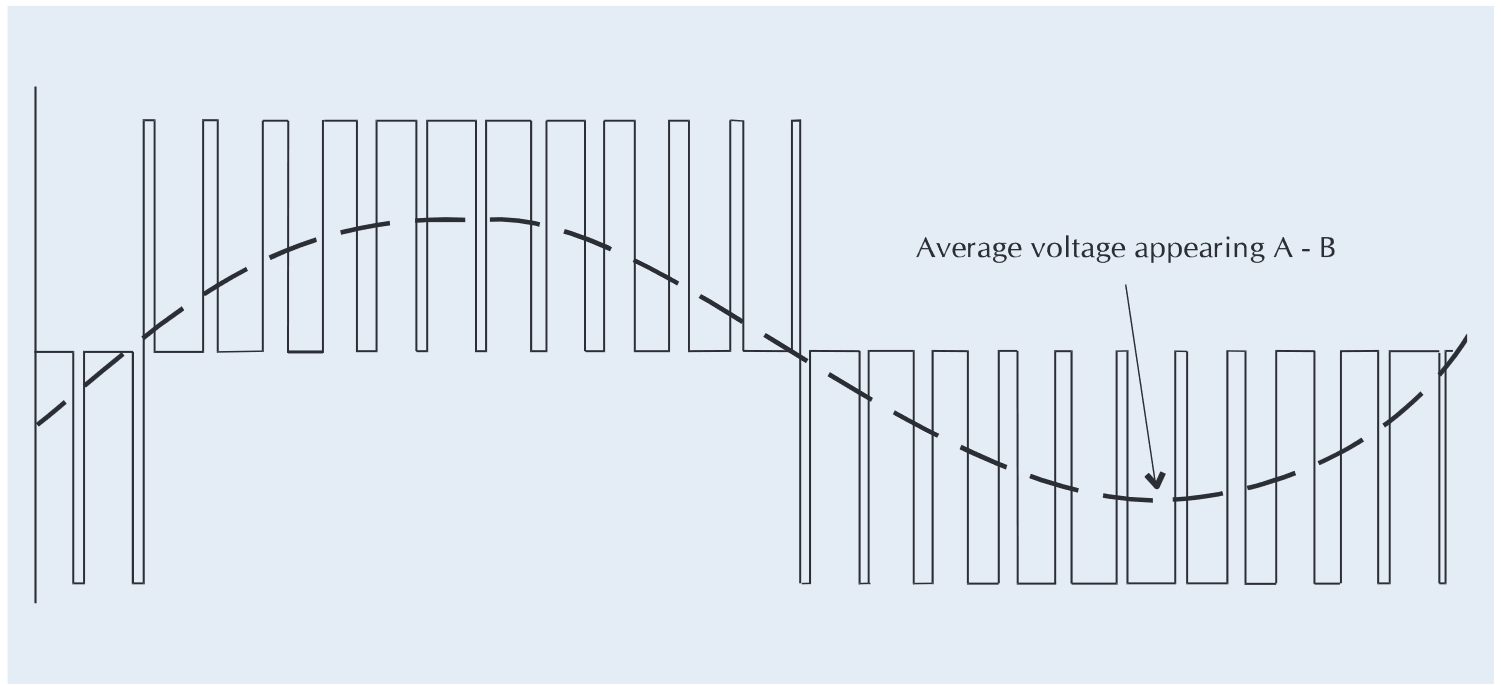
The voltage across one motor winding is the difference between the voltage waveforms shown in Figures 5a and 5b. This difference is shown in Figure 6.
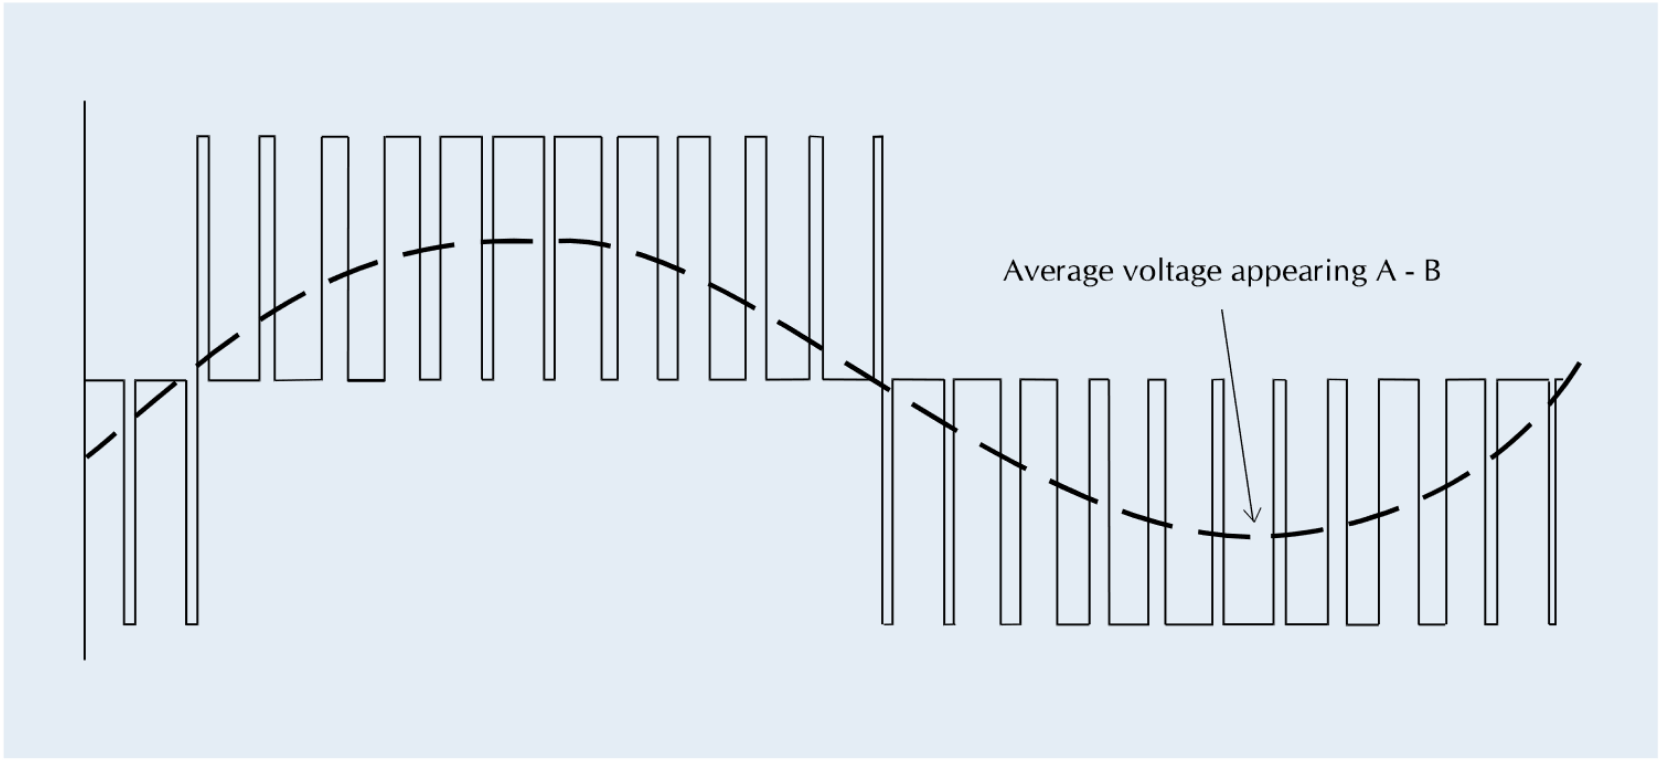
You will notice that the average voltage presented to the motor winding is approximately sinusoidal. The two other phases of the motor winding will have similar average voltages spaced 120° apart.
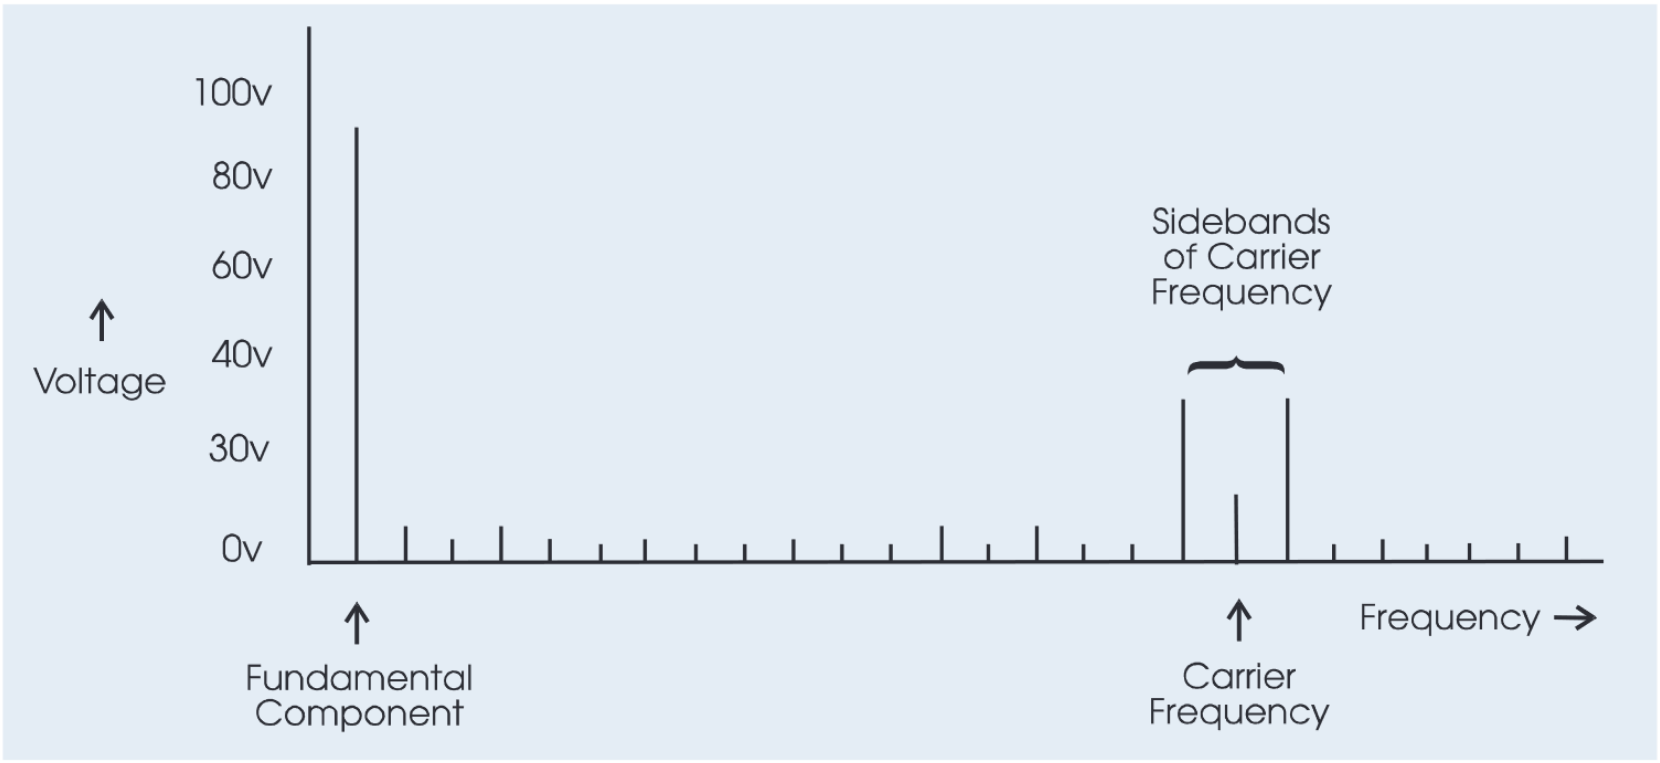
Although the pulse-width-modulated voltage waveform applied to a motor winding contains a component at the required frequency, it also contains a number of other, higher frequency components. For example, the phase-to-phase waveform in Figure 6 has a frequency spectrum as shown in Figure 7.
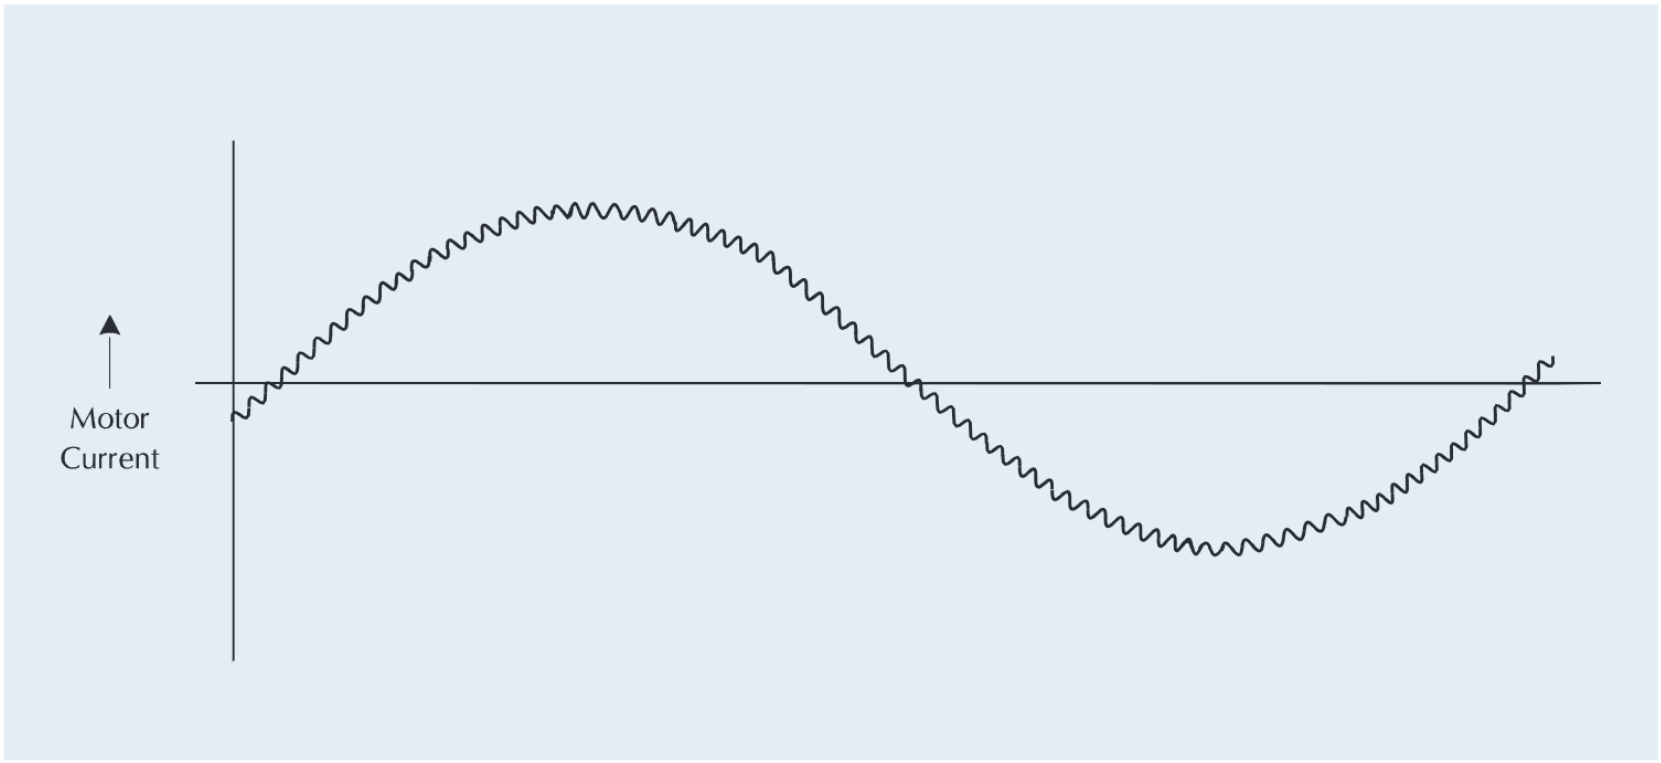
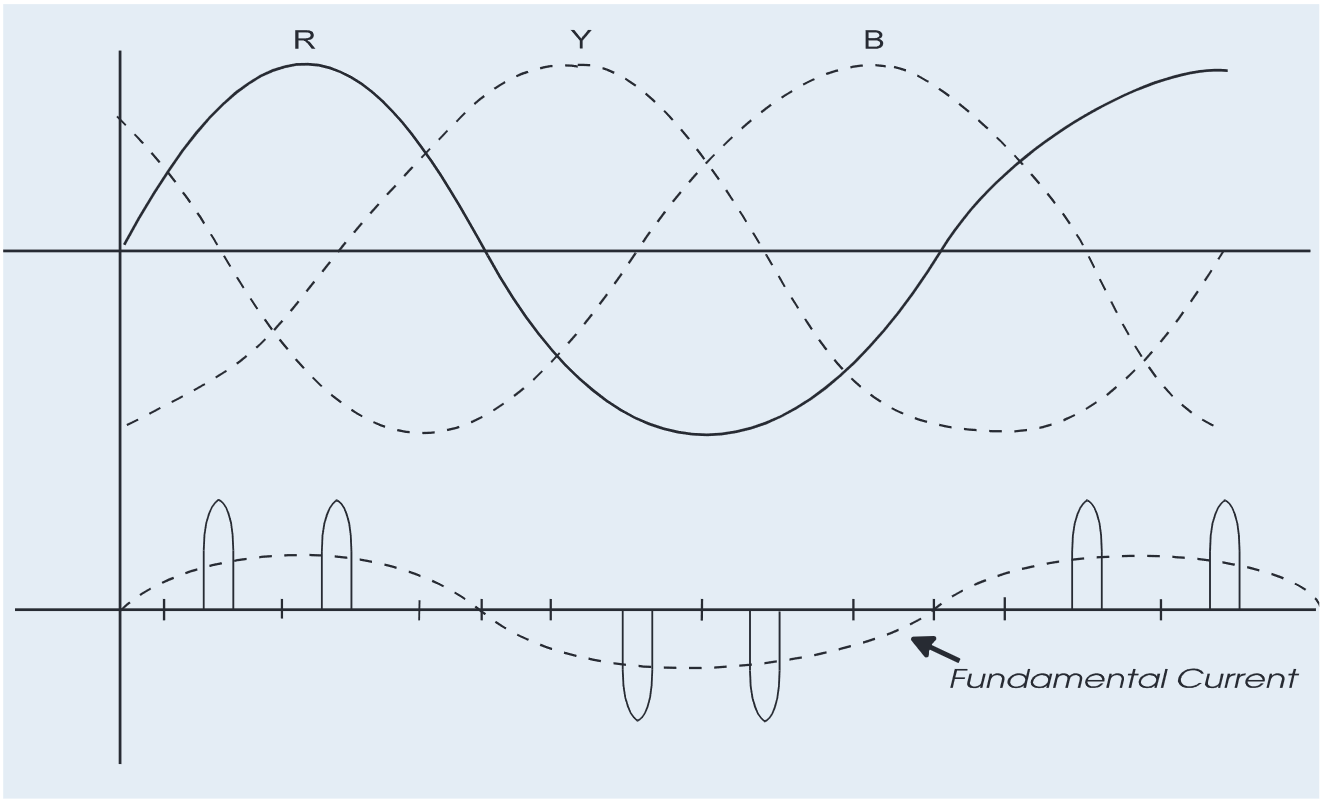
Fortunately, to a large extent, the motor appears as an inductor to the output voltages of the inverter. As an inductor has higher impedances to higher frequencies, most of the current drawn by the motor is due to the lower frequency components in the PWM output waveshape Figure 8 shows. This results in the current drawn by the motor being approximately sinusoidal in shape.
By controlling the amplitude and frequency of the modulating waveforms, the PWM drive can output to the motor a three phase supply at the necessary voltage and frequency to drive the motor at any required speed.
3. Electrical Characteristics of a PWM Motor Drive
Voltage-frequency Relationship
The characteristics of a PWM motor drive can best be understood by considering a simplified equivalent circuit of one motor phase as shown in Figure 9.
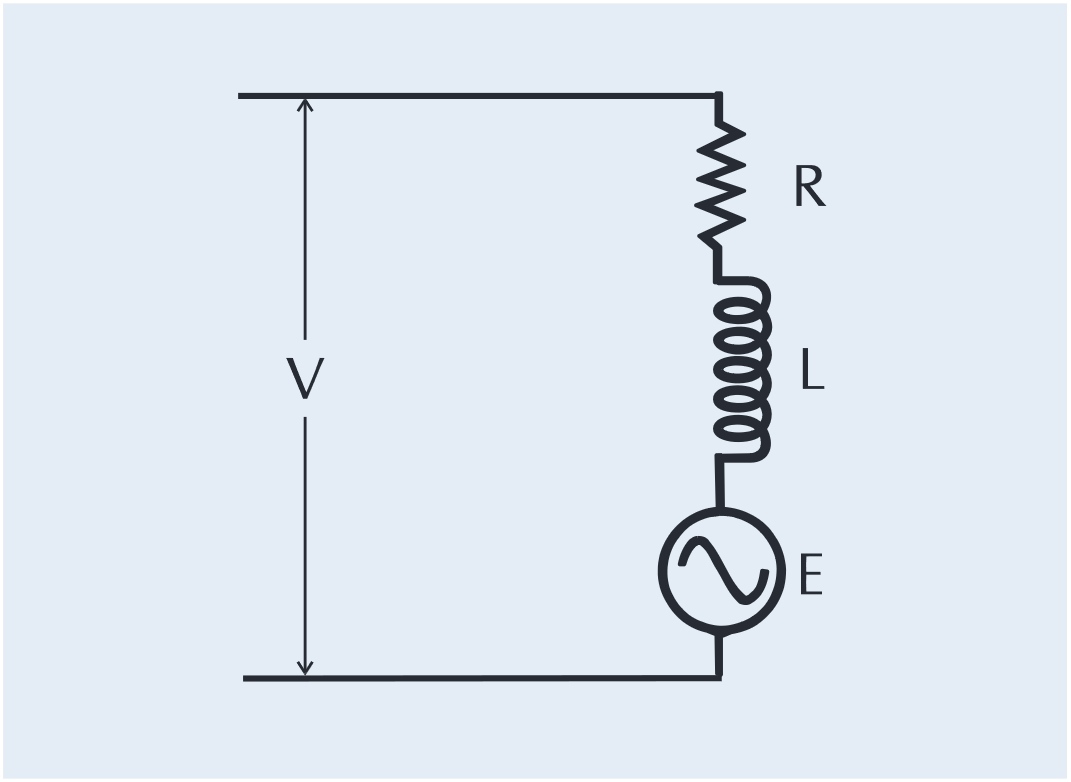
In this circuit, R and L represent the resistance and inductance of the motor as seen by the supply, and E represents the back EMF produced by motor rotation.
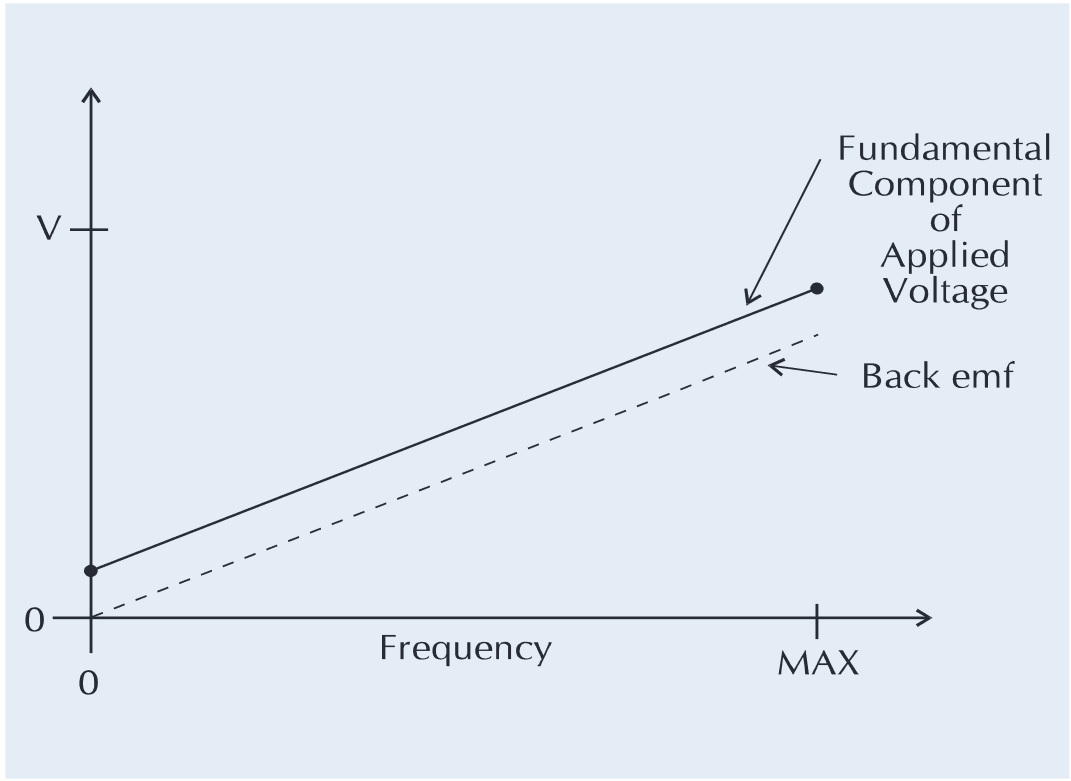
The magnitude of the back emf, and its frequency, is proportional to the motor speed. The PWM drive must therefore adjust both the voltage and the frequency to adjust the speed, with an output voltage slightly higher than the back emf to force current through the impedance of R and L. In fact the drive electronics need to produce a voltage/frequency characteristics as shown in Figure 10. The offset in this characteristic is to overcome the voltage drop in this impedance and allow the drive to deliver the required current even at low or zero speed.
Choice of Carrier Frequencies
Most PWM drives operate with a fixed carrier frequency that is several times higher than the highest output frequency that is to be used. As industrial drives operate with an output frequency from a few Hertz up to about 100 Hz, they use a carrier frequency in the range of 2 kHz up to about 10 kHz.
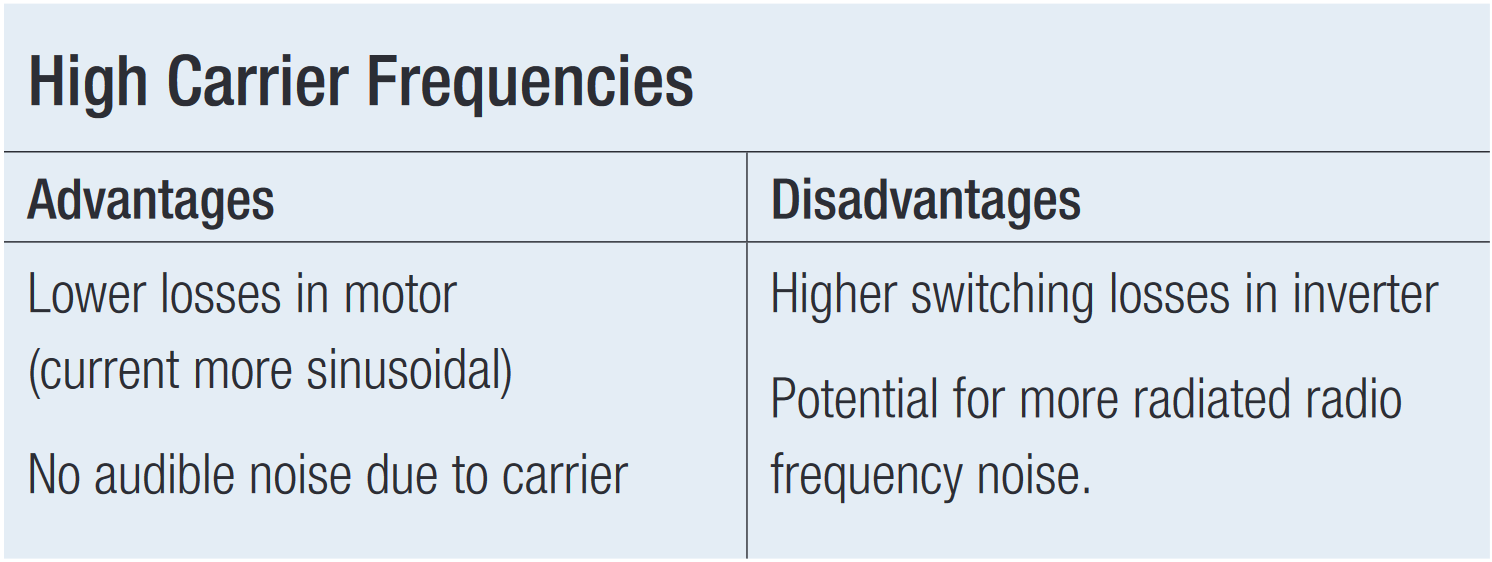
As power semiconductors improve, the trend is to increase carrier frequencies up to ultrasonic frequencies (> 18 kHz) but this brings both advantages and disadvantages, see Table 1.
The choice of carrier frequency is therefore a compromise, and careful measurements must be made on both the input and the output of the drive to make the optimum choice.
Effect of Harmonic and Carrier Frequency Components in the PWM Output
Although the PWM output voltage contains a large number of frequency components other than the fundamental, these components are generally of higher frequency and suppressed by the inductance of the motor winding.
However, as shown by the equivalent circuit of Figure 9, the motor is not a simple inductor, but also generates back emf.
Unfortunately, since the back emf generated by the motor is a sinusoidal voltage at the fundamental frequency, it provides no opposition to the flow of current at the harmonic and higher frequencies. For this reason these currents are larger when compared to the fundamental than would be the case if the motor were a pure inductor.
It is important, therefore, that the modulation of the carrier frequency be designed to produce in the windings a current that is as sinusoidal as possible. In particular, care must be taken to minimize the level of low order harmonic voltages produced, as the impedance of the motor to these voltages will be very low. In practice then the drive produces in the motor:
- A 'wanted' component of current at the fundamental frequency.
- 'Unwanted' components of current at frequencies that are multiples of the fundamental frequency (these are harmonics) and also components of current at frequencies related to the carrier frequency.
The 'unwanted' components in the motor current have two effects on the motor:
- Components of current other than the fundamental represent additional currents in the motor stator and rotor windings, creating additional heat and reducing motor efficiency.
- The 'unwanted' components create magnetic fields in the stator that may have negative or zero phase sequence, producing negative or braking torque. This can substantially reduce the amount of power available from the motor.
The effects of these unwanted components on the operation of the motor can be expressed by measurements of the fundamental and total output power of the inverter, by harmonic analysis of the voltage and current waveforms, and by torque/ speed measurements on the motor.
The only useful power delivered to the motor is at the fundamental frequency. Any power associated with the harmonics or carrier frequency does not contribute to the useful work done by the motor. The most efficient PWM drives are those that not only minimize losses in the converter, but also generate the most pure current waveforms to minimize power and torque losses in the motor itself.
4. Measurements on PWM Motor Drives
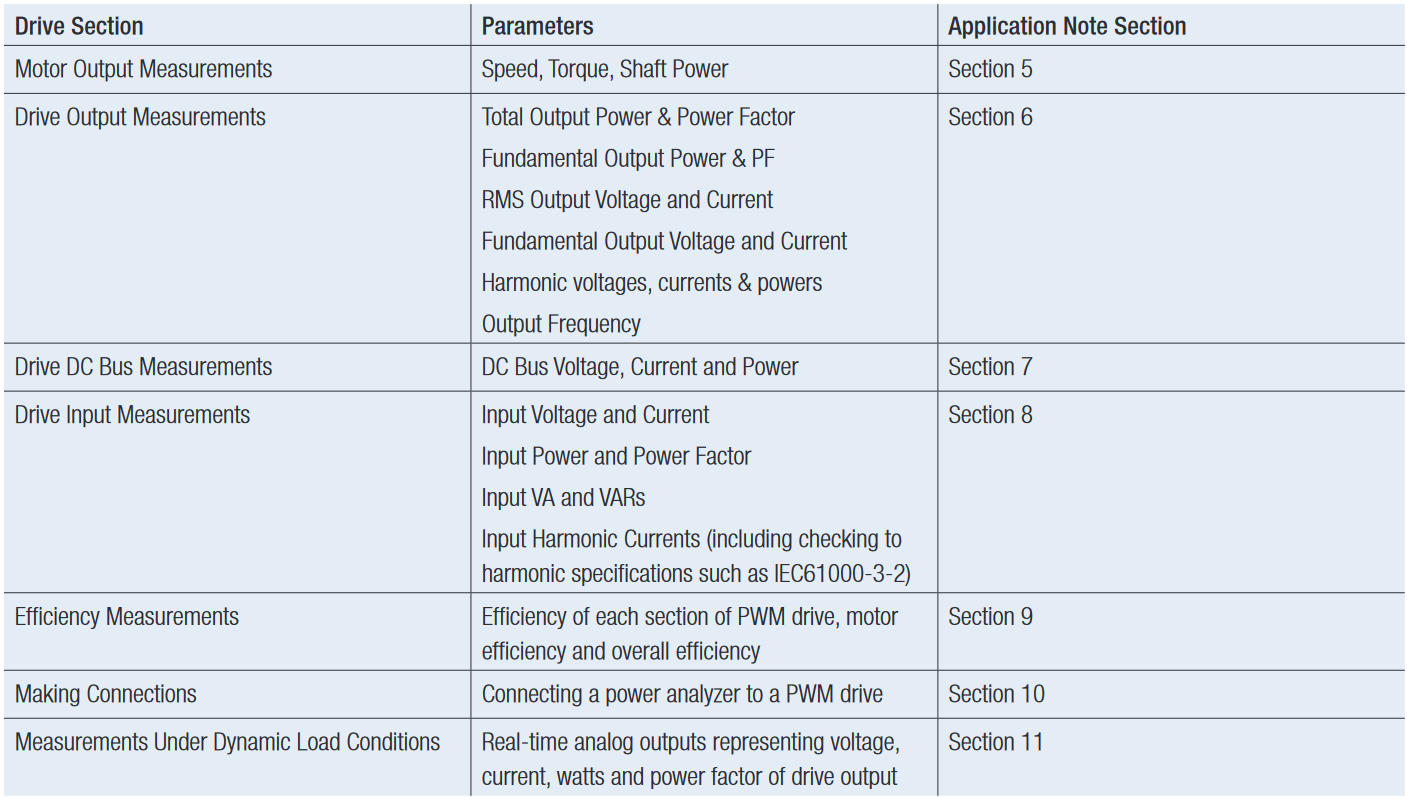
Table 2 shows the typical measurements made on PWM motor drives and motors.
5. Motor Output Measurements
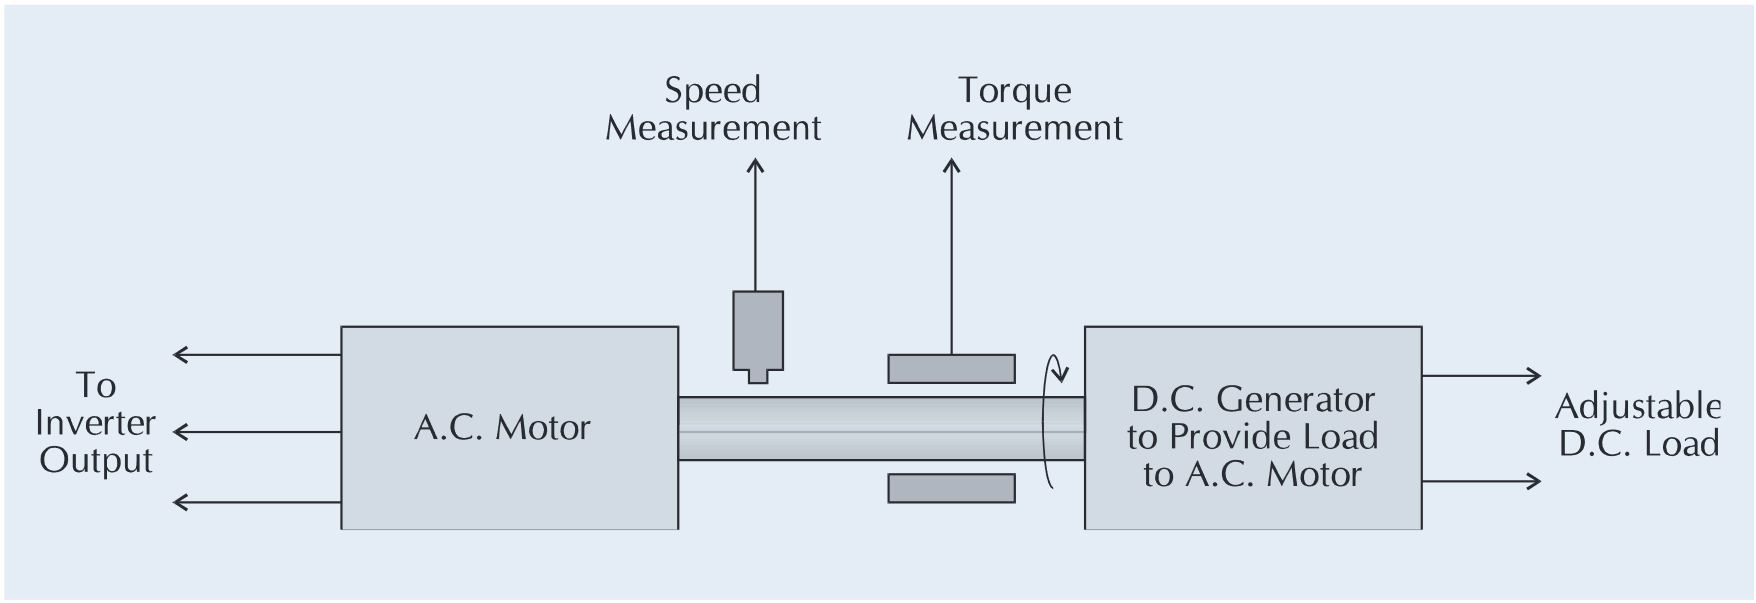
Figure 12 shows motor output measurements can be made by installing speed and torque transducers on the output shaft of the motor.
5.1 Torque and Speed Sensors
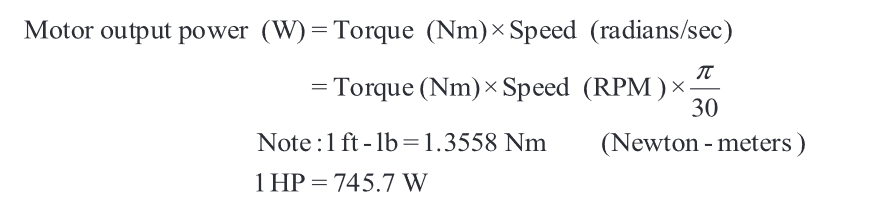
Torque and speed transducers produce electrical signals that are proportional to the motor torque and the motor speed. By measuring these signals the motor speed and the motor torque can be determined, and from these measurements the motor output power can be calculated:
5.2 Torque
The torque of a motor is the rotary force produced on its output shaft, it is a twisting force that is measured in Newtonmeters (Nm) or Foot-pounds (1 foot-lb = 1.3558 Nm). Torque ratings range from less than 1 Nm for small motors, to several thousand Nm for large motors.
Torque can be measured by rotating strain gauges as well as by stationary proximity, magnetorestrictive and magnetoelestic sensors. All are temperature sensitive. Rotary sensors must be mounted on the shaft, which may not always be possible because of space limitations.
To measure torque, a strain gauge is often installed directly on a shaft. Since the shaft rotates, the torque sensor must be coupled to the outside world by slip rings, wireless communications, or inductive coupling.
5.3 Speed
Motor speed is commonly described as revolutions per minute (RPM) which is the number of full rotations completed in one minute around a fixed axis.
A speed sensor output may be an analog voltage that is proportional to speed. More commonly the output of the speed sensor is a TTL pulse produced by a disc on the motor shaft. By measuring the frequency of the TTL signal and applying a scaling factor, the motor speed can be determined.
For example, if the rotating disc produces n pulses per revolution, the RPM can be calculated as:

5.4 Combining Torque and Speed Measurements with Electrical Measurements
In order to determine the efficiency of a motor and drive combination, you must consider both the electrical input to the system, and the mechanical power produced on the output of the motor. The motor output power is the product of the torque and speed:
The system efficiency is calculated from the formula:
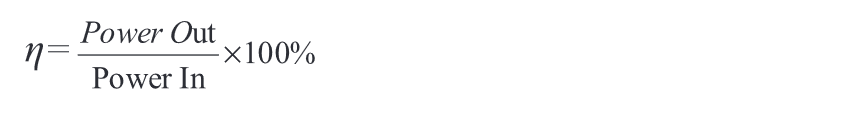
In order to make these measurements, the PA4000 includes sensor inputs designed to connect torque and speed transducers. By measuring both the electrical power consumed on the input to the drive, as well as torque and speed on the motor’s output, the efficiency of the system can be measured using a single instrument.
6. Drive Output Measurements
The output waveform of a PWM drive is very complex, consisting of a mixture of high frequency components due to the carrier and components at low frequency due to the fundamental.
The problem this poses for most power analyzers is that they can either measure at high frequencies, in which case low frequency information in the waveform is lost; or else they filter the PWM waveform to measure at low frequencies, in which case high frequency data is lost.
The difficulty occurs because the waveform is being modulated at low frequency. High frequency measurements, such as total rms voltage, total power etc, must therefore be made at high frequency but over an integral number of cycles of the low frequency component in the output waveform.
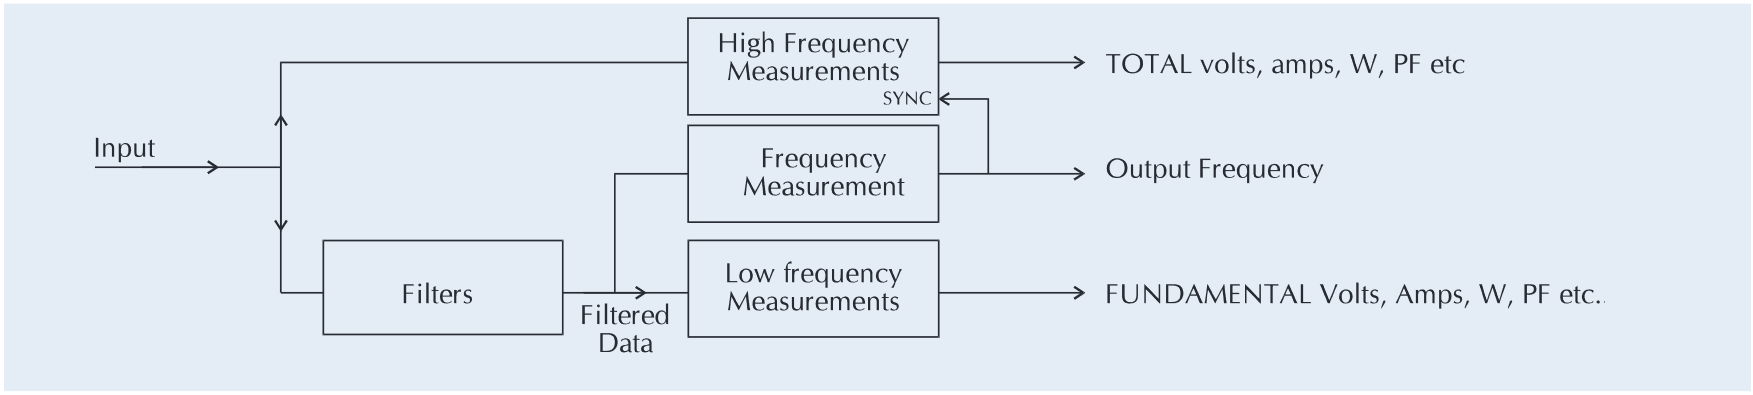
The Tektronix PA4000 power analyzer overcomes this problem by using a special operating mode for PWM output measurements. The data is sampled at high speed, and TOTAL quantities, including all harmonic and carrier components, are computed in real time. At the same time, the sampled data is digitally filtered to provide low frequency measurements such as FUNDAMENTAL and measurement of output frequency.
In addition to getting both low and high frequency results from the same measurement, this technique allows the high frequency measurements to be synchronized to the low frequency signal, which is the only way of providing high frequency measurement results that are both accurate and stable.
There is a choice of three filters to select according to the output frequency range to be measured, see Table 3.
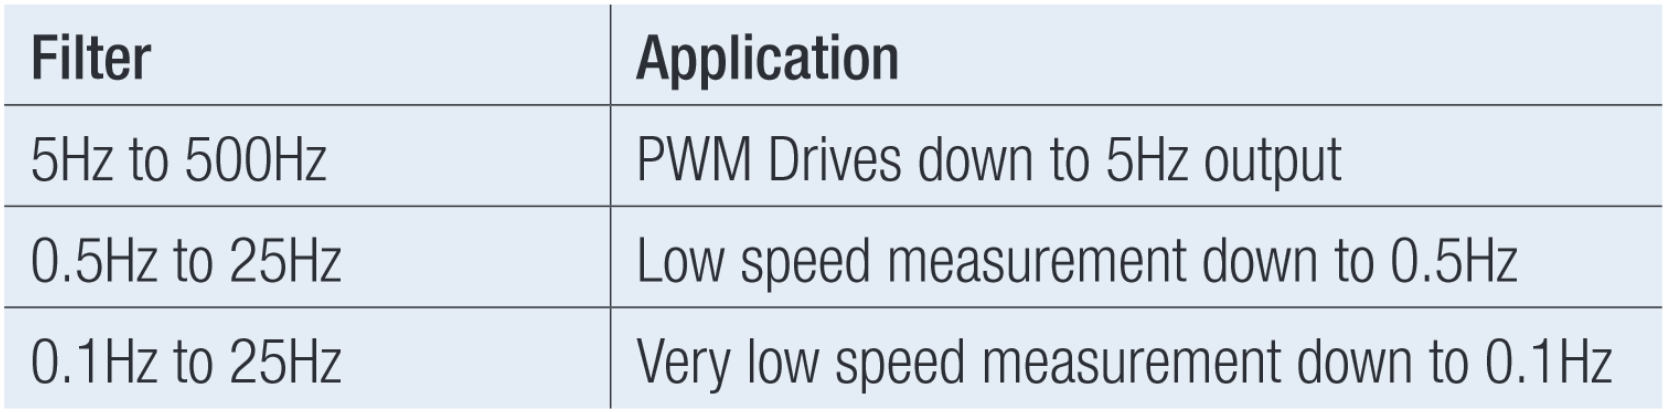
The choice of filter does not affect measurement of the higher frequency components since these measurements are made on unfiltered data. However, to optimize low frequency measurement results, you should choose the correct filter for your application.
6.1 Drive Output Measurements Using the PA4000
The instrument is wired to the output in the 3 phase 3 wire configuration. (Also known as two wattmeter method - see the application note Fundamentals of Three-Phase Measurements for more on the two-wattmeter method.) For PWM drives with up to 30A of output current, the PA4000 may be connected directly to the output of the drive via its internal current shunts as shown in Figure 15.
For PWM drives with more than 30 A of output current, you can use either external current transducers or external current shunts. Tektronix offers a range of fixed core current transducers up to 1000 A. These transducers include a cable that allows for quick connection to the PA4000 and takes advantage of the instruments optional 15 VDC power supply. To use the PA4000 Power Analyzer with external shunts, you connect the shunts to the external shunt voltage inputs. These input can measure shunt outputs from X V to Y V. For both current transducers and external shunts, it’s important to remember to set the scaling correctly
Especially for lower current drives, the PA4000 should be wired directly to PWM outputs if possible. This is because, while AC current transformers and Hall-effect CT's provide good accuracy with higher currents, they tend to give poor results with currents of just a few amps.
The PA4000 input circuitry is optimized to give excellent results from its current shunts, in spite of extremely high common mode voltages that occur on PWM drive outputs. The voltage across the shunt may be only a few millivolts, but the shunt potential is moving up and down with respect to the ground by hundreds of volts at several kV per microsecond.
Although only two channels of the PA4000 are used for measurements using the two wattmeter method, the instrument will vectorially compute and display values for the current in the third (unmeasured) wire. This provides a valuable check on the balance of the load. In addition, because the third channel of the analyzer is not required for the two wattmeter method, it is available as an independent channel to measure, for example, the dc bus within the PWM drive, as described in section 7.
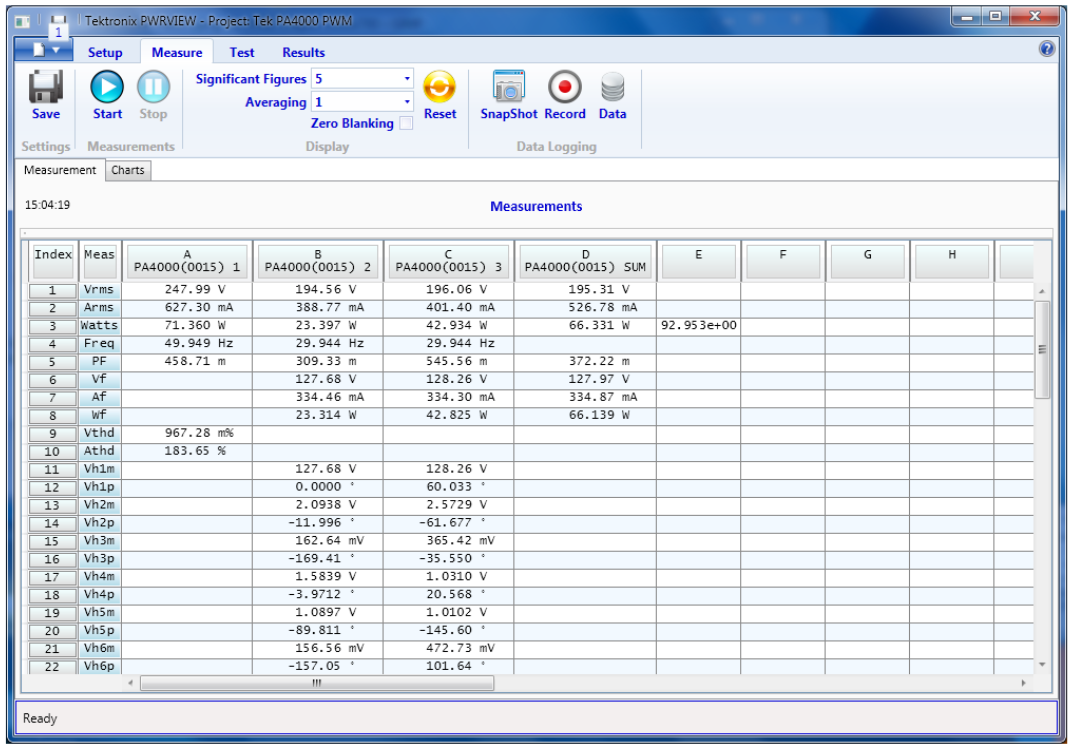
Once the analyzer is connected and configured, it will measure the drive output power with the selected filter. If the PA4000 has difficulty measuring frequency, ensure that the correct filter frequency range has been specified.
Note that the Vrms, Arms, and Watts figures are measured from pre-filtered values and therefore include all high frequency components, whereas the fundamental values only consider contributions to work in the motor. It is normal to have a significant difference between the rms and fundamental voltage. Normally there is a smaller difference in current and watts because the inductive motor filters the current.
High frequency losses may be estimated by the difference between the total watts and the fundamental watts read on the SUM channel. This represents electrical power delivered by the PWM drive which does not contribute to mechanical output power and therefore adds to the heating of the motor:
High Frequency Losses = Total Watts - Fundamental Watts
This is a useful measurement when comparing PWM drives.
7. Drive DC Bus Measurements
Although the link between the input and the output section of the PWM drive is referred to as the dc bus, the voltage and current in this bus are far from pure dc, so care must be taken in making the necessary measurements.
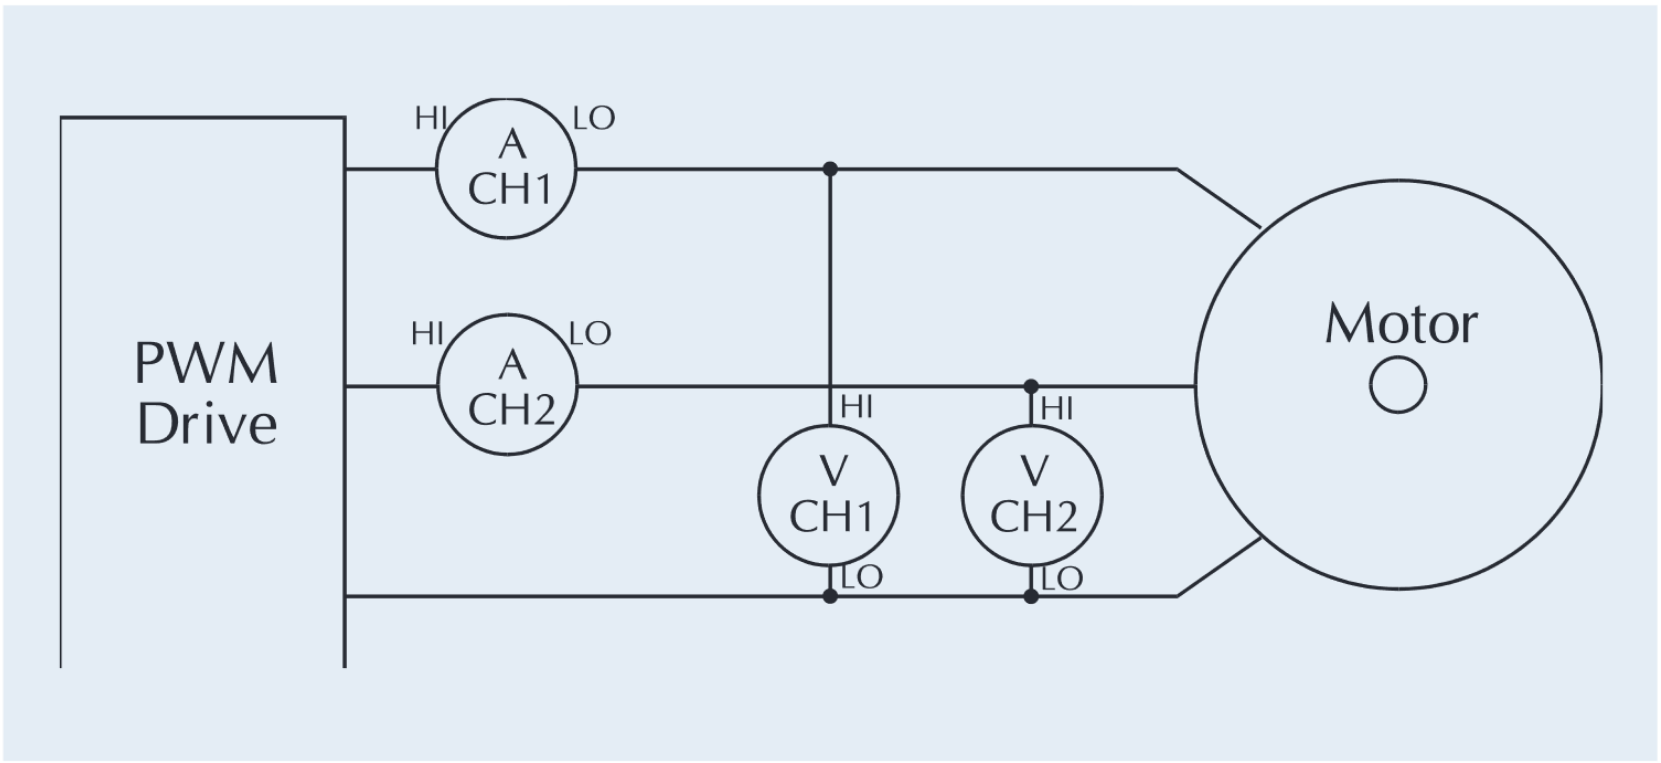
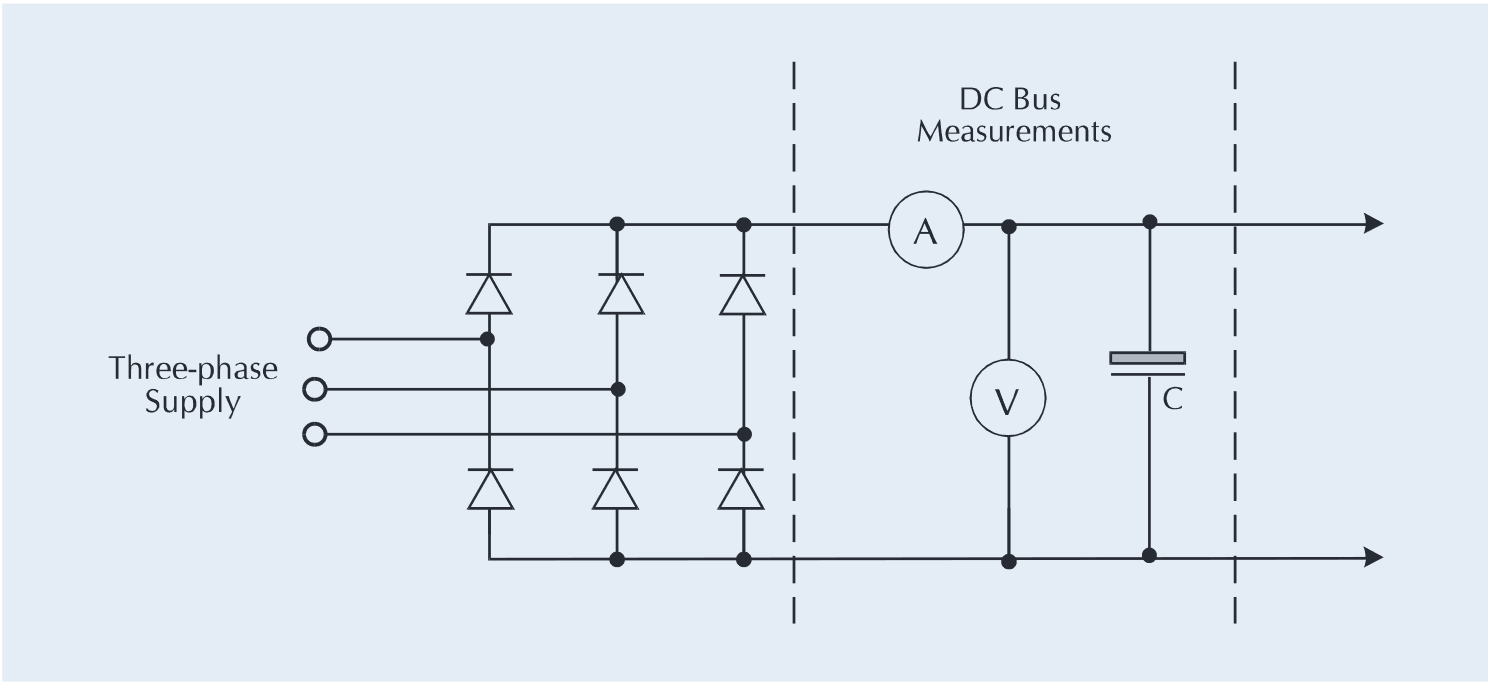
DC bus measurements are best made on the input side of the storage capacitors, as shown in Figure 16, since the current here is essentially low-frequency capacitor charging pulses from the ac supply, and free from the high frequency current pulses that may be drawn by the inverter section.
If dc bus measurements are made on their own, CH1 of the analyzer can be used. However, dc bus measurements are often made in conjunction with three-phase two-wire measurements of either the input or output of a drive. In this case the dc bus should be measured using one of the remaining channels operating independently.
For example, CH1 and CH2 are connected to make either input or output measurements as described in sections 6 and 8. CH3 is connected to the dc bus as shown in Figure 16. Select the PWM motor drive input or output mode using F[7], and enable independent CH3.
8. Drive Input Measurements
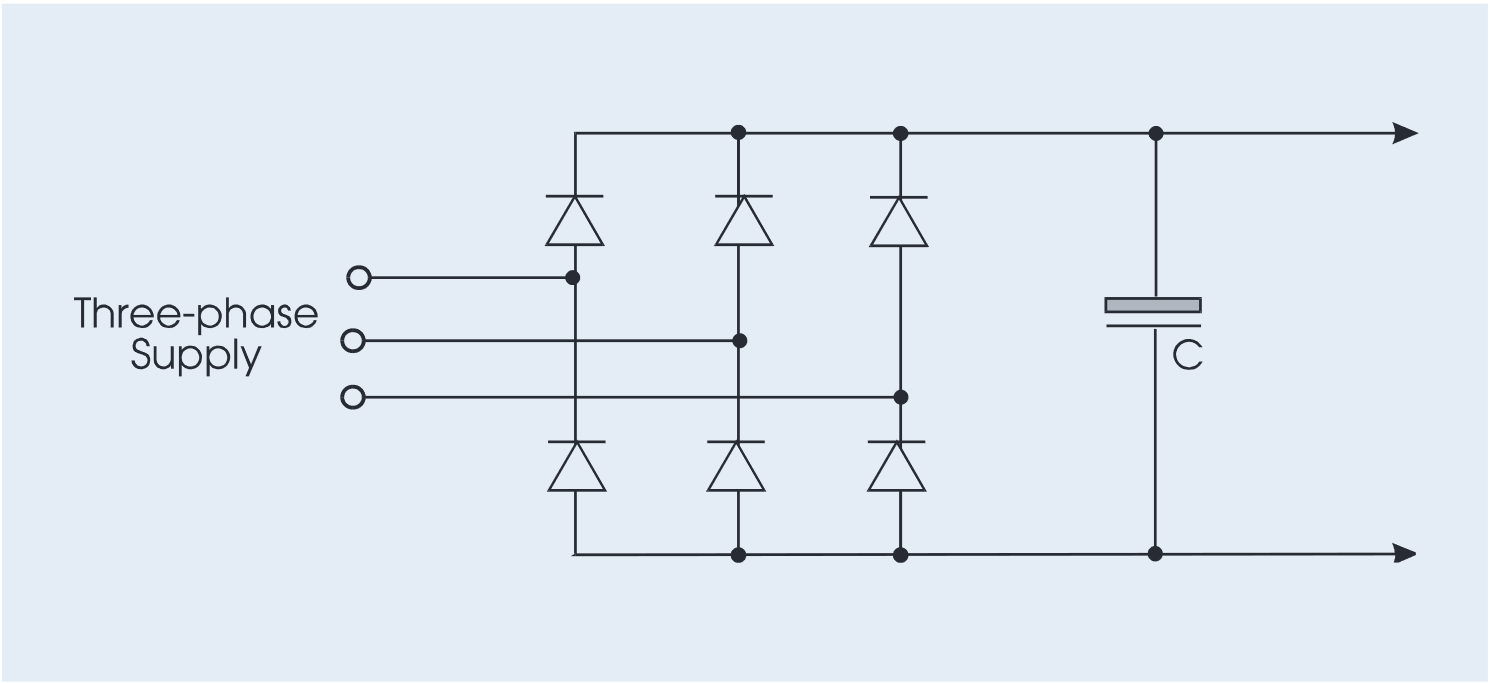
The input circuitry of most PWM motor drives is essentially a three-phase diode rectifier bridge with capacitor filter, as shown in Figure 17.
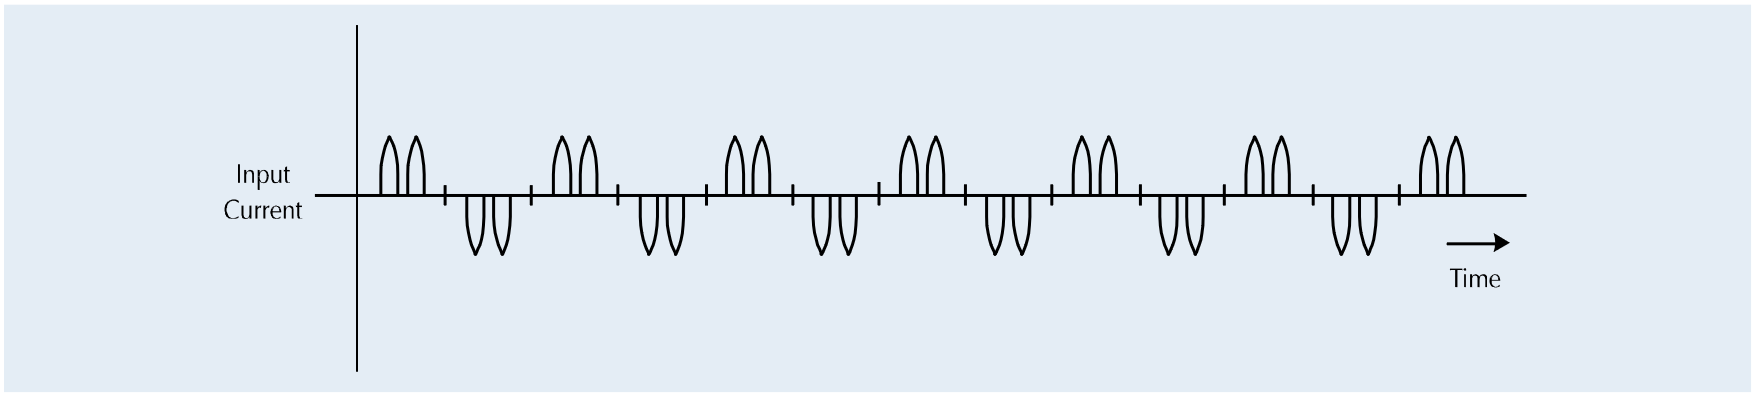
The current waveform on each input phase is made up of pulses that charge the storage capacitor. The current waveform for one phase is shown in Figure 18. It consists of a fundamental component at the supply frequency, but with considerable harmonic content.
If the inverter section of the drive presented a constant-current load to the input circuitry, the input current on each phase and would be a distorted waveform at constant amplitude, as shown in Figures 18 and 19.
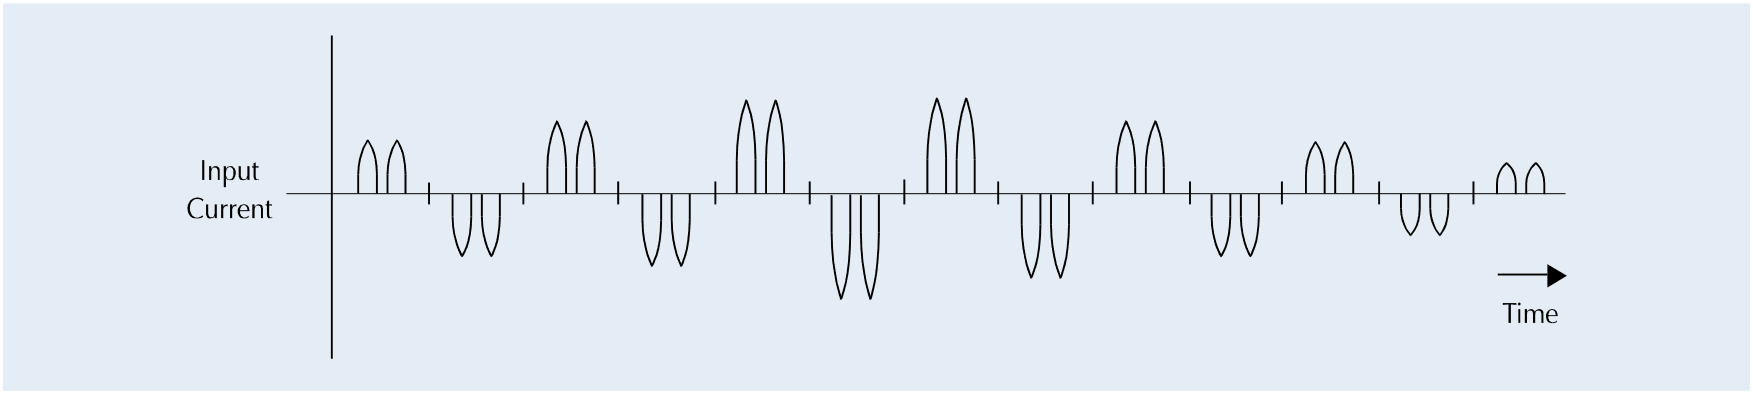
Unfortunately, the inverter section of a PWM drive may not present a constant load to the input circuit; in which case the load current drawn from the capacitor is influenced by components of the output frequency. This means that the current drawn from the ac supply is a complex, distorted current waveform at the line frequency, modulated by components of the drive’s motor frequency. This waveform is shown in Figure 20. The modulation can significantly influence measurements, especially at low drive speeds, however this can be addressed by using an extended measurement interval over an integral number of cycles of the drive output waveform.
The PA4000 enables precise measurement of input power to a PWM drive, even at low motor frequencies. The input power measurement is synchronized to the ac line frequency but measurements can be made over an extended interval by adjusting the display update rate and averaging settings.
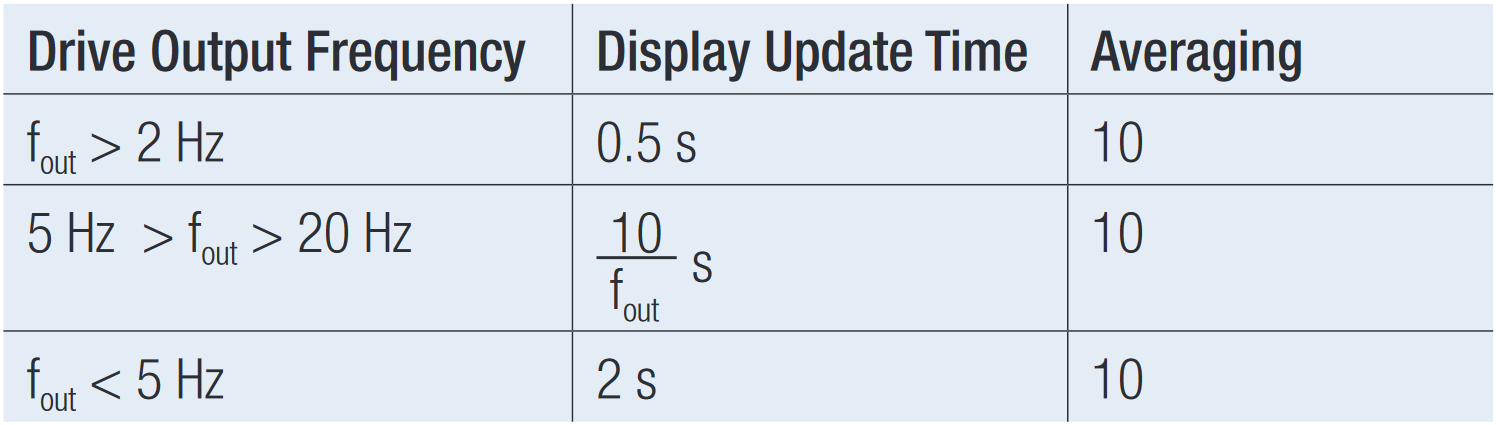
For output frequency of greater than 20 Hz, the default PA4000 settings will generally provide stable results. The default settings are:
Display update rate: 0.5 s
Averaging: 10
For output frequencies of between 5 Hz and 20 Hz, set the averaging to 10 to improve stability and set the display update time to include an integral number of measured PWM output periods (1/f). Providing 10 periods is a good rule of thumb.
For example:
Output frequency = 5.5 Hz
Display update rate = 10/(5.5 Hz)= 1.8 s
For output frequencies below 5 Hz, use the longest display update rate (2 s) together with averaging of 10.
If the readings vary too much, for example, when measuring on single-phase drives, set the averaging to 10 or greater to help stabilize the measurements.
The analyzer is wired to the input in 3-phase 3-wire configuration as shown in Figure 21 (also known as two wattmeter method - refer to the application note Fundamentals of Three-phase Measurements for the proof that the power delivered to a system via 'n' wires may be measured with 'n-1' wattmeters).
In this wiring configuration it is possible to use the third and fourth channels of the analyzer to measure the output of the drive or the DC bus within the drive.
9. Loss and Efficiency Measurements
On any system, measurements of losses and efficiency are always best made by making simultaneous measurements on the input and output of the system as shown in Figure 22.
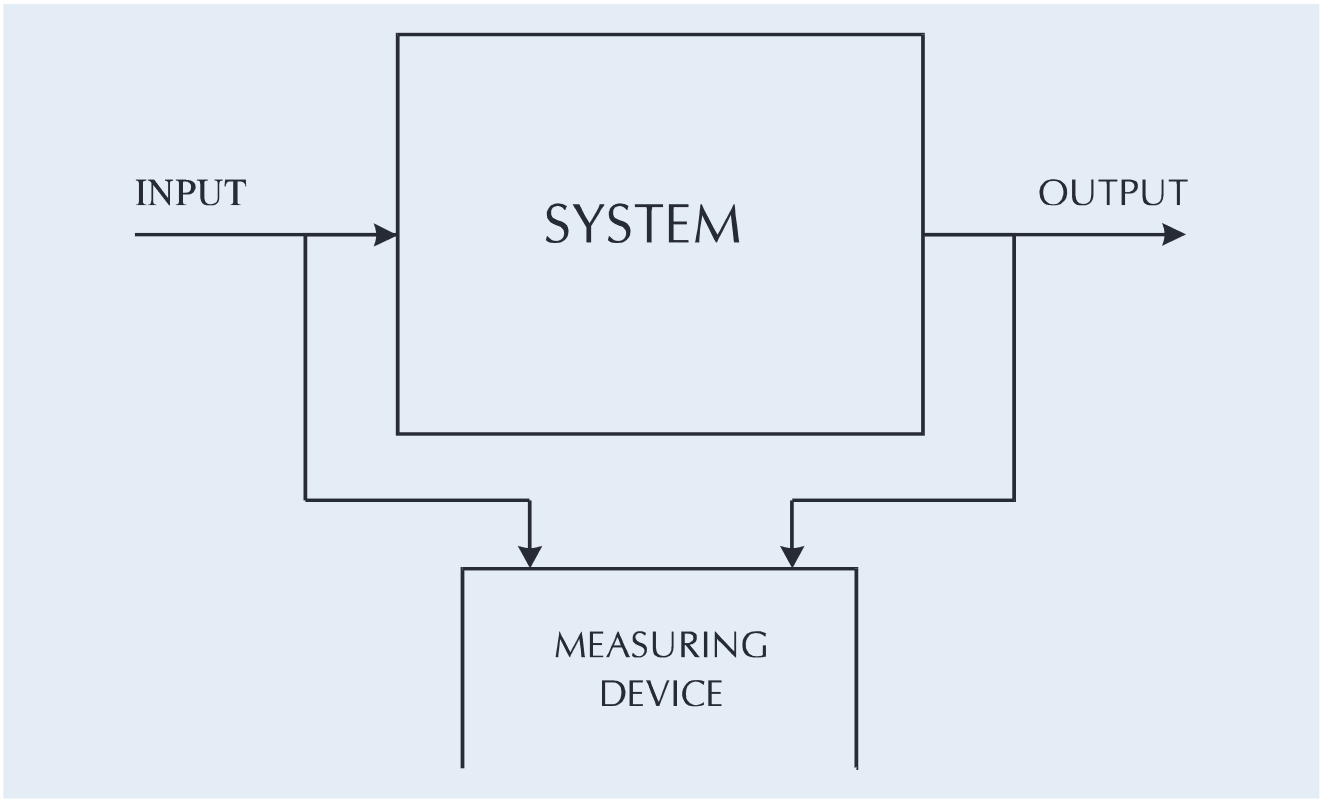
This is particularly important for systems with high efficiency, such as PWM drives. This is because, if separate measurements are made on input and output, and the system is shut down between measurements to transfer instrumentation, one cannot always be certain that exactly the same load conditions exist for both measurements. Any unnoticed difference in load conditions will appear as an error in measured losses.
For example:
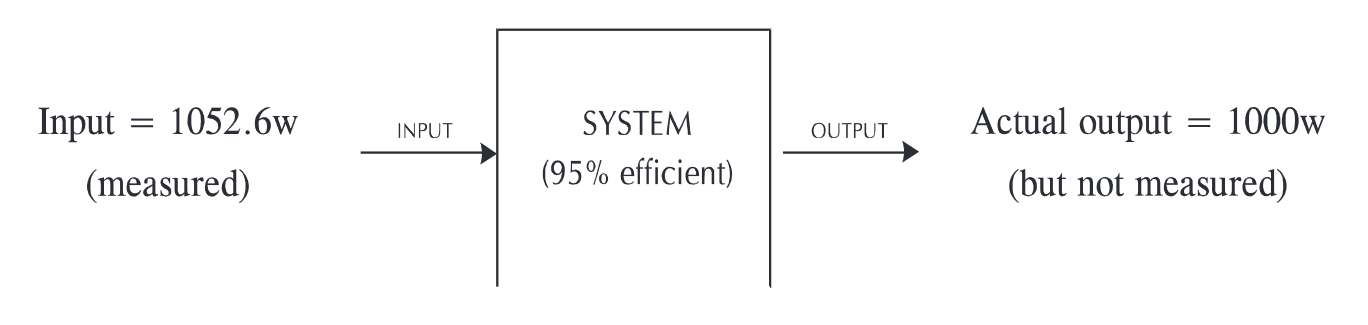
Set up Number 1 − Measure Input.
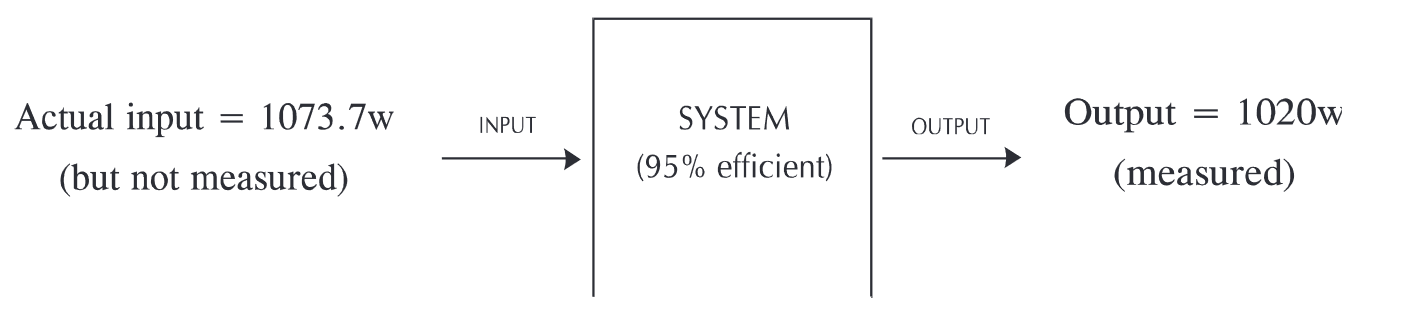
Switch off system, reconnect for output measurements, and switch on again:-
Set up Number 2 − Measure Output (but conditions have slightly changed).
Apparent losses = 1052.6 W - 1020 W = 32.6 W
Actual losses = 1073.7 W - 1020 W = 53.7 W
This represents a very substantial error in measured losses!
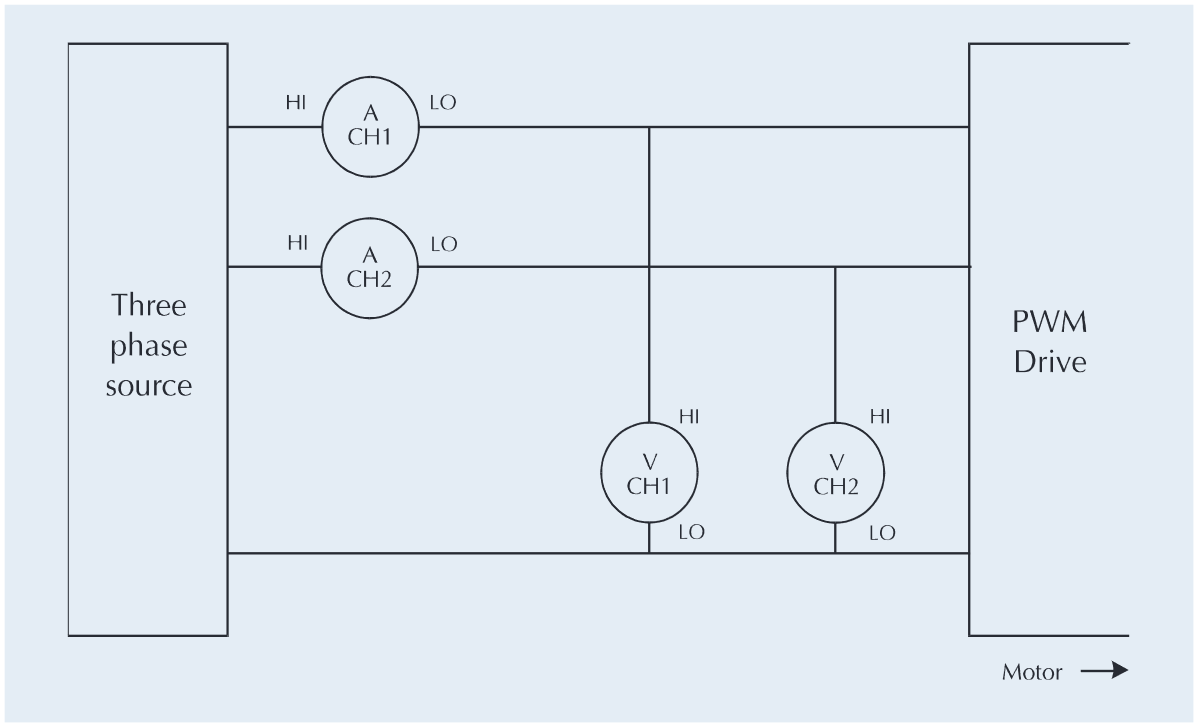
In order to avoid such errors, you can use a four-channel instrument like the PA4000 which is capable of performing two-wattmeter measurements on both the drive input and output simultaneously, as shown in Figure 23.
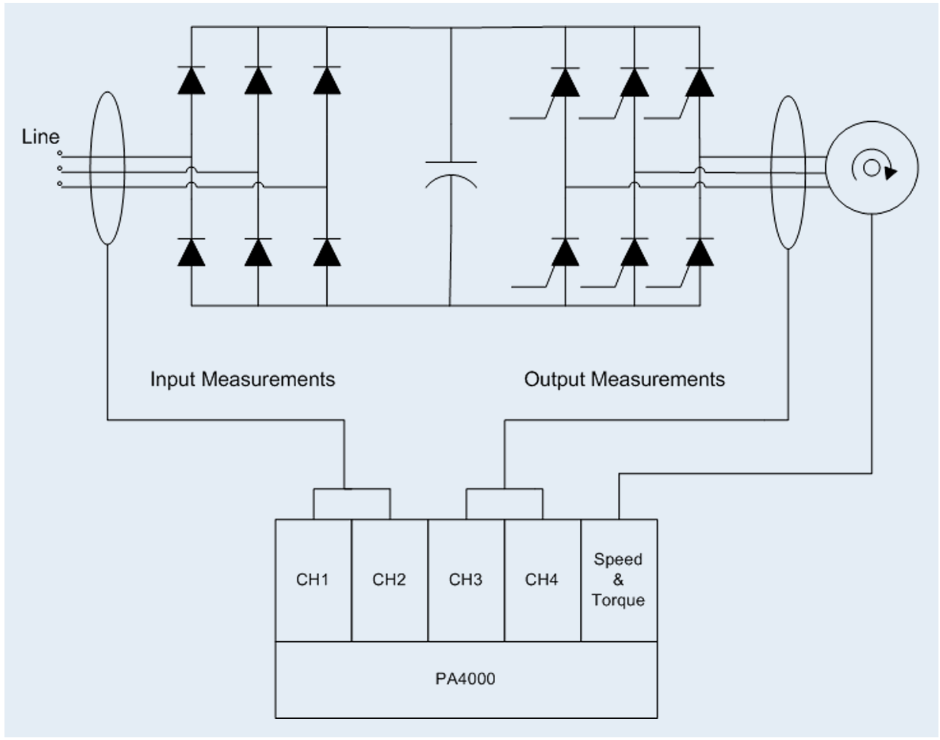
Using this method will ensure accurate measurements even though conditions may have changed slightly between input and output measurements. Slight changes in conditions do not matter since each efficiency measurement is made using simultaneous measurements.
10. Making Connections
Making voltage connections to a motor drive is generally a simple task since the voltage is measured between phases. Making current connections is more challenging.
There are 2 main ways of making a current connection. The first is to “break” the conductor and pass the current through a current shunt, and then measure the voltage drop across the shunt. While this may be practical in low power situations, it is not feasible where large currents are involved.
For large currents, current transducers may be used. In general, this involves passing the primary current carrying conductor through a current measuring device. The measuring device creates a secondary current which is proportional to the primary current.
Why Use a Current Transducer?
There are three main reasons for using a current transducer.
- The signal you are measuring may not be compatible with your measuring equipment. For example, most bench instruments are unable to measure currents greater than 100 A, which are often found in larger motors and drives.
- To decouple the measurement instrument from the signal being measured. In Pulse Width Modulated (PWM) drives, the output signal being measured often has a very high common mode component caused by fast switching voltages (dV/dt).
High common mode voltage introduces uncertainty in current measurements. Using a current transducer isolates the current inputs of the analyzer from the voltage swings, thus removing the uncertainly caused by common mode. - For convenience and safety. High voltages often exist in motor systems and are often supplied by extremely low source impedances. Large amounts of energy can flow if connections are not made correctly.
Picking the Right Current Transducer
There are many types of current transducers, but the 4 most common for motor measurements are:
- Current clamp
- Closed Loop Hall Effect
- IT-type closed loop
- Current transformer
For best performance over the typical bandwidth of signals found in a motor drive, closed loop transducers offer the best performance. Current transformers and clamps can be used on the drive input, but will not work well on the drive output. This is because current transformers perform poorly at low frequencies (low drive speeds) and also limit your ability to measure high frequencies associated with switching.
When choosing a transducer, it is very important to consider the signal being measured and the measuring equipment. Pick a transducer with a maximum input range that corresponds closely to the maximum signal (including peaks) you need to measure. This will make the best use of the range of the transducer.
You also want to have a transducer output signal that is as large as possible for the measuring equipment, without causing an over-range. The larger the input signal, the greater the signal to noise ratio, and the better your measurements will be.
Using a Current Transducer
For a closed loop Hall Effect current transducer, care should be taken in making the connections. Power will need to be provided to the transducer. The power usually consists of both positive and negative supplies and must provide sufficient current, typically 10mA to 50mA.
The transducers should be placed as close to the measurement instrument as possible to reduce coupling of voltage and magnetic fields in the secondary leads.
The output of the transducer is a single current output with a common return for the signal and power supplies. The output should be connected directly to the high terminal of the current input on the measuring instrument. The low terminal of the current input on the measuring instrument should be connected to the same return as the transducer power supply. Again, all leads should be kept short. The output should be kept in close proximity to the power supply connection. Ideally the 3 wires should be twisted together.
In a PWM drive environment it is good practice to allow for further ground bonding and shielding in case it is required. Using a stackable 4mm on the low connection will allow the low connection to be easily grounded.
Shielding the cable will also improve performance. The shield would be grounded to the common terminal of the transducer power supply and, if applicable, to the ground on the transducer. The shielding should surround both the power supply connections and the signals.
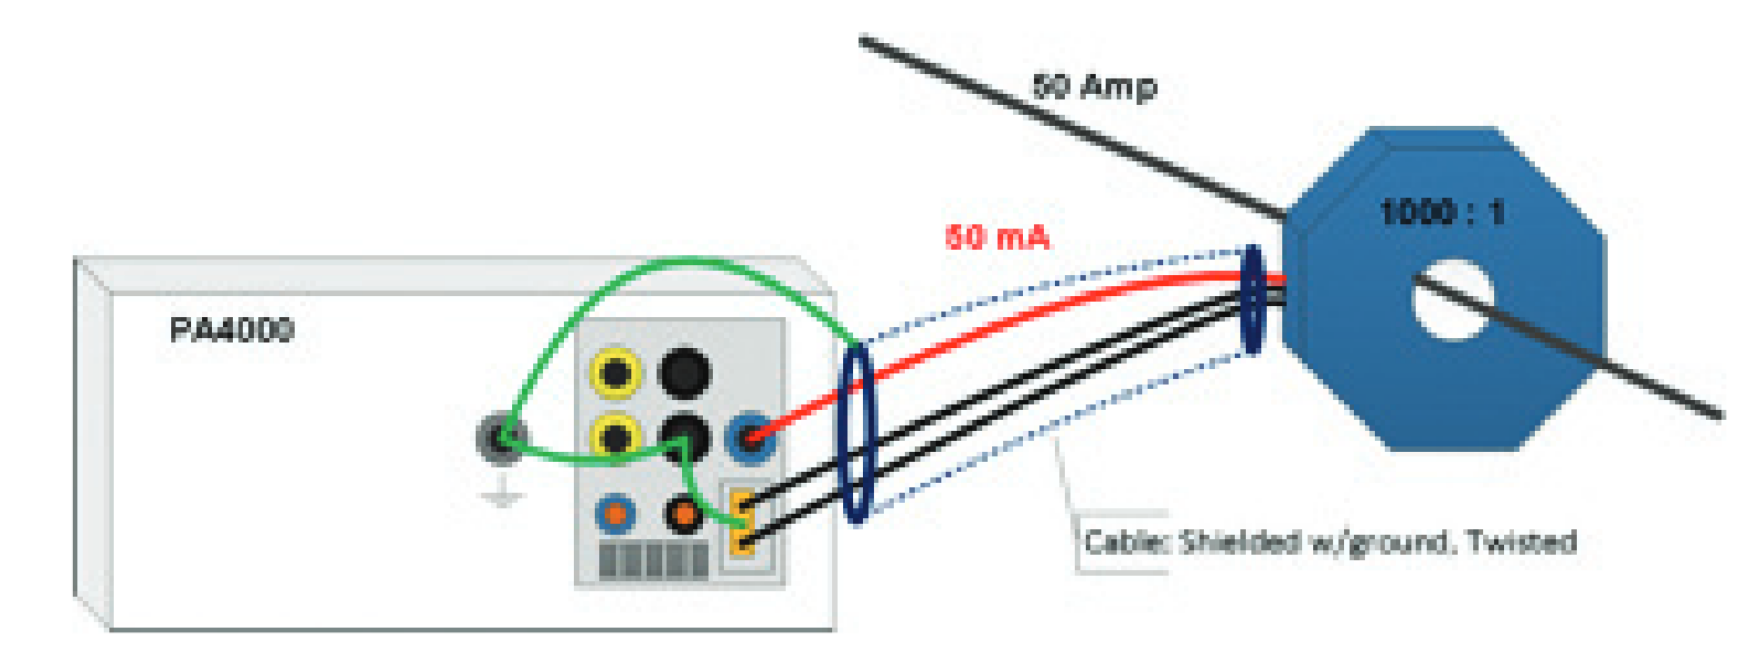
If the current in the primary is a small percentage of the rated current, or the output of the transducer is low compared to the current ranges available on the measuring instrument, the performance of the circuit can be improved by passing the current through the core of the transducer more than once.
For example, if the only transducer you have is 1000A in to 1A out (1000:1), but you want to measure 10A, the output current would only be 10mA. To make better use of the measuring system, passing the primary conductor through the transducer 10 times would increase the output current to 100mA. From a primary perspective, the primary current has been increased from 10A to 100A.
For all styles of current transducers, the measuring instrument will need to be scaled to read current correctly. Taking the example of a 1000:1 current transducer, the actual current being measured is 1000th of the real current. Therefore, the current input needs to be scaled within the instrument by a factor of 1000.
Using Current Transducers with a PM4000
The PA4000 is designed to be used with external transducers. Design features include:
- Optional +/-15V supply that works with many commonly used closed loop current transducers
- Individual scaling for current on each channel
- Rear panel earth connections to simplify connection of shielding and grounding the current measurement low connection
- Built-in 1 Arms shunt which is ideally suited for current transducer outputs.
If you are using a Tektronix current clamp or transformer, the outputs of these devices are 4mm safety banana connections. The cables can be plugged directly in to the appropriate current shunt on the PA4000. Since the typical output of a current transformer or clamp is less than 1A, the built-in 1A shunt is a perfect choice.
To get accurate measurements, only 2 parameters need to be configured in the instrument:
- The shunt selection. This is set on a per-group basis.
- The scaling factor for the current input. This is set on a perchannel basis.
The scaling factor is:
Primary Current / Secondary Current
If you are using a closed loop current transducer, then power needs to be provided to the transducer. The optional +/- 15V supply built into the PA4000 is ideal for this function. The +15V and the -15V supplies need to be wired from the PA4000 to the current transducer. See Figure 24.
The output of the transducer must be connected to the AHi or A1A connector on the channel. Since the output of closed loop transducers are often less than 1A, then the A1A connection is usually the better connection. The Alo connection of the current channel then needs to be connected to the common terminal of the transducer power supply connector.
To give the best performance, the 3 connections should be twisted together and then shielded, with the shield connected to the common terminal of the transducer power supply. The transducer power supply common should in turn be connected to the earth ground terminal on the rear of the PA4000.
11. Drive Performance Under Dynamic Load Conditions
The power consumption and output characteristics of a PWM drive vary with motor load. While your test protocols will probably call for measurements under specific line or load conditions, it’s also likely that you will need to check power characteristics under changing conditions. Analyzing power characteristics during changing loads can result in large amounts of data, but with the right software and matched analyzer, you can use your PC to collect and analyze the measurements as loading or other conditions vary
In these applications, the power analyzer behaves like a precision measurement system, rapidly feeding data to the PC where it can be stored for further analysis.
Figure 25 shows Tektronix PWRVIEW software collecting measurements from a PA4000 Power Analyzer connected to a PWM drive with a single-phase line input and three-phase drive output. In addition to collecting data, the software allows you to control the analyzer so you can configure it right on your PC. Figure 26 shows an example of reading made on a three phase input, with detailed graphs of the voltage, current and watts harmonics.

12. Conclusion
PWM motor drives are now becoming the dominant method of variable speed motor control, and are being used not only in industry, but in applications as diverse as electric vehicles and domestic air conditioners. PWM drives produce complex waveforms, both on their output to the motor, and also in the electrical supply to the drive. The Tektronix PA4000 Power Analyzer overcomes this problem with the industry’s first Spiral Shunt™ technology coupled with dynamic frequency synchronization for stable tracking of the drive's fundamental frequency.
This technology combined with a special operating mode for PWM output delivers consistently accurate measurements. The data is sampled at high speed, and TOTAL quantities, including all harmonic and carrier components, are computed in real time. At the same time, the sampled data is digitally filtered to provide low frequency measurements such as FUNDAMENTAL and measurement of output frequency, making the PA4000 an ideal solution for measurements on PWM drives.
Find more valuable resources at TEK.COM
Copyright © Tektronix. All rights reserved. Tektronix products are covered by U.S. and foreign patents, issued and pending. Information in this publication supersedes that in all previously published material. Specification and price change privileges reserved. TEKTRONIX and TEK are registered trademarks of Tektronix, Inc. All other trade names referenced are the service marks, trademarks or registered trademarks of their respective companies.
06/13 55W-28942-0