Chemical engineers, chemists, and other scientists use electrical measurement techniques to study chemical reactions and dynamics. Cyclic voltammetry (CV), a type of potential sweep method, is the most commonly used measurement technique.CV involves sweeping an electrode potential linearly as a function of time and measuring the resulting current that flows through the circuit, which is typically a 3-electrode electrochemical cell. The resulting I-V data provides important electrochemical properties about the analyte under investigation.
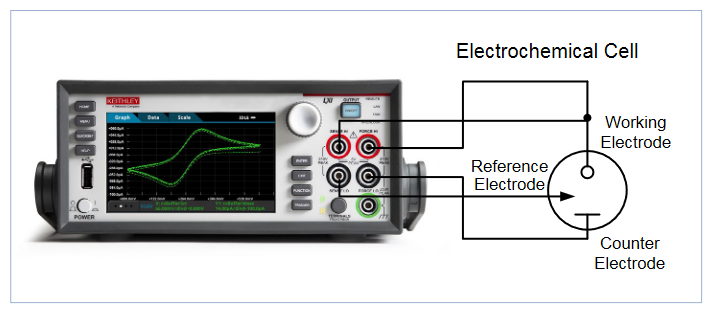
Cyclic voltammetry measurements are typically performed using a potentiostat, an often-used electrochemical measurement instrument. A Keithley Model 2450-EC or Model 2460-EC Electrochemistry Lab System can be used as an alternative for performing cyclic voltammetry and other electrochemistry tests, including use as a general-purpose lab tool for basic sourcing and measurement functions. These instruments are programmable and can source and measure both current and voltage. They also allow users to plot the I-V results and save data without an external computer controller.
This application note outlines using the 2450-EC or 2460-EC Electrochemistry Lab System to perform cyclic voltammetry using a built-in test script and electrochemistry translation cable accessory kit. The electrochemistry translation cable enables the user to easily make connections from the 4-terminal instrument to a 2, 3 or 4-terminal electrochemical cell. These systems also include a USB drive that contains six preloaded test scripts for performing electrochemical test methods.
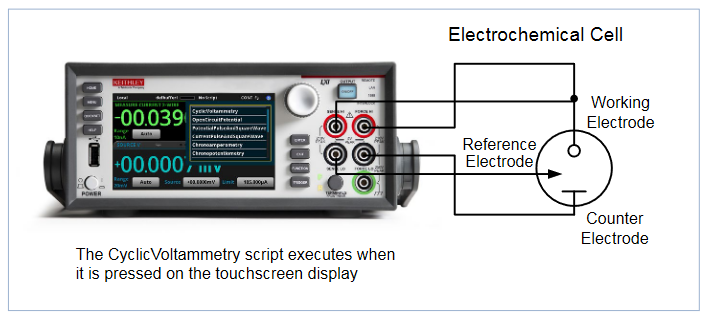
The CV test script has adjustable parameter settings and supports real-time plotting of a voltammogram on the SourceMeter's display. The user inputs the test parameters through a series of pop-up menus that appear on the display. After the test is executed, the data is stored to a USB drive inserted in the instrument’s front panel. Figure 1 shows a voltammogram plotted on the display of a 2450 instrument using the cyclic voltammetry test script.
The Basics of Cyclic Voltammetry
Figure 2 illustrates a typical electrochemical measurement circuit made up of an electrochemical cell, an adjustable voltage source (VS), an ammeter (AM), and a voltmeter (VM). The three electrodes of the electrochemical cell are the working electrode (WE), reference electrode (RE), and the counter (or auxiliary) electrode (CE). The voltage source (VS) for the potential scan is applied between the working electrode and the counter electrode. The potential (E) between the reference electrode and the working electrode is measured with the voltmeter, and the overall voltage (Vs) is adjusted to maintain the desired potential at the working electrode with respect to the reference electrode. The resulting current (i) flowing to or from the working electrode is measured with the ammeter (AM). This process is usually repeated for a range of E.
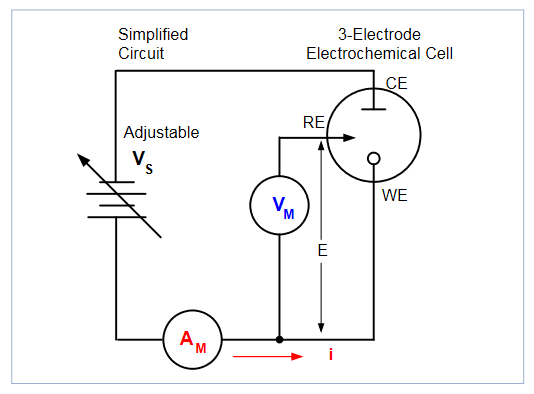
The following procedure can be used to perform a measurement for each point in the scan, E(i):
- Select a potential (E) for RE with respect to WE.
- Adjust the voltage across the entire cell (CE to WE) to get desired E (closed loop control).
- Measure i.
- Select (step) a new E and repeat procedure until the scan is finished. The procedure can be a single sweep between two potentials.If this is the case, this is called linear sweep voltammetry.The procedure may also be configured that when a certain potential is reached, the sweep is inverted. This is called cyclic voltammetry. This cycle may be repeated multiple times during an experiment.
- Plot the results and derive parameters of interest from the data.
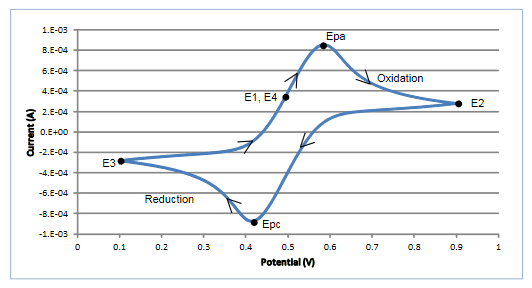
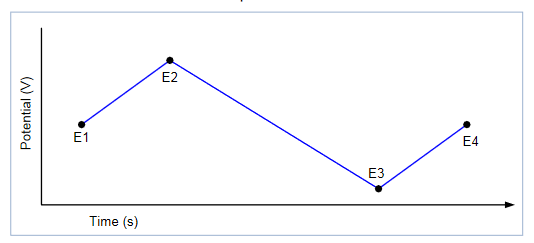
Once the experiment is complete, the measured current is plotted as a function of the potential in a graph known as a voltammogram. The example voltammogram in Figure 3 shows four voltage vertices: E1 (initial potential), E2 (second,switching potential), E3 (third, switching potential), and E4 (final potential). The voltage peaks in the waveform are the anodic (Epa) and the cathodic (Epc) peak potentials. In this example,the scan begins at E1 and the potential becomes increasing more positive causing the anodic current to rise rapidly and peak at the anodic peak potential (Epa). At E2, the scan direction switches to negative for the reverse scan. As the current becomes more negative, cathodic current will flow as the electrode process is reduced. A cathodic peak potential occurs at Epc. At the third potential, E3, the direction is reversed again and the voltage is swept until it reaches E4. From the potential sweep, important information about the experiment can be derived and analyzed.
Using the 2450-EC or 2460-EC Systems to Perform Cyclic Voltammetry
Follow these steps to perform cyclic voltammetry testing using the 2450-EC or 2460-EC Systems and the CyclicVoltammetry test script.
Make Connections from the 4-Terminal SourceMeter to the 3-Electrode Cell
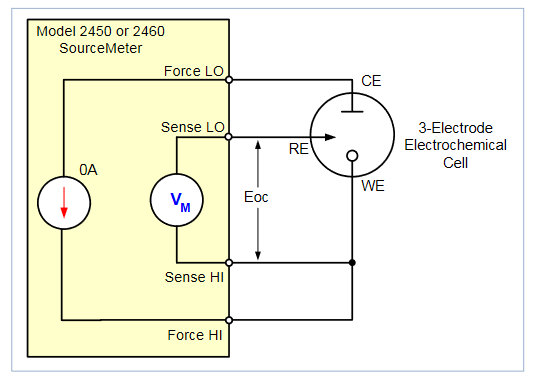
To perform cyclic voltammetry the instrument is set up to force voltage and measure current in a 4-wire (remote sense) configuration. The four terminals of the instrument are connected to the 3-electrode electrochemical cell, as shown in Figure 4.
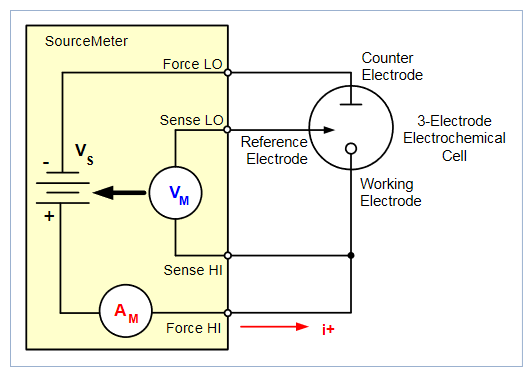
The Force HI and Sense HI terminals are connected to the working electrode. At this terminal, the voltage is forced and the current is measured from the working electrode to the counter electrode. The Sense LO terminal is connected to the reference electrode. The Force LO terminal is connected to the counter electrode. The instrument measures the voltage difference between the working and reference electrodes (between the Sense HI and Sense LO terminals) and ensures the voltage is kept constant.
When the instrument is programmed to source voltage in the remote sense configuration, internal sensing provides a feedback voltage that is measured and compared to the programmed voltage level. If the feedback voltage is less than the programmed voltage level, then the voltage source is increased until the feedback voltage equals the programmed voltage level. Remote sensing compensates for the voltage drop in the test leads and analyte, ensuring that the programmed voltage level is delivered to the working electrode.
Download and Run the Test Script
Once the connections from the instrument to the cell are made, the test script can be executed. The cyclic voltammetry test script was created using TSP® (Test Script Processing) code. TSP technology can embed complete test programs inside the instrument. Each instrument has an embedded test script processor, which allows executing test programs (scripts), without the use of an external computer. Any editor,such as Notepad or Keithley's Test Script Builder software,can be used to edit a script.
The CyclicVoltammetry script has been preloaded into the instrument. The test script is executed by pressing the Active Script Indicator at the top of the instrument's home screen,then touching the CyclicVoltammetry test script, as shown in Figure 5.
Execute the Test Script
Once the test script begins to execute, the user must respond to prompts on the instrument's touchscreen to define the parameters of the test.
Acquire the Open Circuit Potential: During execution, the measured open circuit potential (Eoc) is displayed and the user must respond if the value is acceptable. The open circuit potential of the electrochemical cell is measured while the instrument is in the voltmeter mode. When the open circuit potential is measured, the current source is set to output 0A.
This high impedance voltage measurement is made using the instrument in a 4-wire configuration as shown in Figure 6. It's unnecessary to change any test leads manually.
This Eoc potential measurement can be used as the reference measurement when defining a voltage vertex. If this is the case, then the Eoc measurement gets added to that vertex.
Define the Voltage Vertices: After the open circuit voltage is measured, the voltages of the potential sweep must be defined, which includes the number of vertices, the voltage magnitude, and the reference voltage. The user can select up to four voltage vertices, which are defined as E1 (or E initial),E2, E3, and E4; these vertices are shown in the potential vs.time plot in Figure 7. The slope of the lines provides the scan rate that is used in the sweep.
The voltage magnitude in the range of ±5.0000V must be specified for each vertex potential. The user must also choose if the applied potential at each vertex is vs. the reference potential (Eref) or the open circuit potential (Eoc).
Select the Scan Rate: Next, the scan rate is specified from a range of 1.0mV/s to 3500 mV/s. The scan rate defines the rate at which the potential will be linearly swept during the experiment.
The instrument does not output a truly linear voltage; instead,it outputs very small digitized steps from 0.1mV to 10mV, depending upon the scan rate. These voltage step sizes are used during scanning based on the user-set scan rate:
- 100µV Step Size: 1.0mV/s < scan rate < 35mV/s
- 1mV Step Size: 35mV/s < scan rate < 350mV/s
- 10mV Step Size: 350mV/s < scan rate < 3500mV/s
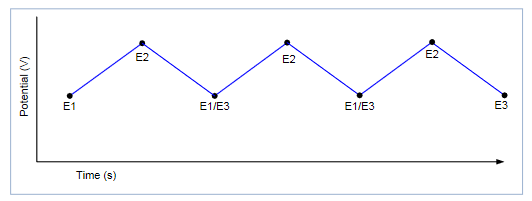
Select the Number of Cycles: The number of cycles selected (from 1 to 100) determines how many times each scan will be repeated. Figure 8 shows an example of a potential vs. time graph showing three cycles of a three-vertex voltage scan.
Choose a Current Measurement Range: During the scan,the current is measured on a user-specified range. The selectable current ranges will vary depending on whether the 2450-EC or 2460-EC System is being used. The current ranges for the 2450-EC are the 10µA, 100µA, 1mA, 10mA, 100mA, and 1A ranges. The current ranges for the 2460-EC are the 1mA,10mA, 100mA, 1A, 4A, 5A, and 7A ranges.
Acquire Readings by Sampling Interval Units: During the scan, many small voltage steps are output and the resulting current is measured. To limit the number of points (current,voltage, and time readings) returned to the internal buffer, the user can define how often to store readings into the default buffer by specifying one of the four Sampling Interval Units.Table 1 describes each of the Sampling Interval Units along with a range of values.
| Sampling Interval Unit | Description | Range of Values |
| pts/test | The total number of points acquired during a test regardless of how many cycles | 10 to 10,000 |
| pts/cycle | The total number of points acquired in each cycle | 10 to 10,000 |
| sec/pts | The number of seconds per each point | 0.01 to 100 |
| pts/sec | The total number of points taken per second | 0.01 to 100 |
Table 1. Sampling Interval Units.
Generate the Scan and View the Graph in Real Time: Once all the inputs have been defined, the experiment begins. The generation of the voltammogram can be viewed in real time on the Graph screen. The graphs are plotted using the IUPAC (International Union of Pure and Applied Chemistry) convention,in which potentials become more positive along the x-axis.Anodic current is shown as positive on the y-axis, and the cathodic current is shown as negative on the y-axis.
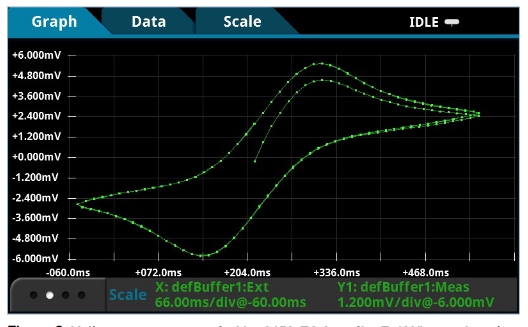
The voltammogram generated by the instrument shown in Figure 9 is a result of the following reversible chemical reaction of potassium ferricyanide K3[Fe(CN)6]:
(oxidation) FeII(CN)64- → FeIII(CN)63- + e-
(reduction) FeIII(CN)63- + e- → FeII(CN)64-
In this example, four voltage vertices and a scan rate of 25mV/s were used to generate this voltammogram, which contains data from three cycles.
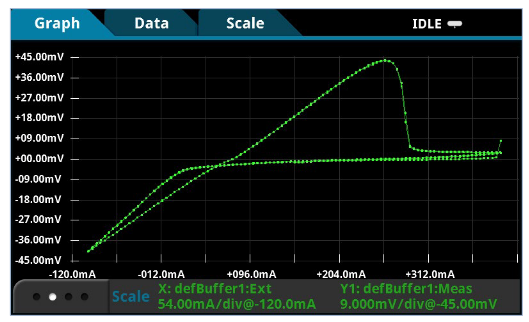
Another example experiment was performed on copper sulfate using the CyclicVoltammetry test script. In this example,cyclic voltammetry was used to plate copper on a graphite working electrode and then strip it back again. This chemical reaction was:
(reduction) Cu2+ + 2e- → Cu (metallic)
(oxidation) Cu → Cu2+ + 2e–
In this test, three voltage vertices were configured so the voltage was swept from 0.4V → -0.1V → 0.4V using a scan rate of 25mV/s. The Sampling Interval Unit was set to 5 points/s.Three cycles of the scan were performed and the results of this experiment are shown in Figure 10.
Analog Integration Current Method
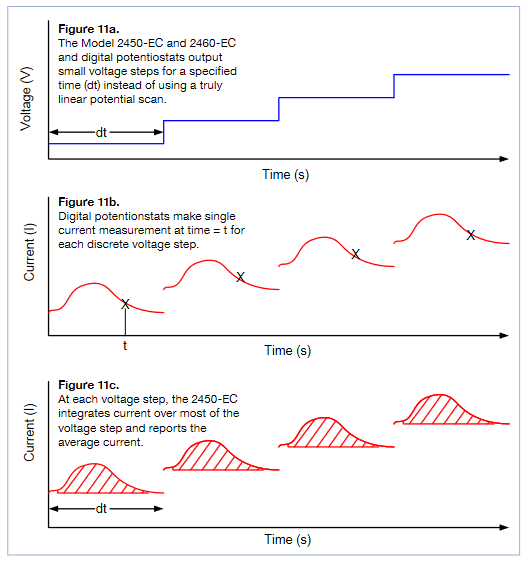
The 2450-EC and 2460-EC SourceMeters as well as other digital potentiostats generate a potential scan using very small discrete voltage steps (see Figure 11a). For the 2450-EC and 2460-EC, the voltage step size depends on the scan rate and can vary from 100µV to 10mV. To measure the resulting current at each step, many digital potentiostats make a measurement at a fixed point during the voltage step which may not be necessarily at the same time for each step (see Figure 11b).Conversely, the 2450-EC and 2460-EC instruments use an internal analog integrator to integrate current over most of the voltage step and report the average current over the aperture time (dt) of the voltage step (see Figure 11c). This average current is used in the generation of the voltammogram.
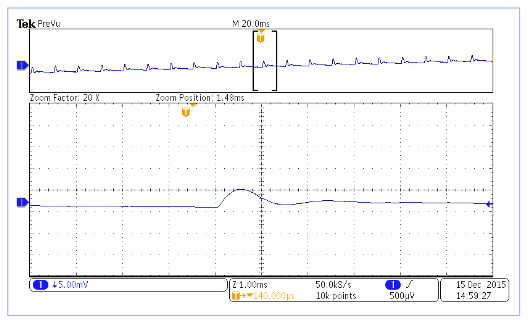
As an example, Figure 12 below shows an image of the current measured on a cyclic voltammogram of potassium ferrocyanide using potassium nitrate as a supporting electrolyte. For this experiment, each 1mV step in voltage occurs every 24ms, and in the expanded view you can clearly see the effect that these steps have on the measured current. Since the 2450-EC and 2460-EC integrate over the majority of the period between the voltage steps, all of the charge transferred (including the charge from the step shown) is used in the generation of the voltammogram.
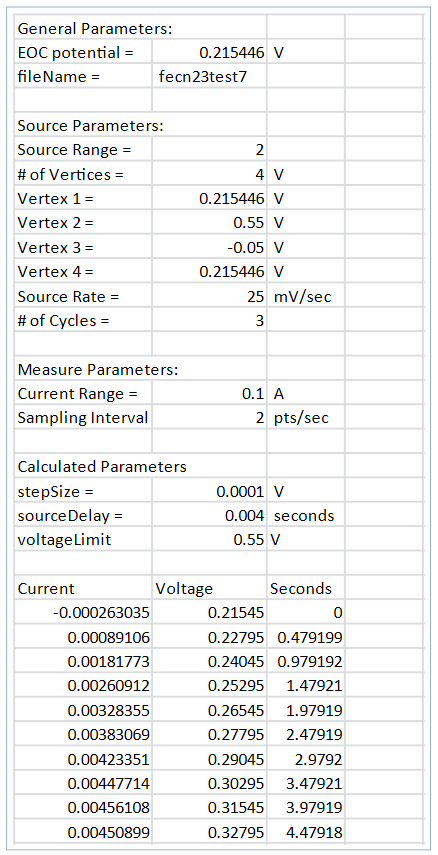
View the Results in the Data in the .CSV File: If the data is saved to the USB drive, the readings can be viewed by opening the file in a spreadsheet on a computer. Figure 13 illustrates an example of how the data appears. In addition to the current, voltage, and time, general parameters about the test are included in the file.
Conclusion
The 2450-EC and 2460-EC Electrochemistry Lab Systems are ideal tools for performing common electrochemistry tests. These systems include test scripts for performing cyclic voltammetry, open circuit potential measurements, potential pulse and square wave with current measurements, current pulse and square wave with potential measurements, chronoamperometry, and chronopotentiometry. These systems execute the tests without the use of a computer. An electrochemistry translation cable is also included to make easy connections between the instrument and an electrochemical cell.
Cyclic Voltammetry Test Settable Values:
- Potential Range: ±5V
- Voltage Step Size During Ramping:
- – 100µV (1.0mV/s < scan rate < 35mV/s )
- – 1mV (35mV/s < scan rate < 350mV/s )
- – 10mV (350mV/s < scan rate < 3500mV/s
- Scan Rate: 0.1mV/s to 3500mV/s
- Current Measurement Range (full scale):
- – 2450-EC: 100µA, 1mA, 10mA, 100mA, 1A
- – 2460-EC: 1mA, 10mA, 100mA, 1A, 4A, 5A, 7A
- Number of Cycles: 1 to 100
- User Selectable Sampling Interval Units: Points/Test, Points/Cycle, Seconds/Point, Points/Second
- Maximum Number of Points: up to 100,000 readings
Find more valuable resources at TEK.COM
Copyright © Tektronix. All rights reserved. Tektronix products are covered by U.S. and foreign patents, issued and pending. Information in this publication supersedes that in all previously published material. Specification and price change privileges reserved. TEKTRONIX and TEK are registered trademarks of Tektronix, Inc. All other trade names referenced are the service marks, trademarks or registered trademarks of their respective companies.
011216 1KW-60116-0