The latest generation of affordable oscilloscopes, including the Tektronix TBS1000B and TBS1000B-EDU series, offer built-in Fast Fourier Transform (FFT) spectral analysis features. This capability gives users a powerful, integrated tool that provides a different perspective for troubleshooting and verification work.
Electronic signals can be viewed in both time and frequency domains. Each view provides unique details about the events that make up the signal. Oscilloscopes users are quite familiar with using the time domain view, however the frequency domain can often be a mystery.
The FFT function produces a frequency-domain measurement, known as a spectral view. In this view, the vertical axis displays amplitude (sometimes known as magnitude, or phase) while the horizontal axis displays frequency. The resulting spectral view shown below reveals events and trends unseen in the time domain. The FFT can speed troubleshooting by making certain types of signal errors obvious to the eye.

Frequency-domain view of the square wave signal
Let’s look at how the FFT function helps in electronic troubleshooting. The time-domain waveform below is a 20 MHz clock signal from a processor board. With this view, it would be easy to overlook the small differences in the peaks of each waveform cycle. The slightly irregular wave shape implies that something is modulating the main clock signal at a subharmonic frequency. What is the frequency, and what is the extent of its presence in the clock signal?

Time-domain view of 20 MHz clock signal
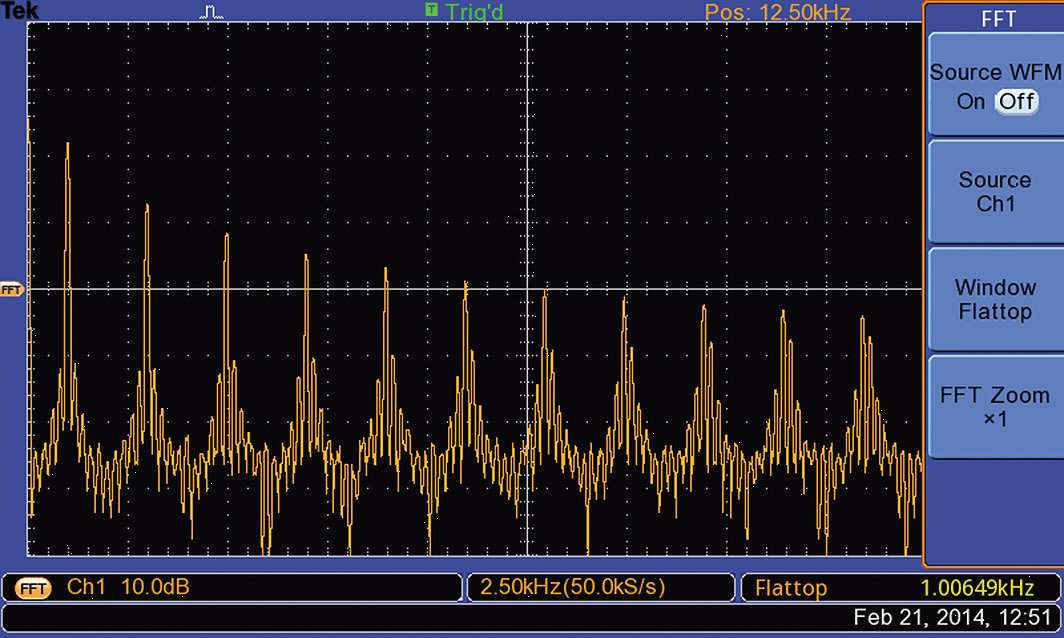
Switching the oscilloscope to FFT mode provides immediate answers to these questions. The image below shows the FFT view of the same 20 MHz clock waveform shown above.

Frequency-domain view of the 20 MHz clock signal
The frequency range of the FFT display is set to 25 MHz, which means that each horizontal division equates to 2.5 MHz. The left side of the graticule is 0 MHz. The tallest peak represents the fundamental frequency of the clock signal. But something is going on between 0 MHz and the 20 MHz fundamental. There is a peak at about 10 MHz that is almost half the height of the fundamental. The presence of this subharmonic peak confirms that an unwanted 10 MHz signal is indeed modulating the clock. The FFT has verified that there is crosstalk, and has pinpointed the offending frequency. For the troubleshooter, this is the clue that expedites the search for the modulating signal and how it is coupling into the clock line.
The TBS1000B and TBS1000B-EDU series’ FFT analysis features support a wealth of other applications:
- Automotive: suspension and frame design—determine mechanical resonances and stresses
- Aviation: design of wings and control surfaces—locate and correct stress points; reduce vibration; identify mechanical noise sources
- Vibration analysis: design and proof-testing of mechanical systems— detect and eliminate resonances; verify theoretical models; confirm measurements made with other tools
- Environmental: noise reduction—characterize noise levels and frequencies in hospitals, factories, and other work environments; minimize noise due to fans and HVAC systems
- Physiological: health research—measure cardiopulmonary and neurological signal characteristics
- Electronic design: power supply design—measure harmonics and nonlinearities on power supply outputs; detect and quantify oscillations; characterize distortion and harmonics in DC-to-DC converters