
Power supplies and voltage regulators are typically designed to maintain a constant voltage over a particular current range. The supply should respond quickly to demand changes while maintaining a constant output, without excessive ringing or oscillation. To do this, power supplies are essentially amplifiers with a closed feedback loop. Control loop measurements help to measure how a power supply responds to changes in output load conditions, temperature changes or other changes.
Frequency response analysis may be performed using dedicated equipment, but newer oscilloscopes may also be used to measure the control loop response. Measurements can be made quickly and presented as familiar Bode plots using an oscilloscope, a signal source, and the appropriate automation software. For more details, check out the full-length application note, Measuring the Control Loop Response of a Power Supply Using an Oscilloscope.
Oscilloscope measurements
Performing a control loop response measurement using an oscilloscope requires you to inject a stimulus into the feedback path of the control loop, over a range of different frequencies. The oscilloscope allows you to measure the actual gain and phase of the circuit, giving you a better idea of the stability of the design than you would get by relying on simulation alone.
Advanced Power Measurement and Analysis Software
The control loop response of your power supply can be measured using the 4, 5, or 6 Series MSO equipped with Advanced Power Measurement and Analysis software (4/5/6-PWR). Control loop response is one of many measurements enabled by this software.
To determine the control loop measurements, the software performs the following functions:
- Controls the function generator
- Calculates and plots gain based on two voltage inputs
- Calculates and plots phase shift between Vin and Vout based on the two voltage inputs
-
Calculates gain margin and phase margin
Test setup for control loop response measurements
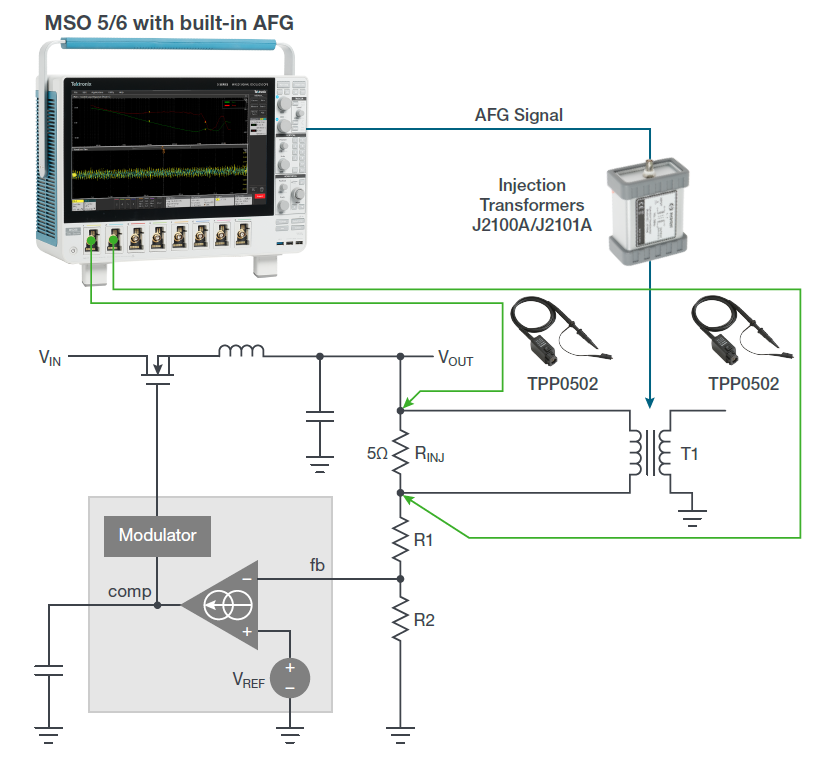
To gather the data for the Bode plot, two probes must be applied across a low-value injection resistor. The oscilloscope measures the stimulus and response amplitudes to calculate gain and also measures phase delay between stimulus and response.
The setup to measure the frequency response of the power supply control loop consists of these elements:
- To measure the response of a power system, a known signal must be injected into the feedback loop. The 4, 5 and 6 Series MSOs offer built-in signal sources that can be used to inject such a signal into the feedback of the control loop through a transformer. An AWG31000 external function generator may also be used.
- An injection transformer with a flat response over a wide bandwidth is connected across the injection resistor, isolating the grounded signal source from the power supply. The choice of transformer depends on the frequency range of the control loop response. For example, the Picotest J2101A Injection Transformer has a range of 10 Hz–45 MHz which aligns well with the function generator option for the 4/5/6 Series MSOs.
- For voltage measurements, passive probes with low capacitance and low attenuation, like the TPP0502, are recommended. This is because low probe attenuation enables good sensitivity, and low capacitance minimizes probe loading effects.
Measuring frequency response
Once the load is properly connected and the system is set up, the stimulus sweep must be configured through the oscilloscope's setup menu. This process is straightforward, but there are a few ways to customize the sweep and measurements.
Control loop analysis on the 4, 5, or 6 Series MSO can take advantage of the Spectrum View feature, which uses digital downconverters built into each channel of the oscilloscopes. This method provides fine control over frequency resolution. A traditional FFT method is still available as an alternative, so you can use that if you're more comfortable with it.
An Auto RBW setting can be used to tell the instrument to automatically adjust key parameters such as Resolution Bandwidth, Center Frequency, and Span dynamically throughout the sweep for stable and repeatable results.
The 4/5/6-PWR software also supports constant amplitude and profile amplitude sweeps. Profile sweeps let you specify different amplitudes for different frequency bands, allowing you to optimize Signal to Noise Ratio (SNR) for better results.
Interpreting the results
-
Pressing the front panel Run button starts the test. The measurement begins and the phase and gain curves are plotted on the display. The resulting Bode plots show:
- Frequency, plotted on a logarithmic scale on the x-axis
- Gain (green trace), on the y-axis, with the scale on the left, given in dB
- Phase between stimulus and response (red trace), on the y-axis, with the scale on the right, plotted on a linear scale and given in degrees
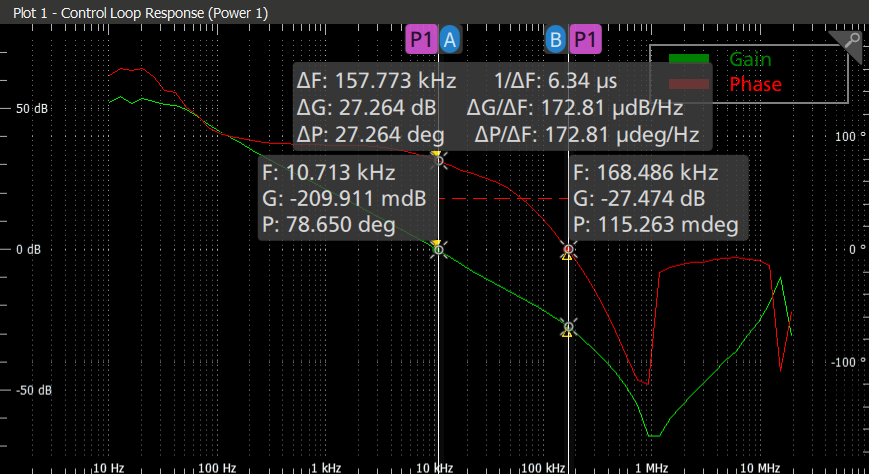
Cursors may be used on the plots to indicate gain and phase at specific frequencies. The difference between the two cursors is also displayed on the screen.
Analyzing the stability of a control loop within a power supply doesn’t require specialized instruments. By adding power analysis software, a function generator, an isolation transformer and the right probes, Bode plots can be built using versatile, familiar oscilloscopes. To learn more, download the application note: Measuring the Control Loop Response of a Power Supply Using an Oscilloscope.