
When you are working with 3-phase systems, having phasor diagrams available on your oscilloscope can save time during setup and provide faster insight into your system.
In general, alternating voltages or currents are represented graphically as voltage or current versus time waveforms. This is the traditional oscilloscope view.
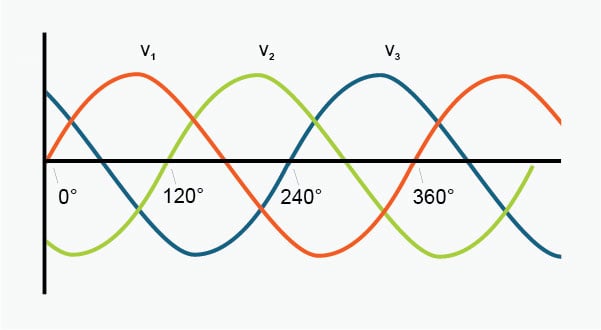
A three-phase system consists of three sinusoidal AC voltages and currents of identical frequency. Having 6 or more waveforms plotted on the same axis makes a very busy graph. It can be difficult to discern important information regarding magnitudes and phase angles. Electrical engineers realized this early on and adopted an easier way.

Phasor diagrams represent the magnitude and directional relationship between two or more vectors. For its ability to efficiently communicate magnitude and phase information, the phasor diagram is popular and widely used in 3-phase power system analysis.
Having phasor diagrams available on your oscilloscope provides two key advantages:
1. It provides a quick way to check your setup
2. It quickly shows the nature of the loads in your system
1. Check your Setup
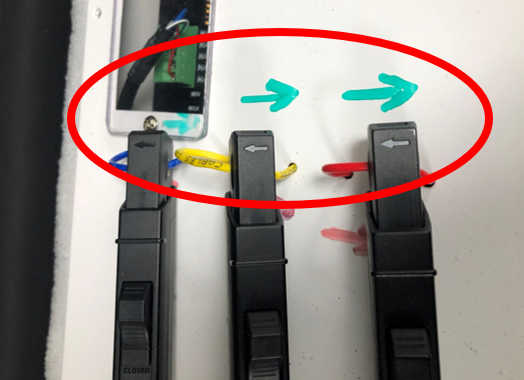
Phasor diagrams provide a quick way to make sure your probes are oriented correctly. Setting up measurements on 3-phase systems can be challenging. Three or more voltage probes must be connected with the proper polarity. Three or more current probes must also be connected and oriented with the arrows towards the load. The challenge is in determining the proper polarity, not with the current probes themselves. Clamp-on current probes are easy to operate. Just place the conductor in the jaw and completely close the jaw. The wire need not be centered in the opening, and it’s fine if it passes through at an angle.
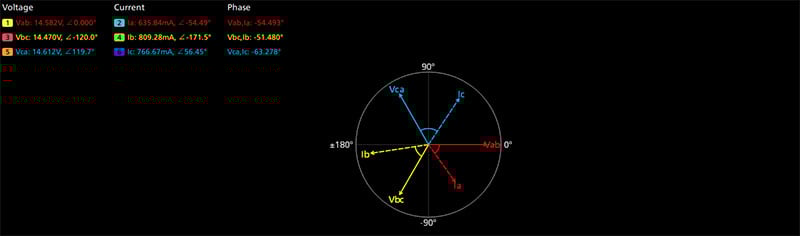
Motor loads are inductive, so on the phasor diagram the voltage vector should lead the current vector. If the phasor diagram displays a leading current vector, then it’s a good idea to check the connections of the test setup. This is usually caused by a reversed current clamp.
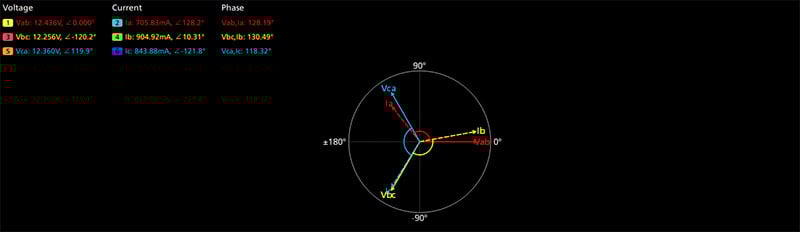
Current probes connected in the reverse direction. Note the current vectors leading the corresponding voltage vectors
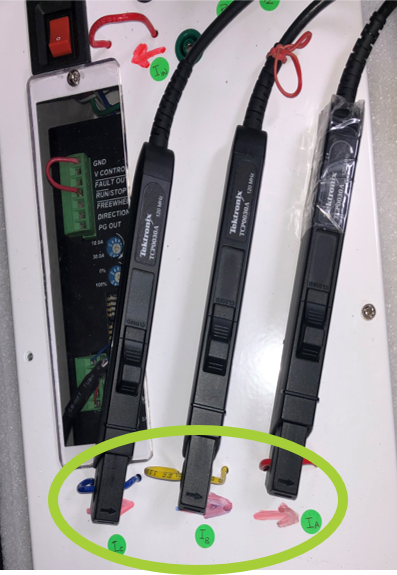
By reversing the direction of the current probes, the connection issue is fixed. Note the current vectors now lagging the corresponding voltage vectors indicating the correct orientation of the current probes.
2. Understand Your Loads
In a balanced 3-phase system, each of the three voltage vectors are nominally 120 degrees apart from each other. In a balanced system, with identical loads on each phase, the current vectors will also be 120 degrees apart from each other. In this balanced system the sum of the line currents is zero at any instant, and the sum of the line-to-line voltages is also zero.
But practical systems don’t behave as textbook systems. Differences in load impedances among the three phases will result in imbalances. These may show up as different lengths in vectors and different angles between voltage and current vectors.
The phasor diagram is ideal for seeing the effects of inductive or capacitive loads. For pure resistive loads, voltage and current would be in phase, meaning there is no lag between voltage and current. However, since motors are inductive in nature, the current vector will always lag the corresponding voltage vector. For a good motor drive design, this phase angle is kept at the minimum between voltage and current phasors.
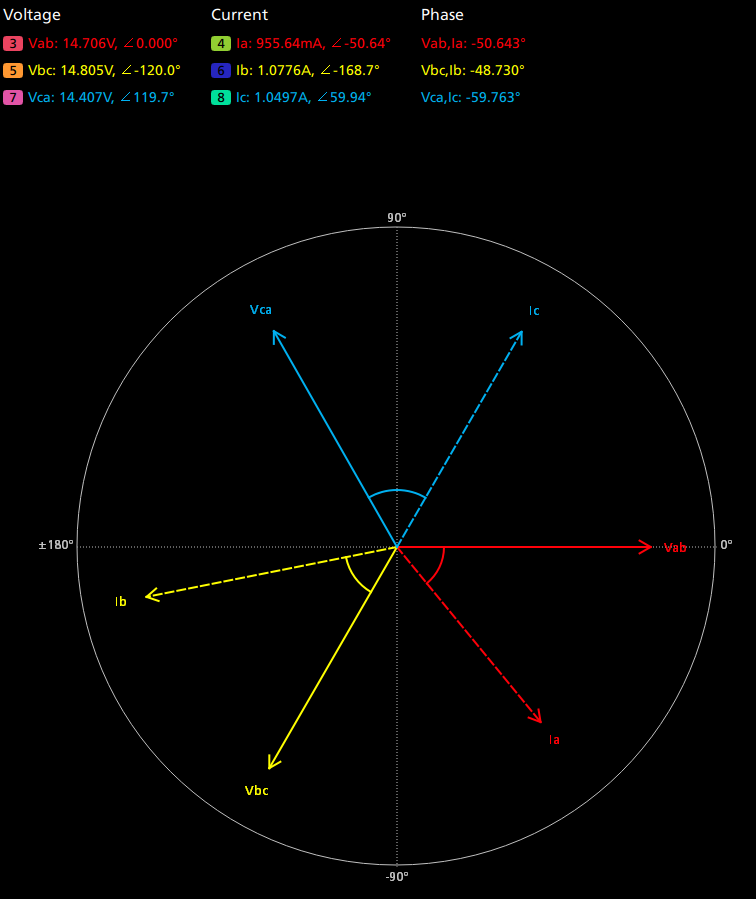
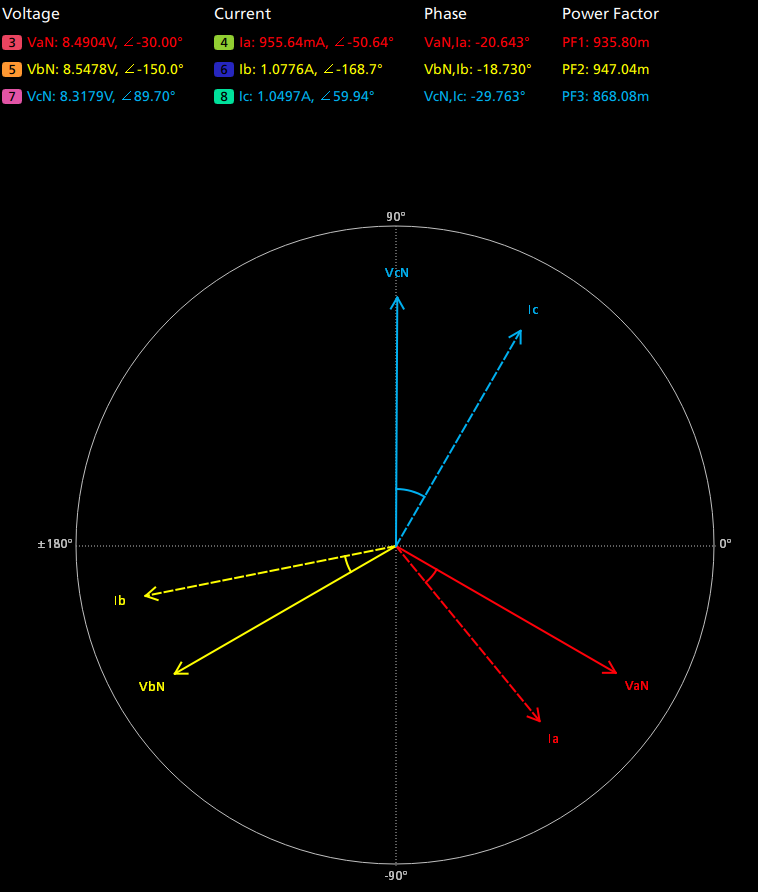
A Typical Phasor Diagram in a Line-Line (Left/ Top) and its corresponding Line-Neutral (Right/ Bottom) configuration. On the left image, notice the angles between voltage vectors in the top left corner (0 degrees, -120 degrees and -119.7 degrees) indicating a nearly balanced load. The current vectors are lagging the corresponding voltage vectors indicating the setup connections are accurate. The Line-Neutral configuration is derived mathematically from the Line-Line configuration, without involving physical connection changes.
Conclusion
Phasor diagrams are great visual tools that help you understand three-phase systems. They provide good overall insight into your designs and quickly show the effects of design changes.
Tektronix Inverter Motor Drive Analysis Solution (5-IMDA) offers unique oscilloscope-based phasor diagrams to quickly analyse your 3-phase designs. Here is the link for more details.