An Essential Tool
One of the key tools used by telecom/datacom original equipment manufacturers, system installers and systemservicers to view eye patterns on an oscilloscope and test the quality of a laser’s time-domain signal is the reference receiver (RR). It has become an essential tool in the testing of laser transmitters.
In today’s communications arena, laser transmitters are primarily used to send high-speed telecom and datacom signals such as 10 Gigabit Ethernet (GbE) over fiber. As a matter of course, these laser transmitters are frequently subjected to eye-pattern mask measurements. Eye patterns, which are a composite display of many oscilloscope waveform acquisitions, are widely used for physical layer testing, the lowest layer in the Open Systems Interconnection (OSI) network model, which comprises laser transmitters. Eye pattern mask testing allows a user to quickly determine if the time-domain shape of the laser’s output signal is compliant with limits specified by international standards organizations such as the International Telecommunications Union (ITU) and International Electrical and Electronic Engineers (IEEE).
One of the key tools used by telecom/datacom original equipment manufacturers, system installers and system servicers to view eye patterns on an oscilloscope and test the quality of a laser’s time-domain signal is the reference receiver (RR). Attached between the transmitter output and the oscilloscope input, an optical RR typically acts as an optical-to-electrical converter, as well as a low-pass filter, benchmarking all transmitter testing with a consistent and repeatable setup.
optical-to-electrical converter, as well as a low-pass filter, benchmarking all transmitter testing with a consistent and repeatable setup.
An optical RR is specified for a number of reasons:
- It is the best low-pass filter available for minimizing group delay
- It makes the measurement system more closely resemble an optical receiver
- Its filtering effect reduces the consequences of overshoot and noise at frequencies outside of the normal band of operation to provide more consistent results
- It helps to make measurements conducted with similar RR test systems yield like results.
This application note will target two different types of time-domain optical sampling systems with reference receiver filtering from Tektronix, and through a series of measurement examples, show how and when they are used in 10GbE laser transmitter testing, as well as discuss the measurement results achieved. It will also demonstrate that while these reference receivers comply with ITU-T and IEEE GbE standards, they exhibit finite and dissimilar deviations from an ideal reference receiver that can ultimately lead to mask measurement discrep ancies between sampling systems. To further emphasize this measurement deviation phenomenon, the focus will be on directly modulated, instead of externally modulated, lasers since the former have characteristics that are more inclined to greater measurement deviations.
It is important to realize that eye pattern mask measurement deviations are a reality. While one test sampling solution may offer less variation and be the best reasonable alternative, there is no system currently available that will completely eradicate these measurement deviations.
Laser Transmitter Signals and Reference Receivers
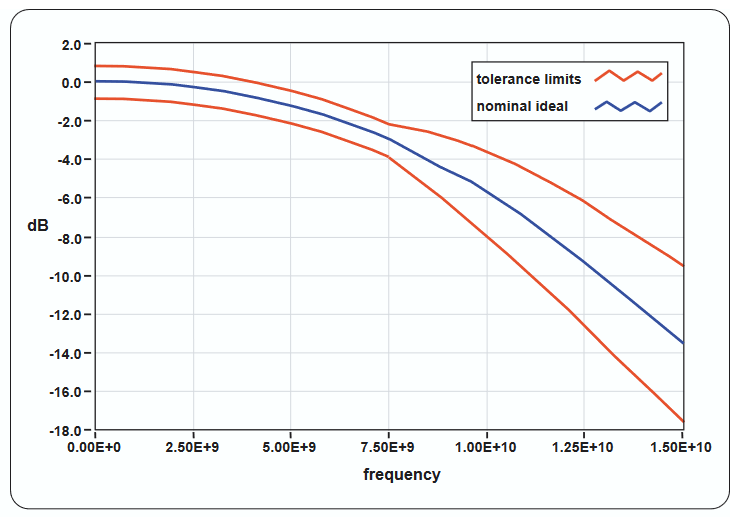
The response of a reference receiver to optical signals consists of all the elements involved in the signal path. This generally includes an optical-to-electrical converter, a passive electrical filter, an electrical sampler, and a timing-acquisition system to perform calibrated timing reference for strobing the sampler at precisely calibrated intervals. The RR is intended to provide a certain level of consistency from one reference receiver system to another when performing time-domain tests upon laser transmitters. Mask testing of the serial data signal is one test example. The degree of consistency from one RR to another is affected by the deviations an RR is allowed to have using the ideal nominal response as a base. See Figure 1. The specified limited bandwidth of the reference receiver is similar to the bandwidth for which a real network element optical receiver would more than likely be designed. For 9.953 Gb serial transmission data rate systems, this limited bandwidth would nominally be about –3 dB at approximately 0.75 times the serial data rate (approximately 7.45 GHz).
This is where directly modulated lasers enter the equation. Unlike longhaul telecom rates such as OC-192/STM-64 10 Gbps, which predominantly use the external modulation capability of a static DC-biased laser signal (also known as Constant Wave or CW biasing) with an interferometric Mach-Zehnder modulator, the slower data rates of short-distance data communications generally resort to direct modulation of the lasers in the transmitters. Low cost and compact size are the main attributes of directly modulated lasers; they are rather inexpensive to implement because they require few additional components such as external modulators and bulky coaxial interconnects. For purposes of this application note, the focus will be on directly modulated lasers.
10 Gb Reference Receivers
A reference receiver has been described as a "golden" receiver that’s used to benchmark all transmitter testing with a consistent and repeatable setup. The scalar frequency response of a reference receiver is generally defined by a fourth-order rolloff commonly referred to as a Bessel-Thompson curve. The shape of this curve is a very close match to an ideal Gaussian-response rolloff, and corresponds closely with a time-domain response that is critically damped and has no overshoot or undershoot. Because the optical reference receiver’s Gaussian-like response is so smooth, any aberrations observed on a quality oscilloscope will be from the transmitter-under-test, and not from the RR used to capture the signal itself
While the RR bandwidth is near Gaussian in shape, it is intentionally specified at a relatively low frequency in relation to the bit rate of the transmission signal under test. For a 10.000 Gbps signal, this would translate into a –3 dB rolloff at 7.5 GHz. As mentioned previously, this limited bandwidth is similar to the bandwidth needed by optical receivers in a true network to convert the incoming optical signal to an electrical signal. Elaborating further, the total bandwidth of an oscilloscope system using a reference receiver in the signal path will therefore show waveforms with a similar bandwidth that would be experienced by real network receivers. The result is that aberrations at much higher frequencies are suppressed from being displayed on the oscilloscope because they would not be a concern in an actual network.
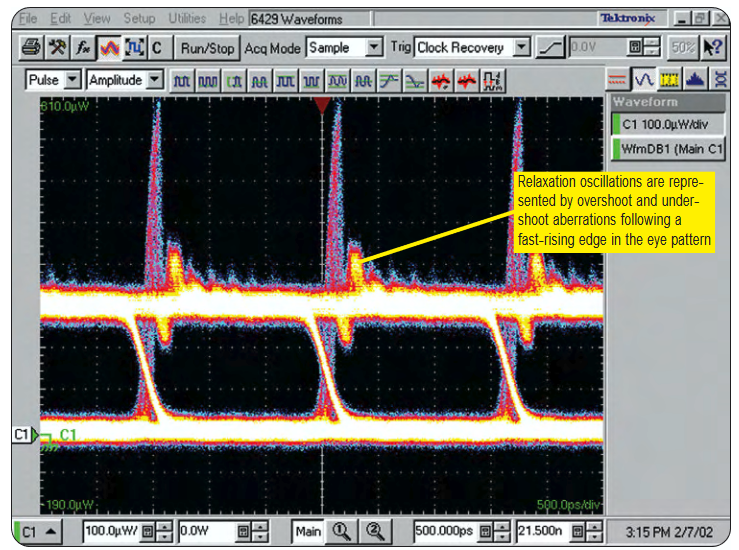
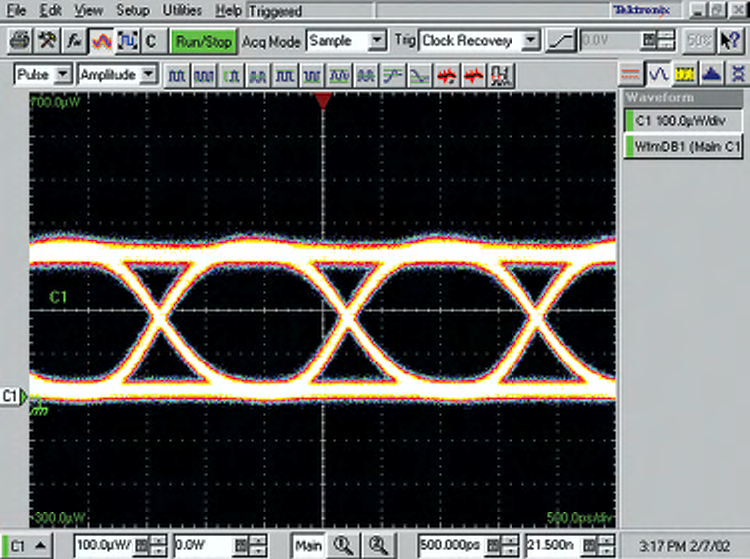
Figure 2 shows two eye patterns of a typical directly modulated 622-Mb laser transmitter. This lower bit-rate example is a good historical illustration of relaxation oscillations in directly modulated lasers and the previous typical difference between the frequency of these oscillations versus the serial bit rate of the data stream. The top screen is from an optical sampling oscilloscope using a high bandwidth (>20 GHz) sampler, while the bottom screen displays the same signal with a 622 Mbps reference receiver. The high overshoot and subsequent ringing evident in the top screen is largely due to the relaxation oscillation of the laser, which is at a fairly high frequency – 5 GHz compared to the bit rate of the data at 622 Mbps. When the reference receiver is used (right), the nominal bandwidth of the system is intentionally reduced to approximately 466 MHz (0.75 * 622 Mbps). The high-frequency relaxation oscillation has been effectively and entirely masked by the reference receiver’s limited bandwidth.
Amplified and Nonamplified RRs
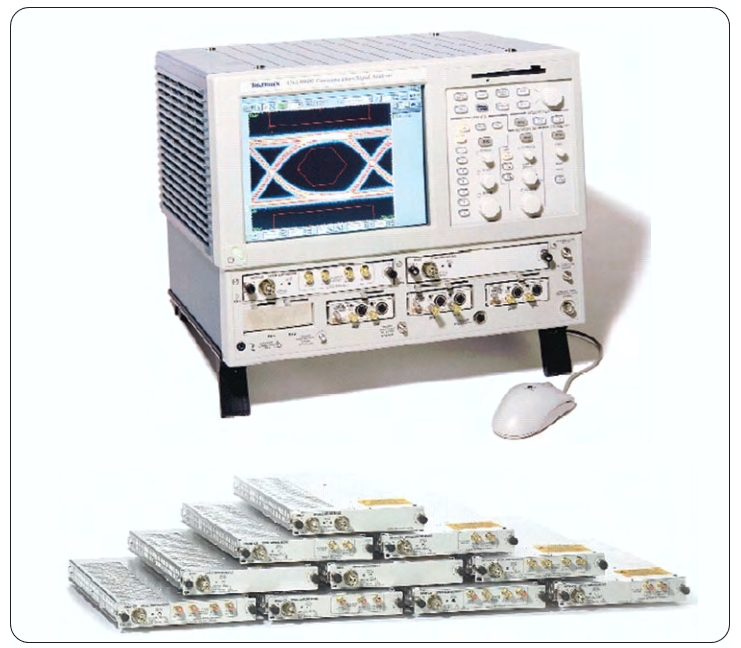
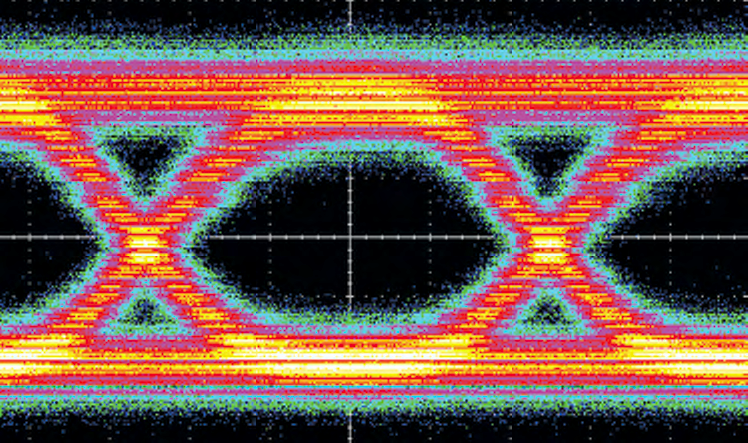
Tektronix offers several optical sampling modules that enable its modular TDS/CSA8000 series oscilloscopes (see Figure 3) to be user-selectable as reference receivers for various 10 Gbps rates. The 80C02 (80C04, 80C09, and 80C11 optical sampling modules) are all high-performance telecom modules with essentially the same performance characteristics with regard to their use as a non-return-to-zero (NRZ) 9.953 Gbps reference receiver. These modules are designed for longwavelength, single-mode fiber input only (from 1100 nm to 1600 nm). These optical samplers use fast photodetectors for converting an incoming optical signal into an electrical signal for sampling. They differ from most receivers in actual telecom and datacom transponders because they do not resort to any active elements for amplifying the electrical signal prior to being sampled. This lack of amplification between the photodetector and the 50 Ohm electrical sampler enables the photodetector’s full bandwidth to concentrate on analyzing optical signals with multiple bandwidth settings as high as 30 GHz.
Each of these modules exhibits inherent vertical noise of about 6 µW standard deviation, commonly referred to as root mean square or RMS, and approximately 35 µW to 45 µW peak-to-peak noise. While this amount of noise is generally acceptable when observing SONET/SDHtype signals that are often >0 dBm in power levels, it poses a limitation when viewing lower-power signals. A non-amplified photodetector that converts lower-level optical signals such as –16 dBm will produce much lower electrical signals that fall below the noise level of the electrical sampler itself. The result is severe eye closure when displayed on the oscilloscope, and the inability to make pass/fail eye pattern measurements.
Tektronix’s 80C08C broad wavelength multi-rate, datacom and telecom optical sampling module provides datacom rate testing for 10GbE applications at 9.953, 10.3125, 11.0957 Gbps and 10G Fibre Channel applications at 10.51875 Gbps, and telecom rate testing at 9.953, 10.664 and 10.709 Gbps. Unlike the 80C02 (and 80C04, 80C09 and 80C11) modules, the 80C08C has an OE converter with an integrated transimpedance amplifier (TIA), converting the photocurrent generated by a fast photodetector, and then feeding into an electrical sampler. This TIA is similar to the typical 10 GHz type of TIAs used in many telecom and datacom 10 Gbps optical receivers; the exceptions are its superior linearity and the fact that it’s DC-coupled – a necessity for measurements that require absolute known power levels such as the extinction ratio.
The TIA accepts the electrical current generated by the photodetector and converts it into electrical voltage with much higher gain than the standard non-amplified optical samplers. The photodetector and TIA must be grouped together in a hybrid package with very small dimensions between the two components to minimize parasitics such as inductance between them. Because the TIA has limited bandwidth, the photodetector’s higher bandwidth is masked from the electrical sampler. Although the 80C08C can’t make high bandwidth measurements such as 30 GHz, its bandwidth is sufficient for providing the filtered 10 Gbps reference receiver performance.
The photodetector/TIA combination yields much higher signals for the 80C08C’s electrical sampler, resulting in greater signal-to-noise ratio, and the ability to view much lower optical signals on the oscilloscope. Even at modest 10 Gbps signal levels such as –7 dBm, the excellent signalto-noise performance and high optical sensitivity of the 80C08C will result in a more open eye pattern, thereby yielding better margins when performing compliance mask testing on 10 Gbps signals. In essence, the typical 1.6 µW RMS noise of the 80C08C allows reliable measurements of lower-power eye patterns with –13 dBm generally being easily achieved. Figure 4 clearly depicts what effect amplification and the lack of it can have on a signal’s eye patterns.
Frequency Content in 10 Gbps Data Streams and Low Frequency Deviations
10 Gbps data streams can contain a variety of energy contents depending on the combinations of the consecutive digital "ones" and "zeros" that constitute these streams. A simple example of a 10 Gbps data sequence would be a continuous series of alternating bits of ones (HIGH) and zeros (LOW) that has an infinite repeating pattern of 10101010.... With the bit period for a 10 Gbps data stream being 100 ps, the simple "10101010" sequence approximately resembles a squarewave signal with a period of 200 ps, which is similar to a 5 GHz squarewave. In actual 10 Gbps transmitters, the finite risetime of the laser combined with the finite risetime of the 10 Gbps reference receiver (about 45 ps) would cause this squarewave to have substantially rounded corners at the rising and falling boundaries. The fundamental sinusoidal frequency of the simple pattern would be 5 GHz. A similar example is a repeating bit sequence, which has two consecutive ones followed by two consecutive zeros. This sequence is also similar to a squarewave pattern, but with a fundamental sinusoidal frequency content of 2.5 GHz.
Actual data streams are generally not like these two patterns, but rather are comprised of random bit sequences. For testing purposes, a simple pseudo-random bit sequence (PRBS) is used in many tests of 10-Gbps transponders to simulate the random nature of a real data stream. A simple 127-bit sequence, which contains all the possible combinations of 7-bit sequences, would be called a PRBS7 (often defined as PRBS 27–1). PRBS test patterns will contain a number of transitions of consecutive ones and zeros that briefly resemble the simple 101010… or 11001100… examples discussed above. They will also have some sections of their bit sequence in which there are many alternating ones and zeros in consecutive order. In a PRBS7 pattern, for instance, only once in every 127 bits will there occur a sequence that looks like …000000111111… (Figure 5 illustrates an example of a PRBS7 bit sequence)
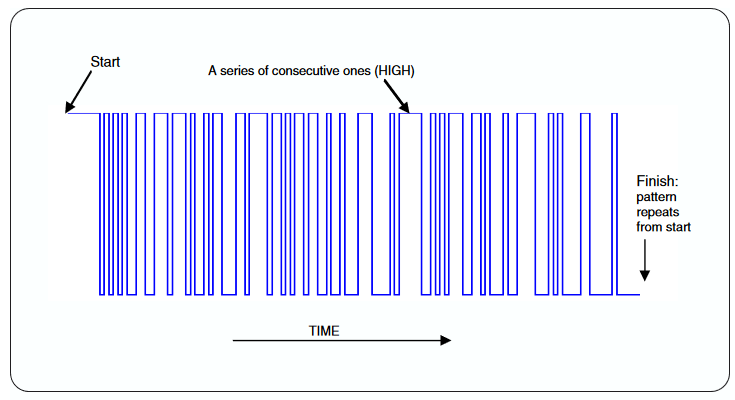
Long "flat spots" in a data sequence having many consecutive ones or zeros in a row will contain some lower frequency content, while the common bit-to-bit transitions from a one to zero and vice versa (a …010… or perhaps a …101… sequence) will contain some of the higher prevalent 5 GHz energy content. A statistical analysis of any PRBS data sequence would reveal that a single consecutive one or zero is the most common occurrence, followed by two ones and two zeros in a row as the next most common. The frequency with which longer and longer "flat spots" occur in the PRBS pattern will continue to decline up to the longest-duration "flat spot," which will occur only once for every complete PRBS bit sequence before it begins to repeat. Weighing all the possible combinations of consecutive bit sequences in a PRBS pattern shows that statistically, the average length of "flat spots" in the data sequence is two bit periods, or 200 ps. The average of two consecutive bits for ones (HIGH) and two for zeros (LOW) has a fundamental frequency of 2.5 GHz.
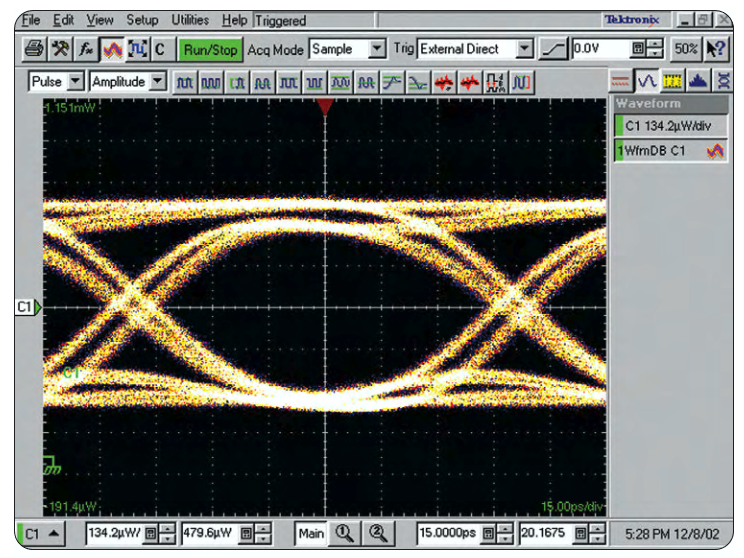
In one example, the 80C02 and 80C08C sampling modules were used to capture the time domain optical signal from a 1310-nm 10GbE transmitter, whose laser was modulated with a serial PRBS 27–1 digital pattern. The oscilloscope sampling system was triggered synchronously with the start of the pattern, allowing the signal to be averaged to obtain a direct comparison between the samplers using the same portion of the data pattern rather than an eye pattern. (Eye patterns result when an equivalent time sampling system is triggered with a clock or a sub-rate clock signal that is synchronous with the data.). In Figure 6, the relative amplitude differences between the 80C02 and 80C08C have been normalized out in the concatenated plot. This particular portion of the PRBS data pattern was chosen to highlight the isolated falling and rising edges with several consecutive zeros and ones following them.
When performing mask testing, today’s oscilloscopes will generally be capable of automatically aligning the eye patterns to the masks based on several parameters including the location of the rising-falling crossings, as well as the HIGH-LOW amplitude. This ability to automatically align the eye to a mask is commonly referred to as an Autoset feature. These mask alignments rely on a statistical analysis of the samples that make up the eye pattern from the random or PRBS data. Due to the prevalence of 2.5 GHz content from the average two-consecutivebit "flat spots," the determination of HIGH and LOW is dominated more by this energy content in the signal. This, in turn, results in automatic vertical mask alignment and scaling, which is affected more by the 2.5 GHz energy content in the 10 Gbps data stream. In the 2.5 GHz region, the reference receiver frequency response rolloff +/– tolerance allows for a worst case spread difference in rolloff ranging from +0.55 dB to –1.15 dB between two different compliant 10 Gb RR instruments (refer to the Figure 1 tolerance plot). In general, the differ ence between RR samplers at 2.5 GHz is minor, and will negligibly impact any noticeable difference in the low-frequency shapes the two samplers would display when testing a 10 Gbps laser transmitter. This deviation can, however, pose a significant impact on differences in extinction ratio measurements (the ratio of HIGH to LOW in the middle of the eye). The reason for this is that the HIGH and LOW are statistically determined by examining the eye pattern, and these levels can be dominated by the reference receiver’s response at 2.5 GHz. The finite rolloff allowed for an RR in the first few hundred MHz region is also substantial (as much as –0.9 dB); this will exhibit itself just like a DC offset on the much higher-frequency 10 Gbps data stream. It should also be noted that the optical modulation amplitude (OMA), an important measurement defined by the new IEEE 802.3ae standard, is essentially the difference between the HIGH and LOW levels. The OMA measurement is often made with a similar 2-bit time constant upon a repeating pattern of 00001111; the OMA result can be affected by the same allowed deviations between various 10 Gb RR systems in the lower 2.5 GHz regions of their responses.
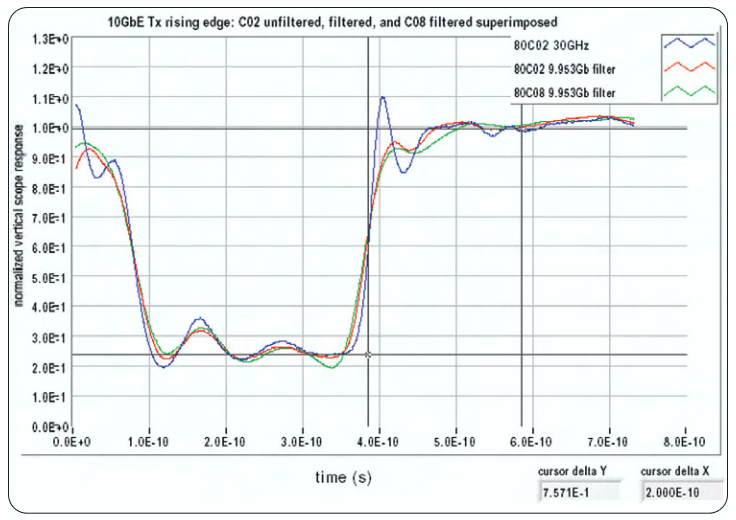
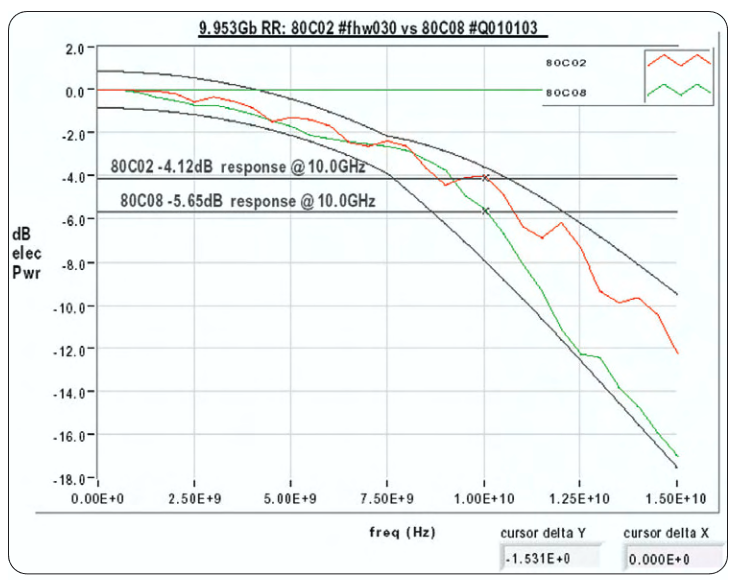
As frequencies increase beyond the 0.75 data rate, the RR’s allowable tolerance deviation also increases. Figure 7 reveals the typical difference in the vertical response between the 80C02 and 80C08C samplers at 10.0 GHz, which is approximately 1.53 dB. Here, a 10.0 GHz optical sine wave would experience 1.53 dB more attenuation of the signal’s amplitude with the 80C08C than with the 80C02. The 80C02 would attenuate a 10.0 GHZ sinewave at –4.12dB, which corresponds to a reduction to 62.2% of the true vertical peak-to-peak amplitude in the 10.0 GHz signal. Meanwhile, the 80C08C’s attenuation of –5.65 dB in the 10GHz signal would result in a reduction of the amplitude to 52.2% of the true height.
10GbE Directly Modulated and 10 Gbps Externally Modulated Lasers
As mentioned previously, 10GbE directly modulated lasers – where the signals are generated by the laser by modulating the drive current to the laser – are very cost-effective. However, these lasers do have certain drawbacks. One of these shortcomings, which can be caused by the laser’s direct modulation, is "chirp" (dynamic shifts in the optical wavelength as the laser is modulated), which can cause severe chromatic dispersion over longer distances of fiber. "Chirp," however, is not a direct concern with regard to the shape of the laser’s output waveform. Another common drawback of the laser’s direct modulation is "relaxation oscillations." These oscillations are rapid variations in light output that can occur just after a laser’s current has been modulated at fast risetimes, and which take time to settle down. Generally, some amount of relaxation oscillations will exhibit themselves as aberrations follow ing fast transitions, appearing as a resonance and/or damping in the time domain response.
The counterpart to direct modulation is external modulation where the modulator and laser are in their own separate packages and separated by fiber interconnect (some modern versions of this arrangement actually place the laser and modulator in the same hybrid package). An externally modulated laser is comprised of a stable, CW laser, which, in turn, is modulated with a Lithium-Niobate-type Mach-Zehnder modulator, the technology used in most long-haul SONET/SDH 10 Gbps transmitters.
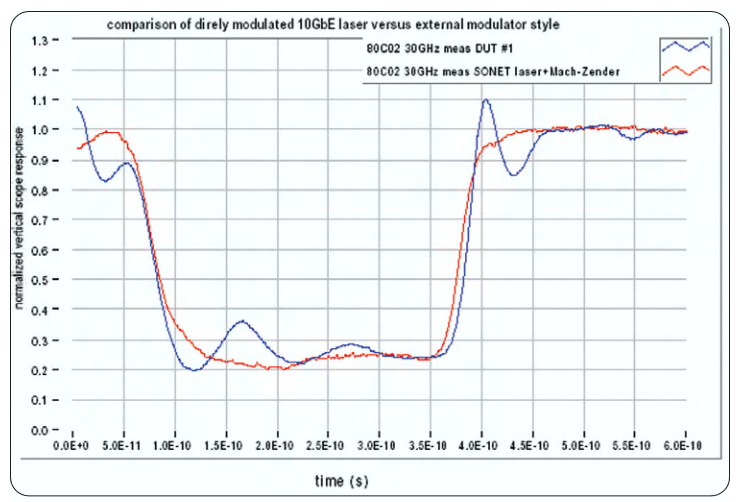
Because electrical current applied to an externally modulated laser is kept constant, this greatly reduces such issues as "chirp" (and therefore, dispersion), laser reliability, and most importantly for mask testing, relaxation oscillation. Figure 8 shows an overlay comparison of a 10GbE directly modulated laser and an externally modulated 10 Gbps transmitter in the same serial PRBS 27–1 digital pattern and section. Capturing the data was the 80C02 in a 30 GHz setting. Evidence points to the external model having virtually no overshoot and also substantially lower aberrations.
The lack of relaxation oscillations in externally modulated 10 Gbps SONET/SDH long-haul components lessens the deviations observed between various reference receivers compared to newer 10GbE directly modulated laser transmitters. In 2.5 Gbps and lower bit-rate systems with directly modulated lasers, the relaxation oscillations have tended to be at frequencies of 2.5X to 3X and greater compared to the fundamental bit-rate frequency. This ratio of oscillation frequency to the data rate contrasts to the typical directly modulated 10 Gb laser, in which the relaxation oscillations are often only 1.5X to 2X the serial data rate frequency. Relaxation oscillations and other aberrations below 20 GHz frequencies in 10 Gb systems can cause significant variations from one compliant reference receiver to another. Extending the linearly extrapolated tolerance curves up to 20 GHz can provide a projected worst-case difference between two compliant receivers to suppress a 20 GHz relaxation oscillation from –16 dB to –27 dB.
Mask Testing
A mask test is often the best method to quickly verify that the transmitted signal meets industry standard requirements. Masks are defined so that signal distortions such as excessive overshoot, jitter, excessively slow rise and fall times, etc. could all cause the mask test to fail. When performing a mask test, the stimulus signals are often random data or pseudo-random data streams. With a persistence display mode and onscreen mask displays, an oscilloscope can easily verify whether or not a signal complies with a particular standard.
Mask testing of eye diagrams enhances their usefulness. When a telecom standard eye diagram mask is displayed, the user can quickly determine if the signal is within the limits specified by the standard.Further, if automatic measurement of mask hits is turned on, the oscilloscope can monitor the signal and log any mask violations.
Mask Margin Testing Deviations
If standard masks are not sufficient for a device characterization test,masks with wider exclusion zones can be defined. By using a mask with wider exclusion zones, the pass or fail margin of a design can be characterized. Manufacturers commonly test transmitters against eye templates by enlarging the masks slightly to ensure there are adequate margins available on outgoing products.
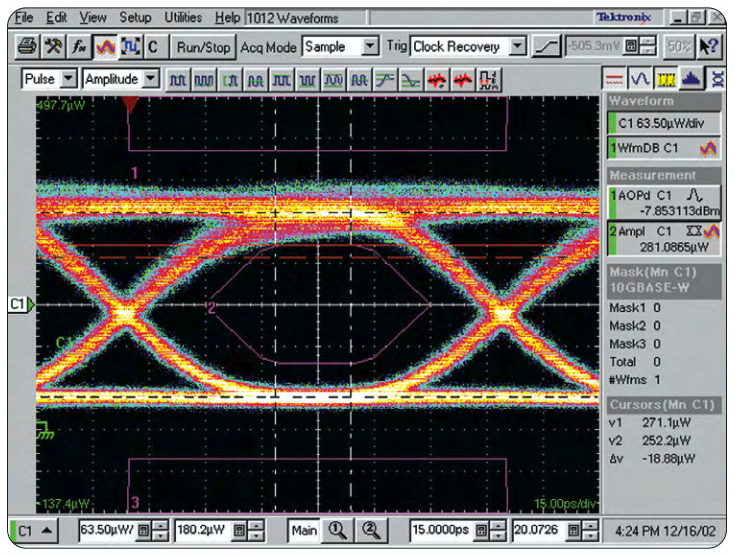
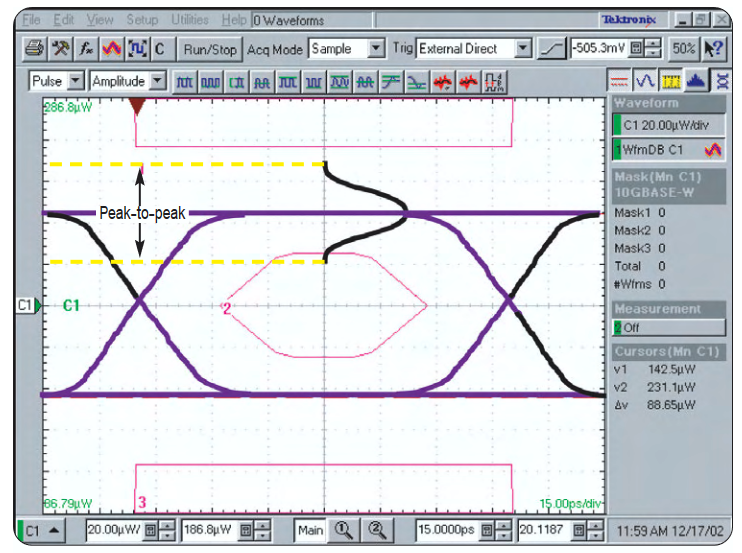
The 10GbE template for testing an eye diagram against a mask is defined by the IEEE 802.3ae standard in the Physical Medium Dependent Section 52. The TDS/CSA8000B allows the user to enable and set the margin in percentage units. The 0% margin is the standard mask with no change in its shape from default. Non-zero mask margin settings affect the gaps between the three masks – the center and top and bottom rectangular masks. As the center mask is uniformly increased together with the top and bottom rectangular masks, the gaps between the masks narrows. A 100% mask margin is when the gap is completely closed (see Figure 9). With a 50% mask margin, the gap would end up being one-half of what the default 0% margin mask would have.
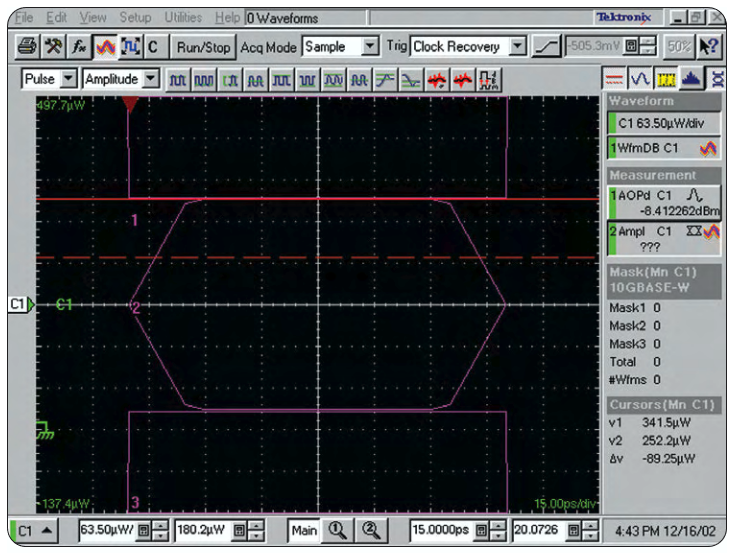
In Figure 10, which depicts a 0% mask margin, the cursors are set to measure the vertical position of the top edge of the center mask. Meanwhile, in Figure 11, where the mask is set to a 20% margin, one of the horizontal cursors is placed at the top of the center mask, while the other cursor is at the original top-edge location from the 0% margin setup. Both figures show that the change in vertical location of the center pass/fail edge is 18.9 µW.
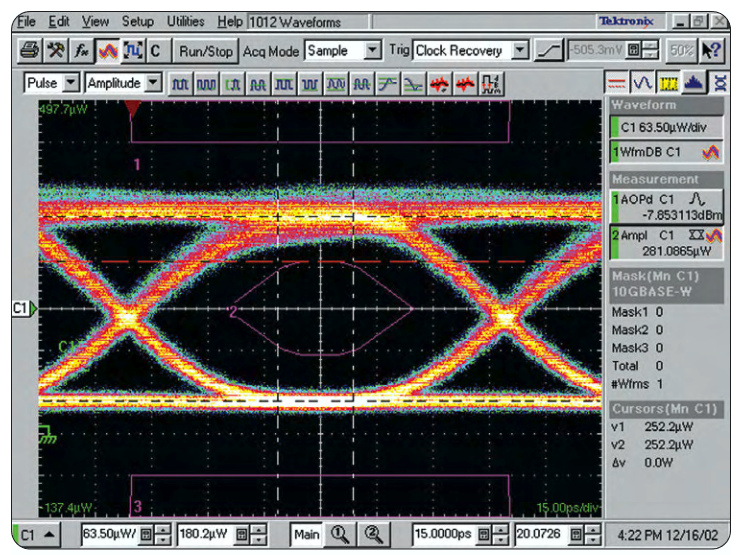
lt is always helpful if the user can describe the height of the eye and mask margins in terms of the normalized height of the eye. Again, in Figure 11, where the 10GbE mask has a 20% margin setting, the height is 281 µW, and 1/20th of that margin results in a 1% margin of 0.945 µW. This serves to show that some of the volatility of mask margin results is magnified by the ratio of such margin percentages to the overall height of an eye. For this particular 281 µW-height eye, a 2.81 µW vertical difference in any waveform aberration or feature (1% of the eye height), which intrudes into the center of the eye, would lead to a 3% reduction in a mask margin pass-fail result. 10GbE mask measurement results are less sensitive to aberrations than those associated with 10 Gb SONET/SDH masks for which ITU-T standards define a much narrower gap between the center and upper mask.
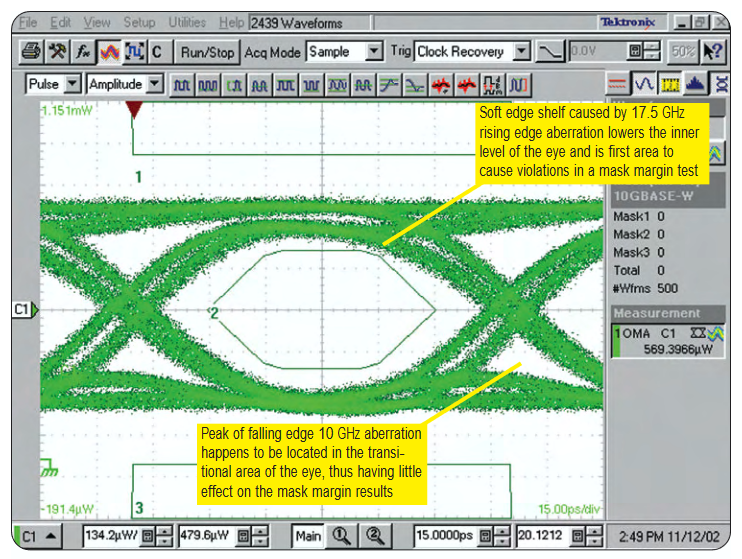
Relaxation oscillations and other aberrations may or may not have an impact on mask margin percentage testing. The 10GbE laser transmitter has distinctly different types of aberrations on the rising edge versus the falling edge. A 17.5 GHz ringing aberration and the RRs response to this ringing causes a "soft" edge, which pulls down the initial center-of-eye ON level that the zero-to-one transition experiences (see Figure 12). This lowers the margin of the center mask before a violation occurs. The 10 GHz ringing from the laser after the falling edge is attenuated far less than the 17.5 GHz ringing following the rising edge. One then would naturally assume that the 10 GHz would impact the mask margin more severely. However, that would be incorrect since the peak of the 10 GHz ringing happens to occur about one bit-period after the falling edge in the transitional portion of the eye where the center mask margin is not affected. (see Figure 12). Another variable to be aware of is the potential frequency-dependent variation in propagation delay of signals through an RR system. This variation in the speed with which frequencies travel through a system is known as Group Delay. If an RR is not carefully designed to minimize the variation in group delay from one RR system to another, this can manifest itself in variations in the horizontal delay of various aberrations at various frequencies with respect to the rising and falling edges.
Noise Effects on Mask Margins
While aberrations in eye patterns can clearly cause different mask margin results, the magnitude of this impact may subtly vary from system to system. On the other hand, noise performance can have a much more significant and consistent impact on mask margin testing results. Tektronix’s 80C02 and 80C08C sampling modules exhibit different inherent noise performance levels. Noise characteristics of actual production 80C02 and 80C08C systems with 10GbE RR settings yield a typical RMS vertical noise of 1.7 µW RMS for the 80C08C, and 6.1 µW for the 80C02. When a conservative estimate of peak-to-peak noise that’s approximately eight times the RMS is applied to each module, the result is 13.6 µW and 48.8 µW for the peak-to-peak noise for the 80C08C and 80C02, respectively. How much difference there is in a mask margin result between these two modules based solely on noise performance variation is directly dependent on the signal level; the lower the signal level, the wider the differential between them.
To better understand what effect an optical sampler’s inherent noise has on mask margin results, it’s advantageous to start with the theory of a "noiseless eye." While there will always be some amount of noise on a laser signal, this concept helps to define the theoretical limits to which an optical sampler with noise can be used for mask testing. A noiseless 10GbE eye pattern can be seen in Figure 13. Here, the eye would have nearly 70% mask margins before failing. This is predicated on the fact that 10GbE standards allow more overshoot than undershoot, thereby leading to a violation of the center mask first as the mask-margin percentage increases in an aberration-free signal. When noise is introduced into a real system, it distributes itself around the nominal waveform. Because system noise in an optical sampler tends to be random in a white-noise-type fashion, this noise-induced distribution is Gaussian-like in the scope display’s vertical dimension. At increasingly lower optical modulation amplitude (OMA), the sampling system’s peak-to-peak noise itself will be on the same order of magnitude as the total gaps allowed in a particular mask, thereby consuming the entire available mask margin.
This concept is clarified further in Table 1, highlighting the theoretical 10GbE RR mask margin limit possible with a noiseless laser signal at 1310 nm and 1550 nm, using the 80C02 and 80C08C modules with a peakto-peak noise of eight times the RMS vertical noise. As the levels increase, the difference in results between both samplers narrows with each one able to measure the 70% ideal limit for a truly noiseless and aberration-free signal. A more concrete example would be a 10GbE transmitter having an OMA of 400 µW, which is very common for short-haul 10GbE transponders. When variations in aberration magnitude and phase are ignored, the average mask measurement result with the 80C02 would be 13% less than with the 80C08C, clearly showing that the 80C08C will yield substantially more accurate mask margins based completely on the noise performance differential.
When dealing with higher power signals, it can be difficult to discern any differences in the eye patterns displayed between two sampling systems at the same setting. Figures 14 and 15 show two separate eye patterns of the 1310 nm laser transmitter, using the 80C02 and 80C08C, respectively, in a 10GbE RR setting. Initially, both patterns appear to be the same, but upon closer inspection, it becomes apparent that the 80C02 has more noise from the trace displayed, which blurs the distinct separation between the various inter-symbol interference lines exhibited by the 80C08C.
Table 1. Ideal 10GbE mask margin versus power for 80C02 & 80C08 (1310 nm & 1550 nm)
| OMA (dBm p-p) | OMA (µWp-p) | 80C02:Perfect laser eye margin noise limit |
80C08:Perfect laser eye margin noise limit |
C08 vs 80C02 Mask margin advantage |
| 0 | 1000 | 62.7% | 68.0% | 5.3% |
| –1 | 794 | 60.8% | 67.4% | 6.6$ |
| –2 | 631 | 58.4% | 66.8% | 8.4% |
| –3 | 501 | 55.4% | 65.9% | 10.5% |
| –4 | 398 | 51.6% | 64.9% | 64.9% |
| –5 | 316 | 46.9% | 63.5% | 16.7% |
| –6 | 251 | 40.9% | 61.9% | 21.0% |
| –7 | 200 | 33.3% | 59.8% | 26.5% |
| –8 | 158 | 23.8% | 57.1% | 33.3% |
| –9 | 126 | 11.9% | 53.8% | 41.9% |
| –10 | 100 | –3.2% | 49.6% | 52.8% |
| –11 | 79 | –22.2% | 44.3% | 66.5% |
| –12 | 63 | –46.0% | 37.7% | 83.7% |
| –13 | 50 | –76.1% | 29.3% | 105.3% |
| –14 | 40 | –113.9% | 18.8% | 132.6% |
Horizontal Autoset Effects on Mask Margins
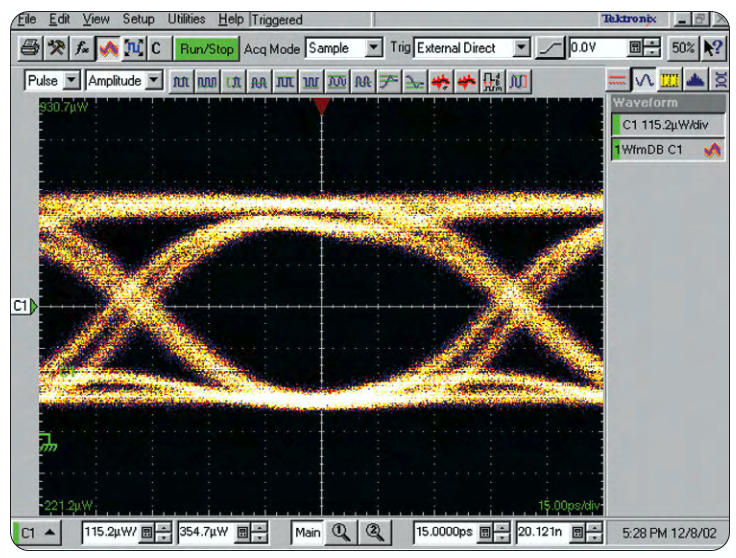
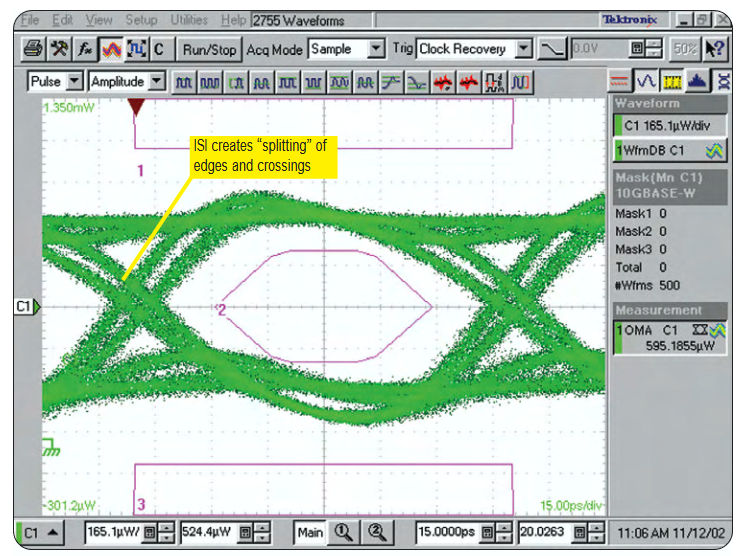
Inter-symbol interference (ISI) or datadependent jitter is caused by variations in rising and falling edges, as well as edge placement differences that can occur for different length bit intervals and combinations in a random bit sequence. These variations in rising and falling edges can cause a "splitting" of the eye pattern edges, as well as the locations where the rising and falling edges cross each other vertically and horizontally in the eye pattern. The ISI experienced by a 10GbE laser transmitter in a 30 GHz environment, the device-under-test in Figure 16, is a result of the laser and/or driver having different responses to variations in the sequential consecutive ones and zeros in the data pattern.
When ISI creates more than one clear crossing point (as seen in Figure 16), the possibility then exists for the eye-to-eye mask alignment to deviate from one Autoset to another. The CSA/TDS8000B Autoset routine attempts to align the eye pattern with the mask in the horizontal dimension based on the most predominant crossing; that is, the waveform database routines analyze the crossing areas, searching for the mode of heaviest concentration. It is possible for an eye pattern with heavy ISI to be very balanced in the statistical density of points that comprise each of the multiple crossings to the extent that the horizontal placement of the eye could shift slightly from one Autoset attempt to another. Depending on the location of the eye relative to the masks, aberration features in the center of the eye could better or worsen mask margins when these multiple-crossing Autosets occur
Mask testing results for directly modulated 10GbE laser transmitters using 10 Gb reference receiver optical samplers can deviate to a greater degree than they can for externally modulated lasers. These deviations are the result of various RR responses to laser aberrations. In the upper frequencies between 15 GHz and 25 GHz, these aberrations will vary slightly between the typical 10 Gb RR settings for the 80C02 and 80C08C samplers due to the 80C08C’s rolloff becoming progressively steeper at increasingly higher frequencies. This is due to the transimpedance amplifier that sits between the 80C08C’s OE and sampler. At this time, industry standards limit the deviations in rolloffs that can occur above 15 GHz for 10 Gbps reference receivers. At lower frequencies, the difference in response between the two samplers is smaller, although both responses are substantial. Laser aberrations at these frequencies tend to dominate the mask margins in eye pattern tests when they are large, and encroach on the eye mask’s central area.
To achieve the purest form of mask margin testing, one must look to the noise performance of the RR optical sampler because it ultimately dominates the amount of margin achievable when the signals-undertest are relatively low in amplitude such as typical 10GbE laser signals. In addition, aberrations and Autoset characteristics create +/– variations in the repeatability of mask margin results. However, these are generally minimized when the laser’s relaxation oscillations are at 20 GHz and above. When it comes to characterizing aberrant relaxation oscillation waveforms at higher power signals greater than 0 dBm, the 80C02 (as well as the 80C04, 80C09, and 80C11) offer both 10 Gb RR and same-module capability at 30 GHz bandwidth levels. But, it is the 80C08C that will provide more repeatable mask margins and better results for the more traditional 10GbE transmitter signals having between –4 dBm and –13 dBm average optical power
Eye pattern mask testing is a quick-check necessity for telecom/datacom OEMs, system installers and maintenance personnel to ensure that the time domain shape of their laser’s output signal is within the parameters prescribed by the international standards bodies. The reference receiver is the critical tool of choice to make this happen. As long as currently existing 10 Gbps reference receiver standards remain inviolate, deviations in mask testing results will remain a fact of the test and measurement cycle. Compounding the situation is the large installed base of 10 Gbps RRs that were previously designed for SONET/SDH signals, and are now being used on directly modulated 10GbE laser signals, leading to the probability of even more significant deviations.
While there is no one test sampling system that can presently expunge these deviations, there are proven solutions that can minimize the range of variations while following standards requirements. Tektronix’s amplified 80C08C optical sampler adheres to the same industry standards for 10 Gbps reference receiver tolerances. But with this module’s lower noise capability and more typical amplified roll off and group delay, real-world amplification can be emulated more closely, and provide a more representative mask margin that would be experienced by a 10GbE receiver in an actual network
Find more valuable resources at TEK.COM
Copyright © Tektronix. All rights reserved. Tektronix products are covered by U.S. and foreign patents, issued and pending. Information in this publication supersedes that in all previously published material. Specification and price change privileges reserved. TEKTRONIX and TEK are registered trademarks of Tektronix, Inc. All other trade names referenced are the service marks, trademarks or registered trademarks of their respective companies.
10/03 85W-16691-1