Analyzing Signals Across Multiple Domains
There is increasing interference in the RF domain as we work to make IoT devices more powerful, consume less energy and have longer battery lives but still broadcast high-quality RF communication. From smart watches to heart rate sensors, the devices being designed today are getting smaller and smaller, which makes signal integrity more important than ever before.

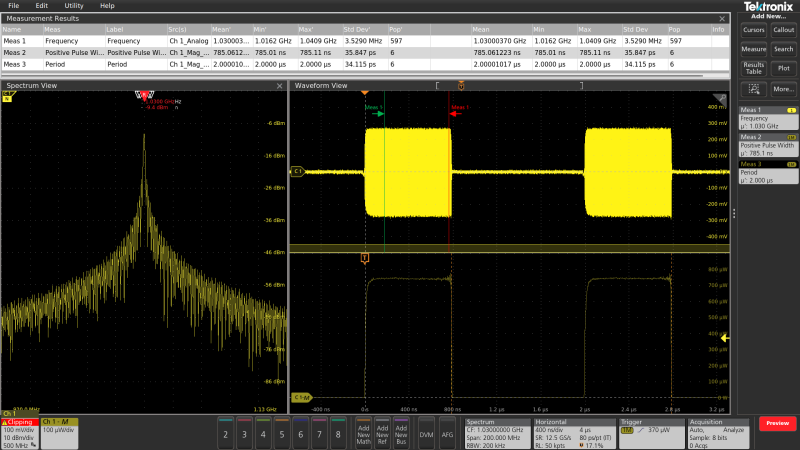
Figure 1: RF frequency trigger on wireless burst signal
Testing and debugging these embedded systems often involves looking for clues that can be hard to discover if you’re only looking at a single domain at a time. Mixed domain analysis, or the ability to look at time and frequency domains simultaneously, is especially useful for answering questions such as:
- What’s going on with my power rail voltage when I’m transmitting wireless and RF data?
- Where are the emissions coming from when I access memory?
- How long does it take for my PLL to stabilize after power-on?
While correlating signals across multiple domains has traditionally been a painful, technically challenging process, Spectrum View, which is available on our 4 Series, 5 Series and 6 Series mixed signal oscilloscopes, offers a solution.
Why You Might Want to Look at Signals in the RF Domain
Any and every signal can be built from a composite of sinusoids. This means that when we decompose the time domain signals with a fast Fourier transform (FFT), we can see whether any additional insights are hiding in plain sight. This could take the form of clock signals leaking onto serial communication signals and wreaking havoc in how an airbag sensor communicates with the airbag. It could involve power supply switching noise conducting into critical analog signal paths or even wireless transceiver signals radiating out of your meticulously designed electromagnetic interference shielding.
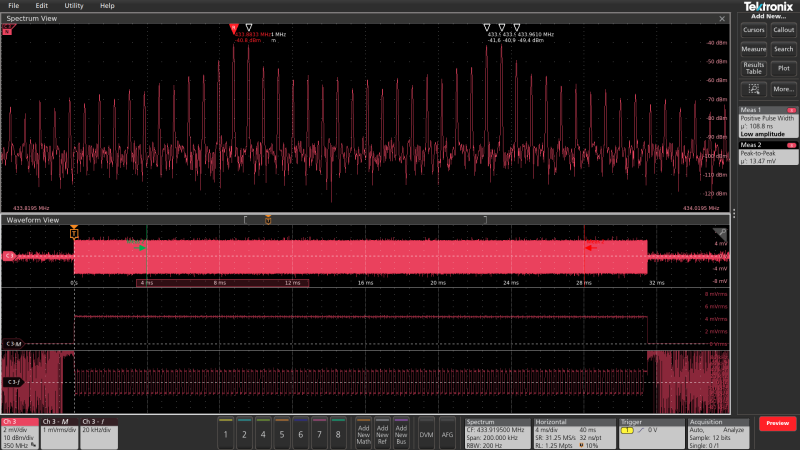
Figure 2: Gated frequency measurement on RF pulses
How Spectrum View Helps
Spectrum View makes measurements easier and more accurate, providing you with greater insights. Independent controls enable you to optimize both the time domain view and frequency domain view. An incredible feature called spectrum time allows you to observe how the spectrum is changing over time and how your time domain correlates at that exact moment. In addition, three RF vs time views are available to allow you to plot frequency, magnitude, and phase deviations as a function of time.
Available standard on the 4 Series, 5 Series and 6 Series mixed signal oscilloscopes as well as our low-profile digitizers, Spectrum View works all the way down at DC up to 10 GHz. You can set the span as low as 18.6 Hz and as high as 2 GHz. You can even look at eight channels simultaneously. And with a resolution bandwidth as low as 93 µHz, it enables you to resolve very small differences in between signals.
Learn more about how Spectrum View enables you to make easier and better measurements to help ensure that the things you are designing work as expected.