お問い合わせ
ダウンロード
マニュアル、データシート、ソフトウェアなどのダウンロード:
フィードバック
Try software tailored to your oscilloscope: 4 Series MSO, 5 Series MSO, and 6 Series MSO.
Power Analysis Application
3-PWR Datasheet
Key performance specifications
- Power Loss measurements at the switching device for improving switching power supply efficiency
- Automated Ripple measurement setup eliminates manual processes
- Automated THD, True Power, Apparent Power, Power Factor, and Crest Factor features eliminate tedious manual calculations
Key features
- Customizable safe operating area mask testing with linear and log scale for reliability testing
- Precompliance testing to the EN61000-3-2 Class A and MIL Standard 1399 Section 300A Standards reduces compliance test time and risk
- Modulation analysis quickly provides accurate active power factor characterization
- Deskew wizard ensures accurate, time-correlated results
- Correct scale factor and unit display while using third-party current probes eliminates manual calculations and human error
Applications
- Power loss measurement at switching device
- Characterization of power semiconductor devices
- Optimal drive characterization of synchronous rectifiers
- Measurement and analysis of ripple and noise
- Precompliance testing to IEC standard EN61000 3-2 Class A, MIL Standard 1399 Section 300A, and up to 400 harmonics
- Debugging active power factor correction circuits
3-PWR
With the 3-PWR Power Analysis Application installed on an 3 Series MDO, an embedded designer who rarely deals with power measurements can quickly get the same accurate, repeatable results as a power supply expert. By simply adding a software license to the 3 series MDO, along with differential voltage and current probes, it forms a complete measurement system for power supply design and test.
The Power Analysis application provides a number of specific measurements to characterize power supplies: Switching Component Analysis, Input Analysis, and Output Analysis.
Switching component analysis
The accurate calculation and evaluation of energy loss in power supplies has become even more critical with the drive to higher power conversion efficiency and greater reliability.
Switching loss measurements
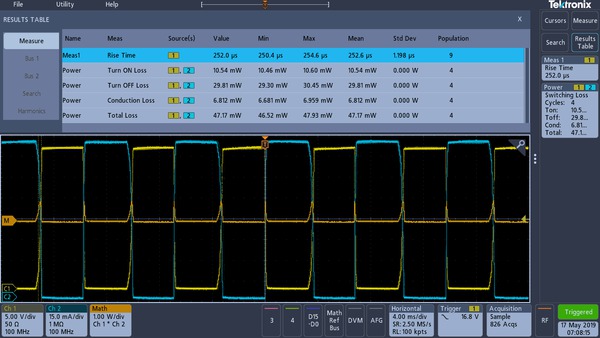
Although almost all components of a power supply contribute to energy losses, the majority of energy losses in a switch-mode power supply (SMPS) occur when the switching transistor transitions from an OFF to an ON state (turn-on loss) and vice versa (turn-off loss). By measuring the voltage drop across the switching device and the current flowing through the switching device, the Power Analysis application measures the switching losses as shown in the following figure.

Switching loss measurements
Safe operating area
The Safe Operating Area (SOA) plot is a graphical technique for evaluating a switching device to ensure that it is not being stressed beyond its maximum specifications. SOA testing can be used to validate performance over a range of operating conditions, including load variations, temperature changes, and variations in input voltages. Limit testing can also be used with SOA plots to automate the validation. An example of an SOA plot is shown in the following figure.
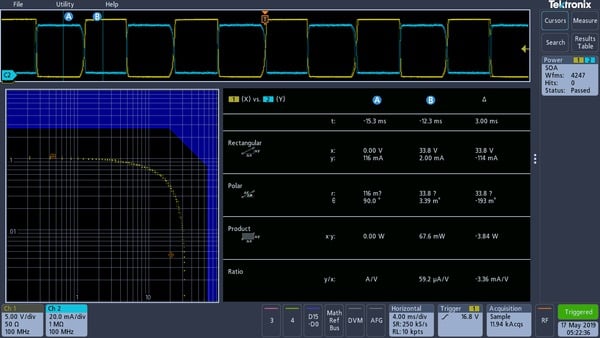
Safe operating area (SOA) display
Input analysis
Power quality measurements and current harmonics are two common sets of measurements made on the input section of a power supply to analyze the effects of the power supply on the power line.
Power quality
Power quality refers to a power supply's ability to function properly with the electric power that is supplied to it. These measurements help to understand the effects of distortions caused by nonlinear loads, including the power supply itself. The measurements include RMS voltage and current, true and apparent power, crest factor, line frequency, and power factor, as shown in the following figure.
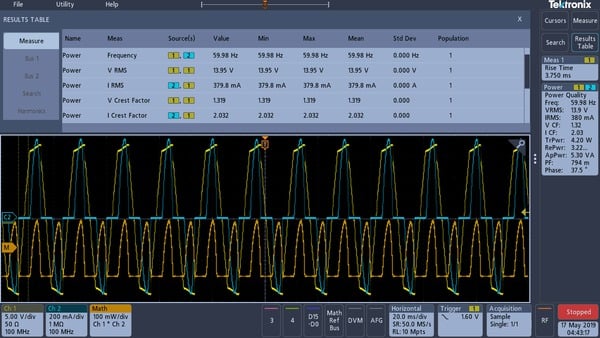
Power quality measurements
Current harmonics
Because a switching power supply presents a nonlinear load to the power line, the input voltage and current waveforms are not identical. Current is drawn for some portion of the input cycle, causing the generation of harmonics on the input current waveform. Excessive harmonic energy can affect the operation of other equipment connected to the power line, as well as increase the cost of delivering the electric power. Therefore, power supply designers can use the current harmonics measurements to assure precompliance of their designs to industry standards (such as IEC61000-3-2 Class A and MIL Standard 1399 Section 300A) before investing in the official compliance testing.
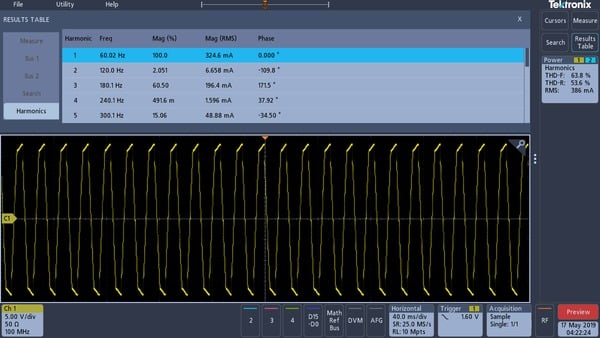
Current harmonics measurements
Output analysis
The ultimate goal of a DC-output power supply is to transform input power into one or more DC-output voltages. Especially for switching power supplies, the output measurements are essential. These measurements include line ripple, switching ripple, and modulation analysis.
Line and switching ripple
The quality of a power supply's DC output should be clean with minimal noise and ripple. Ripple measures the amount of AC-output signal.
The automated ripple measurement offers a special autoset function that allows you to specify a DC offset, and optimizes the vertical scale for the best results. The horizontal scale is not affected by the autoset, so you can adjust the horizontal scale to look at line-frequency ripple or higher-frequency switching ripple.
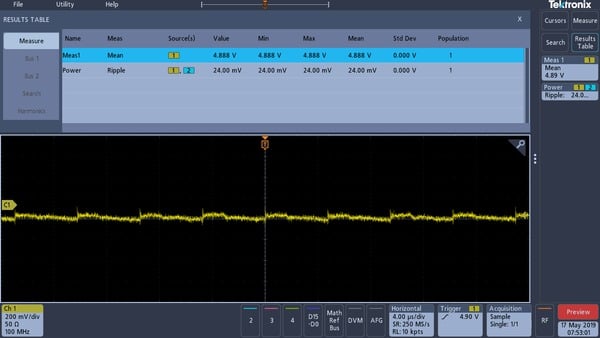
Output ripple measurements
Modulation analysis
Modulation is important in a feedback system to control the loop. However, too much modulation can cause the loop to become unstable. The Power Analysis application calculates and shows the trend in the on-time and off-time information of a modulated signal controlling the output control loop on a power supply, as shown in the following figure.
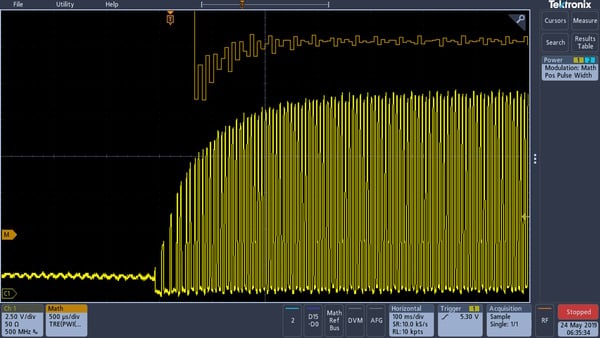
Modulation analysis on a MOSFET’s gate drive during power-up
The modulation analysis could also be used to measure the response of the power supply’s control loop to change in input voltage (“line regulation”) or change in load (“load regulation”).
Specifications
All specifications are guaranteed unless noted otherwise. All specifications apply to all models unless noted otherwise.
Instrument compatibility
- 3-PWR
- All models of 3 Series MDO
Measurements
- Power quality measurements
- VRMS, VCrest Factor, Frequency, IRMS, ICrest Factor, True Power, Apparent Power, Reactive Power, Power Factor, Phase Angle
- Switching loss measurements
-
- Power loss
- TOn, TOff, Conduction, Total
- Energy loss
- TOn, TOff, Conduction, Total
- Harmonics
- THD-F, THD-R, RMS measurements up to 400 harmonics
Graphical and table displays of harmonics
Test to IEC61000-3-2 Class A and MIL-STD-1399 Section 300 A
- Ripple measurements
- VRipple and IRipple
- Modulation analysis
- Graphical display of +Pulse Width, –Pulse Width, Period, Frequency, +Duty Cycle, and –Duty Cycle modulation types
- Safe operating area
- Graphical display and mask testing of switching device safe operating area measurements
- dV/dt and dI/dt measurements
- Cursor measurements of slew rate
Deskew
- Recommended deskew values automatically calculated based on propagation delay. Deskews can be set to recommended values or adjusted manually.
- TekVPI and TekProbe II
- Nominal propagation delay value automatically loaded
- Built-in probe model list
- Nominal propagation delay value provided when probe is selected
- Other
- Propagation delay can be manually entered
Ordering information
Module
- 3-PWR
- Adds power measurement and analysis.
Recommended accessories
- 067-1686-xx
- Deskew fixture
- TEK-DPG
- Deskew pulse generator
Typical recommended power probes
Voltage and current probes are required for most power measurements. For a complete listing of recommended probes, please refer towww.tek.com/probes.
- THDP0200
- ±1.5 kV, 200 MHz TekVPI® high-voltage differential probe
- TCP0030A
- 30 A AC/DC TekVPI® current probe, 120 MHz BW

