Impact of Noise on BER estimation
- BERT can perform a BER measurement at a set vertical threshold at a given timing (within the UI).
- By varying the timing of the BERT (within the UI) a plot of BER vs timing can be obtained - a "BER bathtub" plot. Insofar as the points of such bathtub plot are obtained from BERT measurements (rather than extrapolation) this will correctly describe the BER vs. timing of the BERT receiver used for the given signal.
- Since the BERT measurement to low levels of BER is costly in terms of time alternatives are often used; one of which is estimation of BER bathtub from jitter analysis of the signal.
- It is intuitively obvious that the fact that only horizontal (jitter) impairments are analyzed causes error in the BER bathtub plot. Here is an quantification of the error due to lack of consideration of the Gaussian noise (vertical) under one set of conditions.
The Setup of the Simulation
The simulation is based the following signal: a 10 Gb/s PRBS7 impaired with ISI (BW limiting) but otherwise ideal (no PJ or PN, etc.).
To such signal two impairments are added: Gaussian horizontal jitter and Gaussian vertical noise
To be explicit: The waveform is ‘shaken' horizontally by the Gaussian jitter, and is shaken vertically Gaussian noise. So the way the jitter is accounted for is slightly different from the "RJ", which includes horizontal and vertical uncertainty translated through slew-rate.
The signal's BER bathtub is then calculated in two ways:
- Bathtub based on jitter at threshold analysis, then Dual Dirac extrapolation
- Bathtub based on complete analysis (JitterNoise )(i.e. horizontal and vertical) – the same as an ideal receiver would see
The two bathtubs are then compared as a bathtub plot and as a Q plot. (in the Q plot Gaussian event plots as a straight line, so it's a good way to spot settle changes from Gaussian).

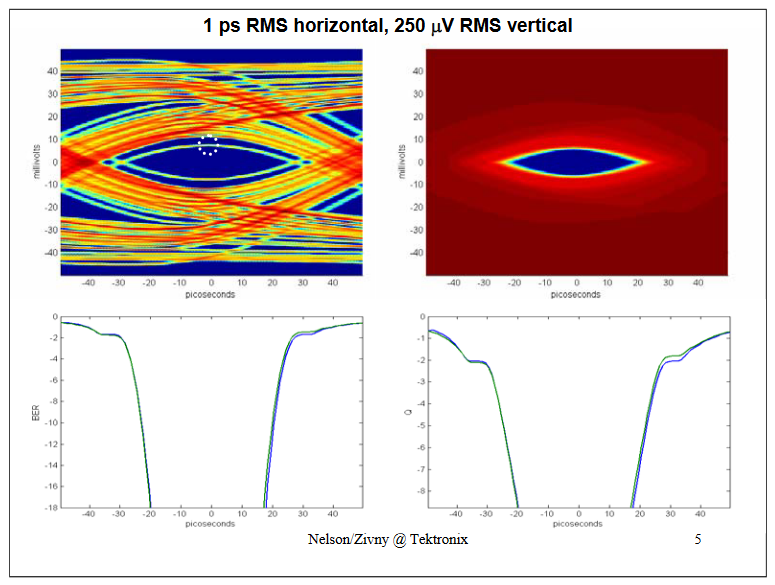
Top Left shows a probability eye, Top Right shows a BER eye.Bottom Left shows a BER bathtub, Bottom Right shows a Q bathtub.In the bottom graph the Green is the Jitter-only method, the Blue is the complete (JitterNoise) method.
The Jitter-only and the completel (JitterNoise) predictions agree.
With a decrease in horizontal uncertainty the BER and Q curves still track nicely.
Incidentally notice that a few of the bits (highlighted by a white circle) are impaired so heavily that they barely make it over the decision threshold. This will be revisited below.
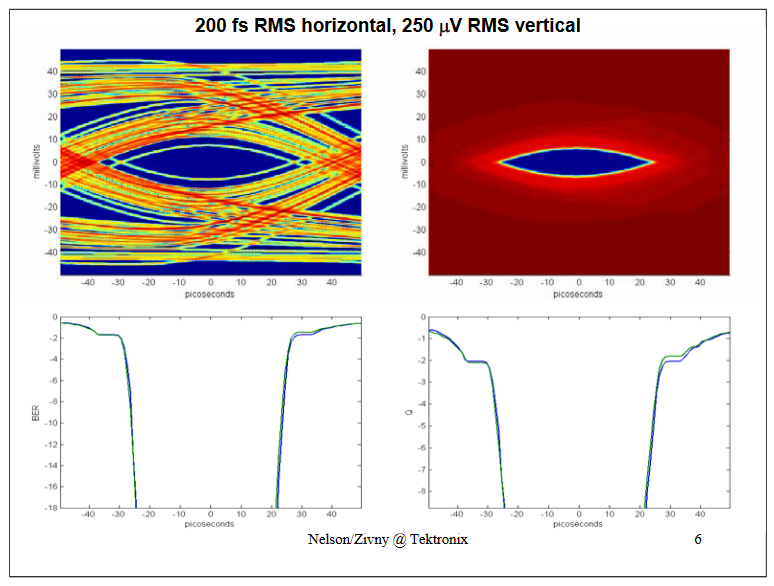
Now with a very small amount of jitter: The BER and Q curves still track nicely.
The previous three slides show us that the "jitter only" view agrees with the definition of BER in systems that are dominated by "jitter" (real horizontal uncertainty). (There was very little noise in the signals; the SNR was very high).
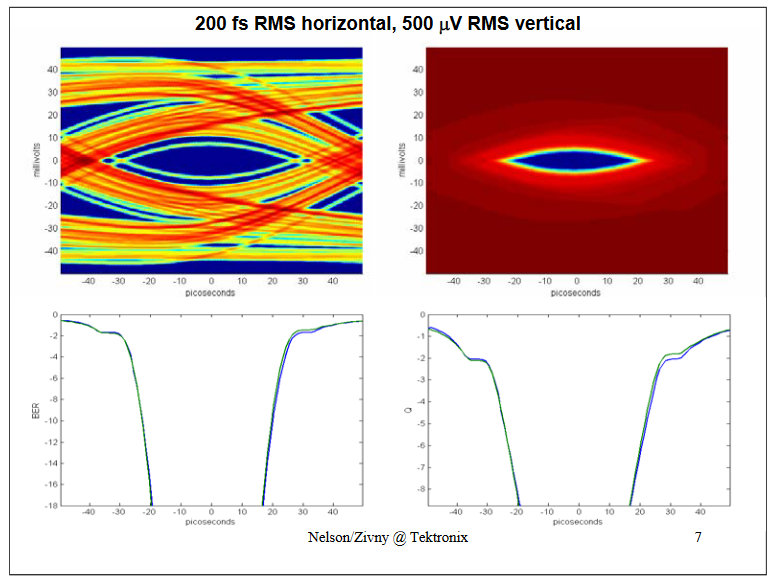
Now to verify the sensitivity to noise: Doubling the vertical uncertainty to 500 uV RMS: The BER and Q curves for Jitter-only and for complete (JitterNoise) calculation track nicely.

With an increase in the vertical uncertainty to 750 uV it's noticeable that the BER and Q curves are starting to diverge at low probabilities (Jitter-only analysis is in green and complete (JitterNoise) analysis is in blue).

With the increase of vertical uncertainty to 1 mV the BER and Q curves for the Jitter-only (green) and complete (JitterNoise, blue) don't agree very well anymore.
Importantly the JitterNoise BER curve isn't Gaussian at low probabilities; in other words the Dual Dirac model breaks down (around BER of 10-12 ) for this system.
In other words, in a system with significant "noise" (vertical uncertainty) the "jitter only" view and the Gaussian approximation break down.…Why?
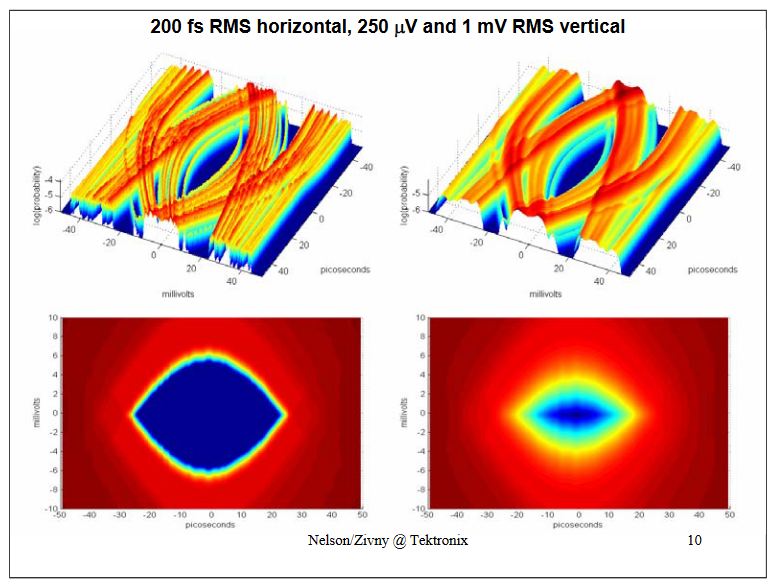
Compare the 250 uV and 1 mV vertical noise cases. In the 1 mV case the BER at the center of the eye is influenced by vertical noise from the waveform directly above and below it (where the immediate waveform has zero slope). This influence has little to do with the "jitter" on the edge crossings (25 ps away). True, when you measure the "RJ" on an edge with a histogram you will see the effects of this vertical influence, but because of the waveform curvature the histogram you see will not be a simple Gaussian – as per the following slide:
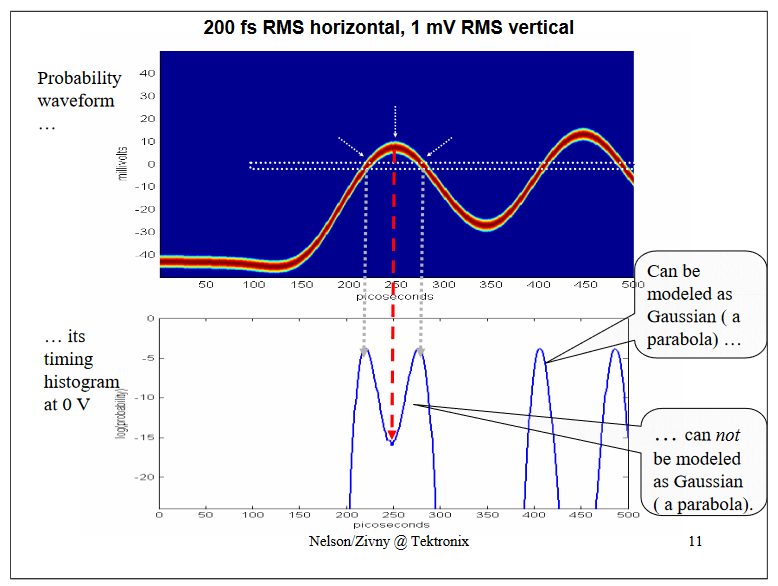
Here is the waveform around one of the heavily impaired bits (the one pointed out on the slide "1 ps RMS horizontal, 250 uV RMS vertical"). If one would measure the "RJ" at the decision threshold with an histogram (the histogram box being the white box in the middle of the top image) one can see that at low probabilities its histograms (lower image) are certainly not Gaussian - if they were, they would be parabolic on a log scale. Instead, the two histograms bleed together and are biased toward the middle (pointed out by the red arrow), simply because of vertical noise and waveform curvature. The histograms are not simple Gaussians, so the "jitteronly" view and the dual-Dirac approximation are insufficient to describe this signal.
Summary
- The "Jitter only" approximation of BER is adequate in systems which are dominated by horizontal uncertainty and sharp signal edges (risetimes much shorter than a UI).
- Systems which suffer from unbound noise in the order of SNR of 100:1 (40 dB) (signal to rms noise), or more (noise – i.e. lower SNR) and exhibit significant rise/fall times (nearing the UI in duration),can not be modeled to low BERs (10-12 or lower) with a jitter-only models (such as Dual Dirac) and more elaborate two-dimensional model is required to analyze BER.