
Abstract
In recent years mask testing added hit ratios, margins and auto-fit. In parallel, jitter and noise analysis produced statistical models identifying categories of impairments and allowing extrapolation of results to lower BER (bit error ratio) levels.
Mathematically the models are presented as PDF eyes and BER contours. Tests expanded from measurements on simple acquired data to measurements on data generated by models built in statistical space. Mask testing on these models provides more accurate and repeatable results, possibly extrapolated to lower BER levels.
This paper relates mask testing on these models with that ultimate figure of merit, the system BER as measured against a mask. It includes a new method that determines the BER of a mask from an eye diagram without access to the pattern.
Authors Biography
Dr. Richard Poulo is a Software Engineer with Tektronix. He holds a PhD in Computer Science from Rutgers University and an MS in Physics from Cornell University. His contributions at Tektronix have been in mathematical analyses, algorithms and software for digital signal processing including analysis of jitter, noise, eye diagrams and mask testing.
Maria Agoston is Principal Engineer with Tektronix. Her contributions to Tektronix instruments have been in the area of digital signal processing, in the space of jitter, noise and BER analysis techniques. She holds a MS in Computer Engineering from Oregon State University and a MSEE from the Polytechnic University of Bucharest. Maria has been awarded several patents in area of sampling oscilloscope waveform processing, and has authored several papers on high speed serial link analysis.
Ron Henricksen is a Principal Engineer with Tektronix. His expertise is in sampling oscilloscopes measurement and operations. He holds an EE degree from Washington State University and has been with Tektronix for 40 years. He has been awarded patents in the areas of oscilloscope signal processing and analysis and has authored papers on serial data link analysis.
Pavel Zivny is a communications measurements domain expert with the high performance oscilloscopes group of Tektronix. Pavel was granted oscilloscope related patents, authored industry articles and papers, and represents Tektronix to high-speed serial data standards committees.
Introduction
The ultimate figure of merit of a serial data link is its BER (Bit Error Ratio). While BERTs (Bit Error Rate Testers) provided the highest confidence level of BER, the need for better analysis of physical layers, for shorter measurement times and for lower costs resulted in complimentary oscilloscope-based methods. These now include statistical models of jitter and noise that allow the extrapolation of system behavior to low bit error rates (10-12 and below) from limited amounts of measured data.
The history of mask testing evolved through multiple phases. In this paper we somewhat arbitrarily define several phases and provides the mathematical framework to an addition to the BER measurement based on an 2D eye histogram.
Phase one introduced the eye diagram for which a two-dimensional measure of goodness was introduced in the form of mask testing. A certain amount of data was acquired and a pass/fail decision made based on the penetration of data into the mask. Repeatability and confidence level were significant issues.
Phase two defined Hit Ratios that introduced probability to mask testing. Hit Ratio is a limited indication of the probability of error, limited chiefly because all hits inside the mask are considered equal. Nevertheless, repeatability and confidence in targeted performance were greatly improved.
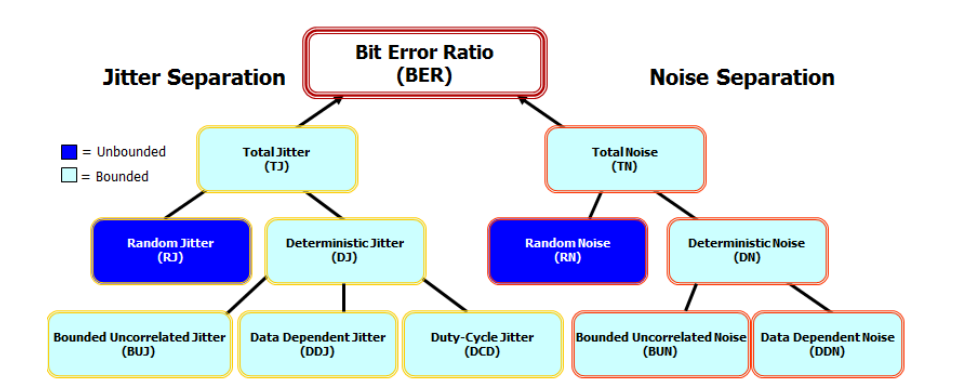
Phase three uses jitter and noise decomposition that allowed the creation of impairment models. These models use Probability Distribution Functions (PDF) and Cumulative Distribution Functions (CDF) to predict jitter and noise impairments and synthesize the BER value..
Adding mask testing to PDF eyes and BER contours, and computing these models at multiple points in the link further expands DUT analysis. Transmitter equalization, de-embedding of fixtures and probes, multiple models of channels and multiple receiver equalization models allow for extensive exploratory mask testing.
We present an addition to Phase three: Previously, BER computation on an oscilloscope required knowledge of the transmitted bit stream. Key our new method is that it does not require such knowledge. It requires only the eye diagram model of the received signal in order to compute the BER. This allows this method to expand BER measurement to nonrepeating patterns and very long patterns which previously were costly to acquire and analyze. Furthermore, this method computes the actual BER of the DUT rather than qualifying measurement results with a target BER as previous methods did.
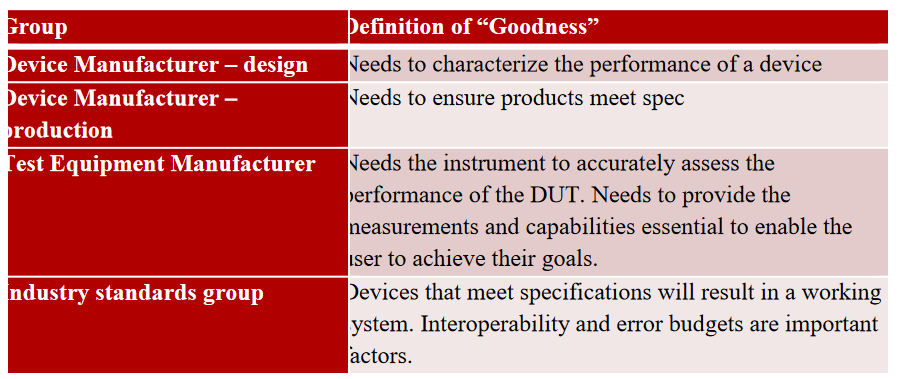
Who Uses Mask Testing and Why?
Device manufacturers use mask testing to characterize the performance of their devices during development. In this case, the designer wants to know more than just pass/fail information. They want to understand what the device’s margin of error is, and if the margin is unacceptable, what is contributing to the error rate.
Device manufacturing is most interested in pass/fail indication unless they are doing lot testing. In this case, it is important to know the error margin so that a lot of devices can be deemed acceptable.
Industry standards groups use masks to parcel out error budgets between different parts of the communication channel. They need to define tests that will insure interoperability. Test equipment manufacturers need well-defined standards so they can accurately assess devices under test. They also need to understand customer needs so they can provide capabilities needed by each of these groups.
A Brief History of Mask Testing
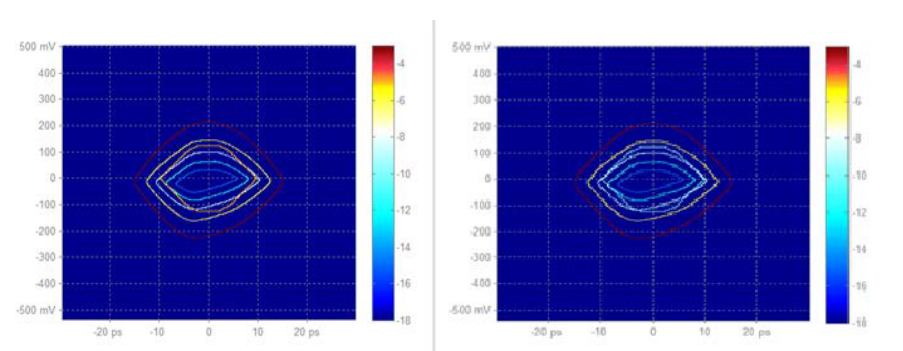
With the advent of digital oscilloscopes in the 1980’s, automated mask testing became possible. The processors on the scopes could place acquired data samples into bins in a twodimensional matrix, counting the number of times a data sample was placed in each bin. This is the data base behind the eye diagram. This data could be compared to defined polygons or masks, to determine if any of the bins inside of any of the polygons contained any data hits. This simple but convenient method enabled automated mask testing. This was a major improvement in the ability to determine whether a serial data signal was acceptable. Pass or fail criterion was determined by whether any hits occurred inside any of the mask polygons. However, there are several limitations with this type of mask testing. If there are no hits, there is no useful data on how good the signal is. The eye diagram on the left indicates a superior signal quality than that on the right but neither has any mask hits. In addition, all hits in any polygon are counted the same no matter where in the polygon they occur. Intuition would suggest that hits in the middle of a polygon indicate a poorer quality signal than hits near the edge of a polygon. Another problem is that outliers can disproportionately affect the results. Since an element of each jitter and noise is an unbounded distribution (typically Gaussian), it is possible for an outlier sample to distort the results since the mask only counts hits and does not consider whether a hit might be an outlier.
Recent improvements to mask testing have attempted to address these issues. One improvement adds the measurement of mask margin. This is a defined way of increasing the size of the mask polygons until hits are recorded. The largest margin with no hits is considered the margin for that set of data. This provides a numerical way to assess the differences between the sets of data shown above.
Recognizing that the hit data in the data base represents statistical information about the signal, a second improvement is the hit ratio measurement. In this case, hits are allowed but limited to a ratio of the total number of data points acquired in the UI. This, combined with the mask margin measurement, provides statistical information about the quality of the signal being analyzed. This approach addresses the problem with outlying data as discussed above; additionally, longer tests, with more statistically significant data, now simply provide more accurate measurement. However, the hit ratio measurement still suffers from the limitation that all hits within a mask polygon are equally weighted. In addition, the result still depends on the relatively few hits within the mask.
New Concepts in Mask Testing
To address the issues identified above, a new method for mask testing is proposed. Instead of comparing the mask to acquired data, a Probability Density Function model of the jitter and noise is created using the acquired data and the mask is compared to the model instead of the raw data. In this case, since the PDF model is derived from all data points within the UI, the resulting test is based on the entire set of data rather than just a few points. Additionally, because the model represents the probabilities of a hit rather than actual hits, the problem of hits counted equally within the polygon no matter where they lie is also solved. The result is increased certainty and repeatability of the mask tests.
Generating Statistical Eyes: PDF and BER Eyes
Moving beyond phase two which introduced statistical analysis, mask testing is performed on modeled eye diagrams in PDF and CDF spaces.
These models have been created with the jitter and noise decomposition techniques. Acquisition of targeted data, separation of bounded vs. unbounded, data pattern correlated and uncorrelated methods, followed by modeling and recombination of the elements of jitter and noise analysis, yielded the PDF and BER Eyes.
PDF Eyes
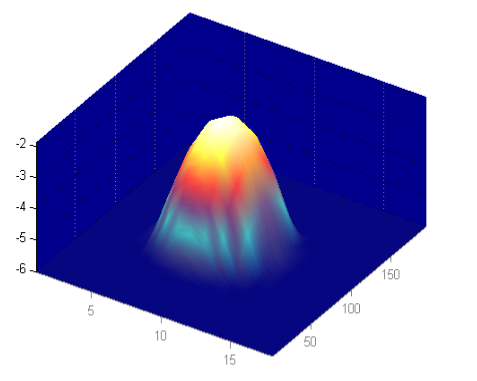
The process of decomposition of jitter and noise elements is followed by a step of reconciliation of the effects of jitter and noise, a modeling of the random elements by Gaussian distribution, and finally a re-composition of the Probability Distribution Functions (PDF) in an eye diagram (1-UI wrapped capture of all waveform’s trajectory). While the definition of the PDF Eye is the classic 2 dimensional probability distribution of voltage over the unit interval, key to the modeling of the PDF Eyes based on the jitter and noise decomposition is to predict behaviors beyond the probability that straight acquired data can yield.

Specifically, the PDF Eye that is subject to mask testing is the result of the convolution of the unbounded jitter and noise elements with the bounded probability distribution functions
Assuming that after the separation and reconciliation process the jitter and noise uncertainties are statistically independent, the combined probability is simply the product of two matrices representing the noise (transposed) and jitter distributions.

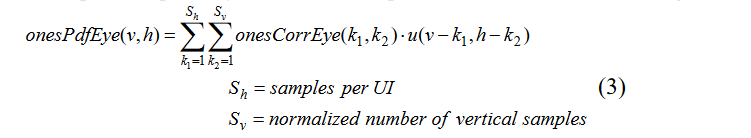
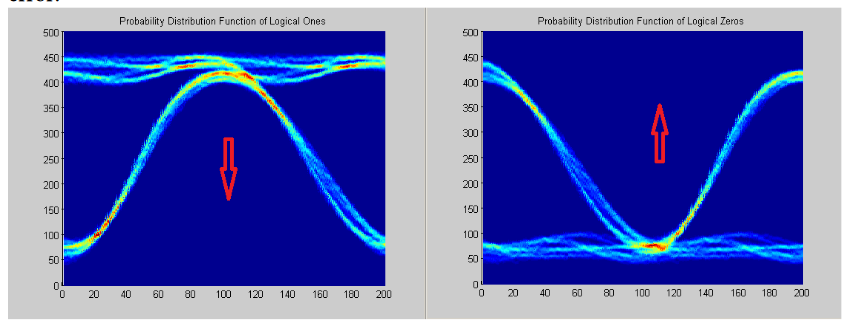
In preparation for the generation of BER Eyes (Bit Error Ratio) eye (surface, or contours) the stream of digital ones and zeros are separated, and the PDF for zeros and the PDF for ones are computed separately. Here is the expression for the PDF of the high level:
The full PDF Eye is the sum of the two partial PDFs, the ones-PDF and zeros-PDF.
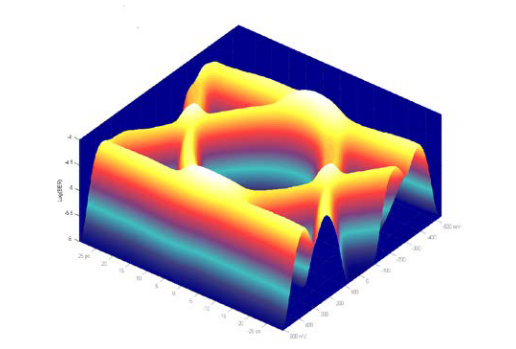
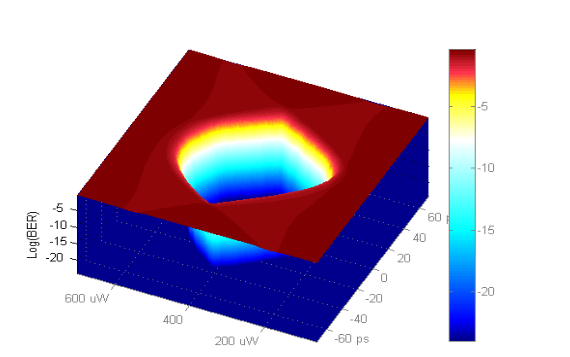
BER Eyes (BER surface)
The BER Eye calculation views the jitter and noise probability distribution functions from the perspective of the receiver – the decision circuit. Selecting a time in the unit interval as the decision point, the coordinates represent the sampling phase and decision threshold for bit identification.
If a bit is One, then any input signal that falls below the threshold is represents an error. Similarly, for a Zero, any input signal identified at slice point above the threshold will be an error.
Given the partial PDF Eyes, OnesPdfEye, or P1, for a decision point represented as the root of the arrow, the probability of misidentifying the 1 as a 0 is yielded by the integration of the P1 below the threshold of the decision point. In the case of the P0 the probability of misidentifying a 0 as a 1 is the integral of P0 (ZerosPdfEye) above the decision threshold. The sum of these probabilities is the BER for that decision point. Repeating this computation over all points yields the BER Eye (aka the BER surface), where V is the voltage of the selected decision point.

Note an important clarification on the generation and BER Eye analysis: It is necessary to separate the logical One and Zero bits before the probability integration that creates the BER Eye.
Mask Testing on PDF Eyes
The introduction of Hit Ratio as qualifier for mask testing output improved the repeatability, throughput and confidence level in measurement results.
Performing mask testing on the modeled PDF Eyes further enhances the confidence level in the accuracy of mask margin determination for a specified target hit ratio.
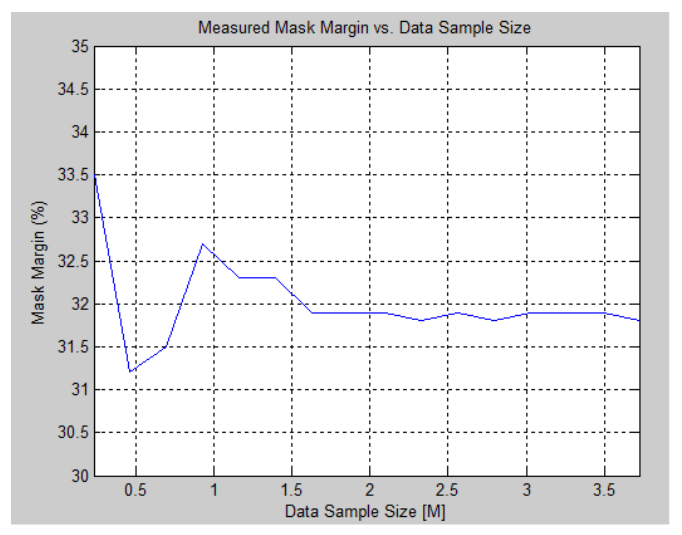
Using PDF Eye for Hit Ratio and Mask Margin computation improves the confidence level in the outcome of measurements in 2 ways:
- The actual physical data acquired for building the PDF Eyes are very sharply targeted acquisitions. For example components of jitter analysis are acquired repeatedly on an edge.Typical amount of sample size for the uncorrelated jitter analysis is 60,000 samples.
- Modeling the unbounded elements of signal impairments, in general the Gaussian distribution, allows the prediction of jitter and noise elements at significantly higher bit error ratios that a normal acquisition process can yield. Typical collection of data used for mask testing on acquired waveform databases will qualify the measured data with maximum 1E-5 BER values. The mask testing results on modeled PDF Eye will be computed to BER 1E-15 and beyond.
Assuming that each sample in the PDF Eye has been acquired on a single repetition of the signal pattern, which is the case in the equivalent time sampling systems, the Hit Ratio is computing by simply adding up the probabilities for every point within the mask.
Input / Output Specifications
There are several test cases to be considered when performing mask testing on PDF Eyes:
- Given a target Hit Ratio, compute Mask Margins.
- Given a target Mask Margin, compute the Hit Ratio
- Determine a Pass/Fail status for a set of target Hit Ratio and Mask Margin.
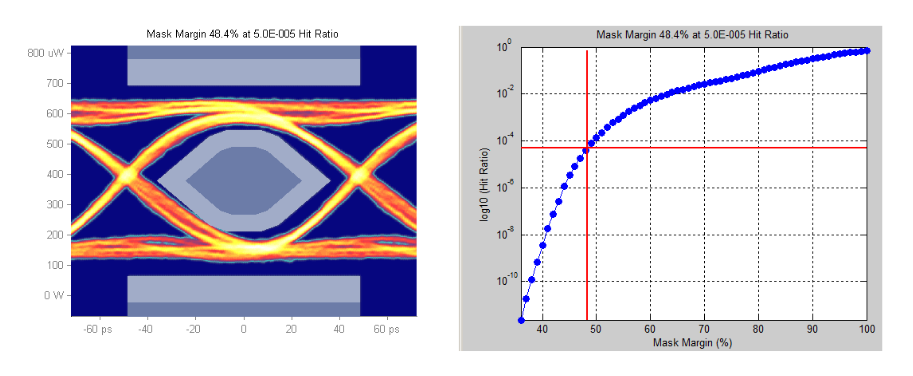
Figure 8 illustrates the computation of Mask Margin for a specified Hit Ratio. Here the target Hit Ratio is 5E-05, typical industry standard specification in e.g. IEEE Ethernet 10GBASELR mask shown (mask with hit ratio).
Mask Region Hits
The mask shown above, defined in Clause 52, IEEE 802.3ae 10GBASE-LR and here passing with 48.4% margins assumes all three regions, center, overshoot and undershoot are often considered to contribute to the assessment of the global Hit Ratio. See [1], [2] and [3] for more information on the origins of the hit ration in the mask test.
For signal links that include transmitter and/or receiver equalization, not all mask regions contribute to characterizing the BER of the link. Specifically, mask hits in the overshoot and undershoot regions are not relevant to the BER performance assessment of the link. Therefore, the option to target specific mask region is highly desirable.
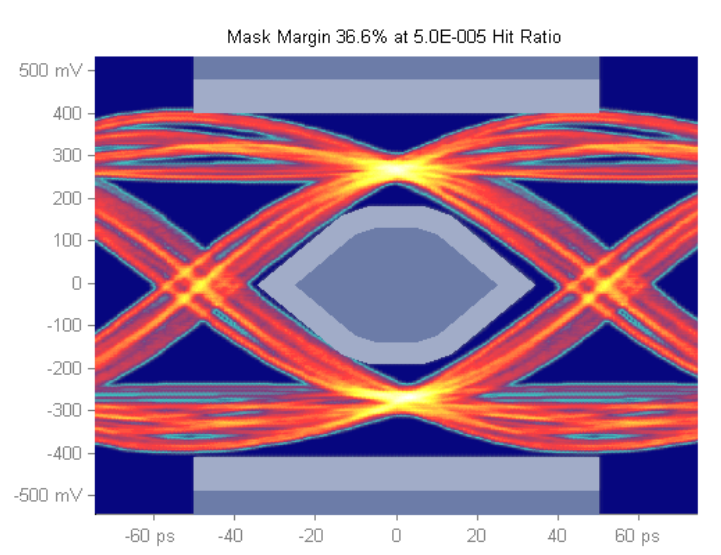
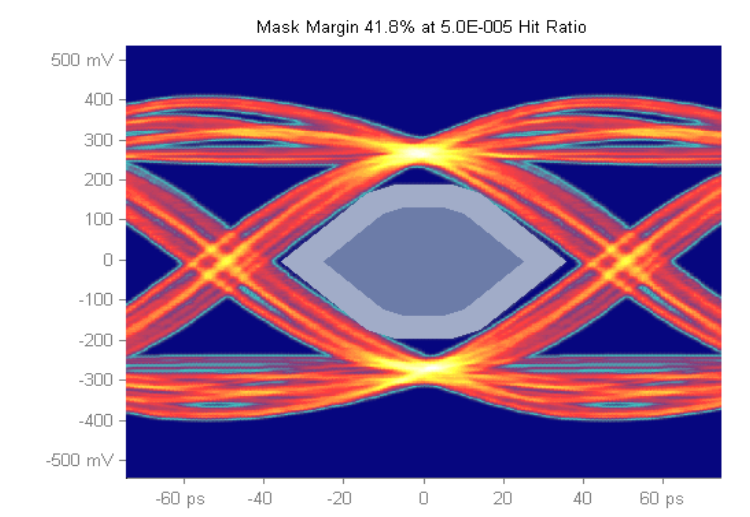
Figures 9 and 10 measure mask margins with the same target hit ratio; first plot shows a mask margin of 36.6% considering hits in all three regions, while the second plot shows a larger mask margin, 41.8% when ignoring the overshoot and undershoot hits.
Optimizations
Depending on the standard, the Horizontal position optimization might be allowed. In this algorithm the mask’s horizontal position is also optimized for the minimum number of hits, or for lowest hit ratio.
Limitation of Mask Testing on PDF Eyes
Because BER cannot be visible directly from a PDF Eye, there is a somewhat complex relationship between the Hit Ratio, the link’s budget, and the BER observed against the mask. Currently the practical usage is to perform compliance test against a PDF mask in the PDF space. The usage of mask test in the BER space is less typical.
Additionally, within the PDF eye test the following observations holds: Typical oscilloscope mask test is not aware of the logical values of bits in the data-stream. Consequently where logical 1 is interpreted as logical 0, misses any hit in the mask. The Hit Ratio assessment will miss this case, see Figure 11..
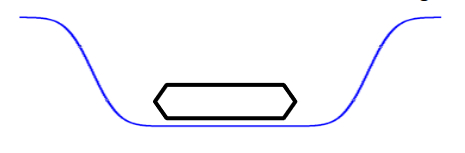
Missing such extreme error conditions would let us state that the Hit Ratio could be underestimating the BER of the link.
Mask Testing on BER Eyes/Contours
Mask testing on the BER contours or eyes moves the target of measurements from Hit Ratio in the PDF space to BER space.
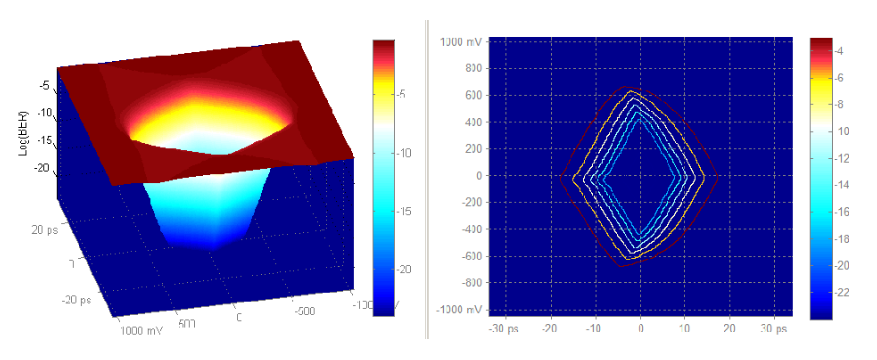
Actual testing on BER eyes can be performed on the BER contours that are generated from the BER Eyes (surface). A BER contour defines a constant BER value slice through a BER Eye.
For example, for a BER Eye, the BER Contours at the BER levels: 1E-3, 1E-6, 1E-9, 1E-12, 1E-15, and 1E-18 are shown in figure 12.
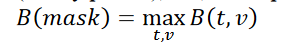
Given a target BER value b, the link that generated these Contours passes the mask test if B (see equation 4) is 𝐵(𝑡, 𝑣) ≤ 𝑏 for all time and voltage points within the mask.
An equivalent formulation is:
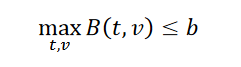
where t and v range over all points of the mask.
So results of the mask testing on a BER Contour when a target BER value is specified can be:
- Mask margin at the target BER.
- A Pass/Fail binary assessment, where Pass means that any point in the mask may be used as a decision point.
- Given a target mask, a critical BER or limit BER will be determined such that the mask (barely passes), i.e., the expression from the inequality above becomes:

A visual image of the critical BER would be answered by the question: how far down BER Eye funnel could the mask be dropped until it first contacts a BER Contour.
Limitation of Mask Testing on BER Eyes
There are several of limitations that user has to be aware when using mask testing on BER Eyes: for one, mask testing that is not aware of the bit pattern itself will miss catastrophic failure – e.g. errors in logic. This is typically not an important limitation, and can be remedied if the pattern is known
More limiting is the fact that the BER eyes (contours) generated from oscilloscope-acquired waveforms are the result of a combination of a partial logical one eye with a partial logical zero eye (see Figure 5) and as such they preclude the use of an eye captured without access to the pattern. In case of sampling oscilloscopes this means that very long patterns, as well as arbitrary data, can traditionally not be processed. Following section discusses a novel remedy for this trade-off.
BER Computation from a PDF Eye in the absence of a captured pattern
The previous chapter on using PDF Eyes for mask testing on link performance has several limitations (see above) to BER estimation. Here we’ll consider a novel method to calculate the BER against a mask from a simple acquired eye – no pattern acquisition is needed. Thus an arbitrary data stream or a very long pattern, e.g. PRBS31, can be analyzed for BER on a sampling oscilloscope.
This method in practical computations is aided by reasonable assumptions. For simplicity we temporarily restrict the discussion to NRZ signals.
Assume access to acquired vertical histograms eye P(t,v) (e.g. from a typical eye diagram captured on a sampling oscilloscope) and no access to the partial eyes P0(t,v) and P1(t,v) (because e.g. the data stream is arbitrary, so repetitive pattern can not be captured). Also assume the histogram to be a representative sampling of the underlying PDF. We now derive a formula for the BER limit involving just P(t,v). Two assumptions are necessary.
1. There is no appreciable probability of a 0 bit rising above the top of the mask or a 1 bit falling below the bottom of the mask, where top and bottom refer to the central polygon in a multi-polygon mask.
2. At each time t the maximum BER over the vertical span of the mask is at either the top or the bottom of the mask. While this assumption is generally valid the requirement imposed by it is sufficiently complex that discussion is a focus of another paper; contact the authors for details.
The first assumption above allows us to alter the limits of the integrals calculating the cumulative density function (CDF) from the PDF (histogram). The formula for the BER at mask point (t,V) becomes the following.
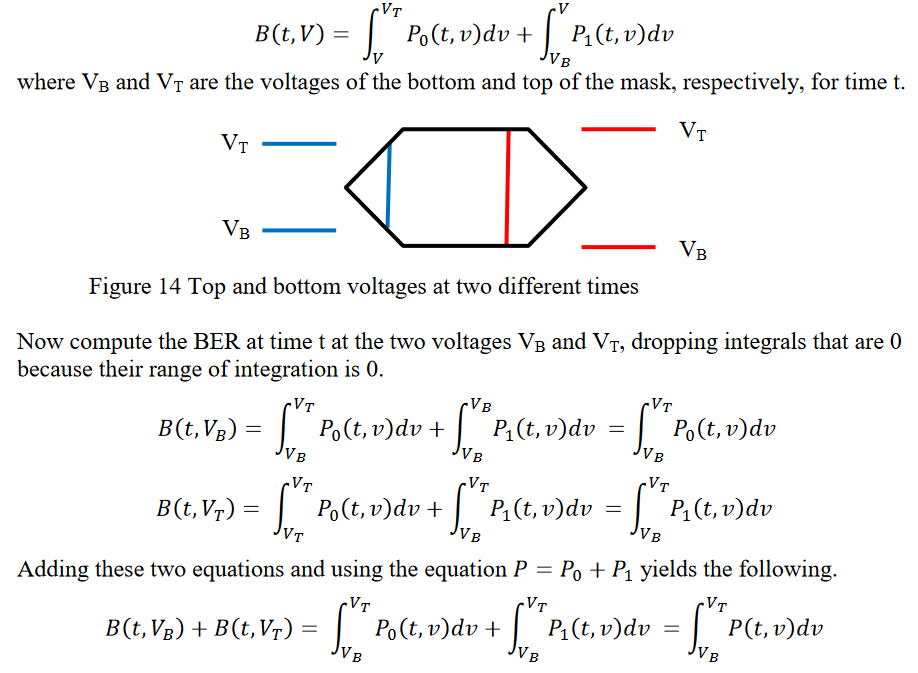
Define B(t) to be the largest BER in the mask at time t. Because BER maxima occur on the mask border by our second assumption, this largest value will be one of 𝐵(𝑡, 𝑉𝐵) or 𝐵(𝑡, 𝑉𝑇). Because both of these values are non-negative we have

where 𝛼𝑡 𝜖 (0.5, 1). We conservatively select the maximum value 𝛼𝑡 = 1 ; this is a pessimism which causes an error of up to a factor of at most 2. On the logarithmic scale usually used with BER measurements this error is of little impact. And if the eye diagram is
vertically symmetric so that 𝐵(𝑡, 𝑉𝐵) and 𝐵(𝑡, 𝑉𝑇) are equal we can still avoid this pessimism and set 𝛼𝑡 = 0.5.
These two results with 𝛼𝑡 = 0.5 and 𝛼𝑡 = 1 we call the symmetric BER and the asymmetric BER, respectively. An algorithm computing these results should be able to choose one of these bounding values or an estimated intermediate value based on the symmetry of the eye diagram.
The BER limit for the entire mask is given by

where t ranges from the left end of the mask to the right end.
Because this computation uses the array of 1D PDFs instead of the 2D PDF, more measured data is required to provide sufficient statistics for each vertical line. Of course, if it is known that the highest BER occurs within a certain time window one only needs good statistics for that window.
In summary: when we cannot capture the pattern, and have access only to an eye diagram with hits depth (i.e. a 2D histogram of the eye diagram), we can find not only the expected - the hit ratio for a given mask, but we can still find the BER for such mask (based on several assumptions listed above).
Emulation of a Signal Path
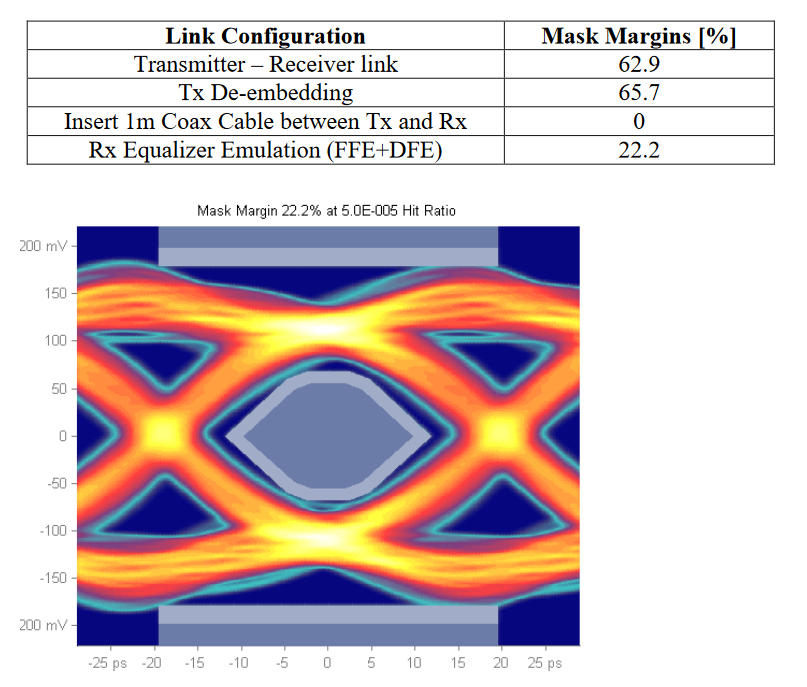
Adding mask testing to the tool-set used for SDLA (Serial Data Link Analysis) yields further performance insights. In addition to jitter and noise analysis at targeted BER numbers, mask testing brings a global assessment of the data link.
The configurable signal paths that link the transmitter to the receiver allow for mask testing at several points in the channel, e.g. output of transmitter, de-embedding of fixture, channel emulator, and finally equalizer models at the receiver side.
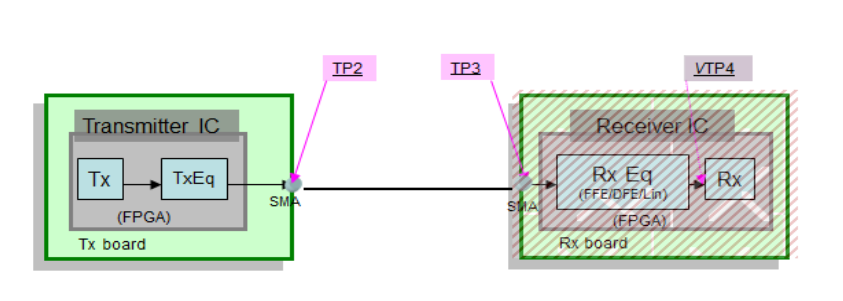
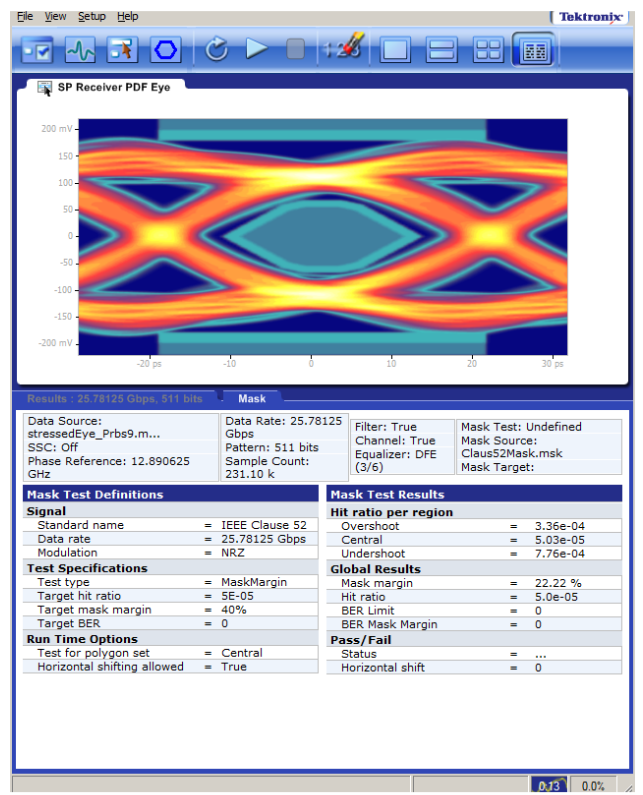
An example of results of measurements performed on a 25.78125 G link is given below:
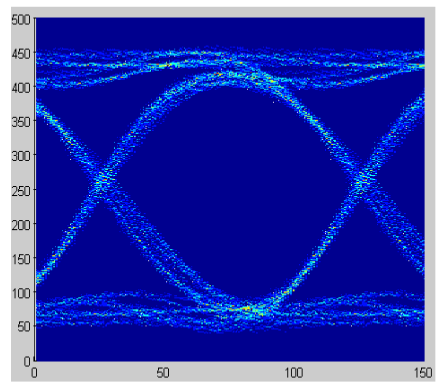
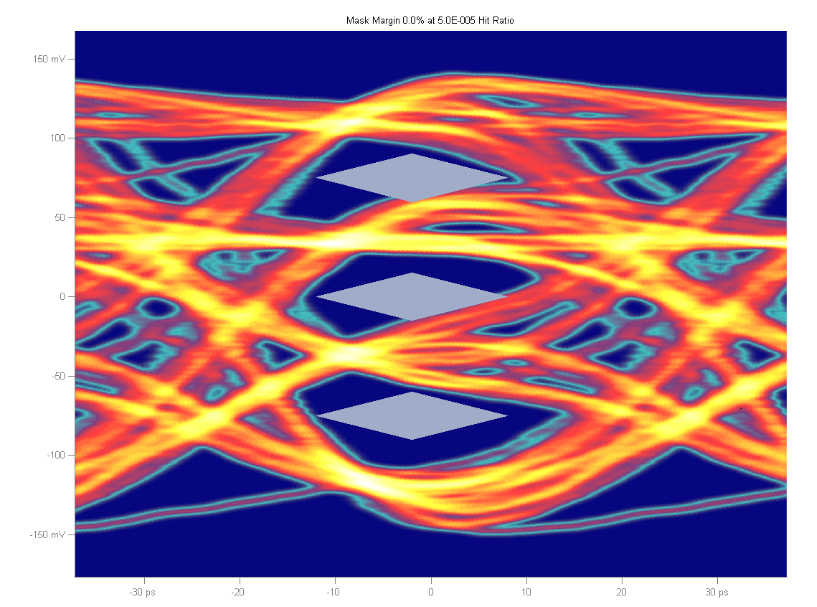
Future Challenges: PAM Mask testing
At this point it is not quite clear what key measurements will be used for PAM signals. PAM mask test can certainly be part of the tool-kit. Image below is an example of possible mask test on a PAM4 signal in the PDF space.
Conclusions
We presented three phases of mask test development. We have shown the basis for creating a synthesized probability eye (PDF eye) from the decomposed components of jitter and noise. We discussed the mask hit ratio as a precursor to such statistical modeling, and the advantage of models for allowing extrapolation of results of the mask test to lower BER (bit error ratio) levels.
We gave a basis for mathematical the models presented as PDF eyes and BER contours.
Finally we include a new method that determines the BER of a mask from an eye diagram without access to the pattern, a method which can therefore show the BER result of a mask against a non-repetitive pattern or a very long pattern, such as PRBS31.