Chapter I. Introduction
Modern radar design has created complicated pulses that present significant measurement challenges. Improvements to range, resolution and immunity to interference have required phase modulated pulses, frequency chirped pulses and very narrow pulses, with many of these exhibiting high bandwidth.
Tektronix provides a broad selection of test equipment suitable for radar pulses. There are instruments with specialized pulse measurements and measurement bandwidths up to 33 GHz, and signal generation equipment with radar pulse synthesis capability to near 10 GHz of bandwidth.
The radar measurements discussed here are all pulse measurements. Although there are several continuous transmission types of radar, primarily doppler, the great majority of radars are pulsed. The equipment and software solutions discussed here have been optimized to provide measurement flexibility and performance.
This primer addresses the needs for pulse generation and measurements, the automated measurements that are available, explanation of just how the automated measurements are made, and how pulses are generated.

Radar Measurement Tasks Through the Life Cycle of a Radar System
The measurements needed for radar may differ somewhat depending on the job to be done and the type or radar to be characterized. From radar system design and component selection to the surveillance of radars in use, accurate and fast measurements are required with reproducible results.
Challenges of Radar Design & Verification
During the verification of the design of radar, there is a need to assure that the transmitted signal is correct, that the receiver responds to correct signals, and that there are no unexpected signals emitted from the transmitter.
Unexpected outputs can range from unintended signals that are related to the desired pulse (such as harmonics, sub-harmonics, image mixing products, etc.), as well as spurious outputs unrelated to the desired pulse, such as radiation of internal local oscillators, coupling from digital clocks, spurious oscillations within RF circuitry, pulse errors, etc.
In the modern world of "software defined" radar, modulated pulses, chirps, and other waveforms are often created not with traditional analog circuitry, but with Digital Signal Processing, DSP, and Direct Digital Synthesis techniques that digitally synthesize complicated signals directly at IF or RF frequencies. These only become analog when the synthesized digital data is put through a D/A converter.
Within the DSP, subtle computer code errors such as illegal filter values or numeric expressions, can create very short-duration signals that may bear little or no relation to the desired output. A single incorrect computer instruction can create momentarily incorrect RF output. This can play havoc when filtered, amplified, and transmitted.
Spurious emissions can interfere with other services as well as provide a distinctive signature if they are specific to a particular transmitter design.
Challenges of Production Testing
Production testing requires verification that each unit meets its specifications. Tasks include tuning and calibrating assemblies, as well as compensating and calibrating of analog modules, linearizers, and amplifier components. Results must be accurate and repeatable to assure that the final product will function as intended. As component and subsystem vendors make changes to their processes, continued verification of performance is required without varying the tests throughout the production life.
Automated testing reduces the chance for operator error which is a drawback of manually operated and interpreted testing equipment. Reproducibility of test results can be maintained regardless of production personnel changes, and training requirements can be significantly reduced.
Signal Monitoring
Signal monitoring is a somewhat different challenge. There is less need to verify a specification, but more to identify signals which may be present in a local area, or may show themselves only very rarely. This type of interference can jam or reduce the effectiveness of the radar. When searching for pulsed or interfering signals, an automated continuously searching analyzer must not blink just when the signal appears. Discovering, triggering, and capturing infrequent signals or transient characteristics of signals are required before analysis can be performed.
Interference may be manifested not only as an infrequent problem, but may be an issue of multiple signals sharing a frequency, either intentionally or unintentionally. Discovering such overlapping signals can be very difficult using traditional equipment.
Basic RF Pulsed Radar Signals
A simple pulse can be a single frequency that is turned on for a short time and then off again. The signal travels from the transmit antenna, reflects off of the target and returns to the radar. The time that it takes for this pulse to return represents the range, or distance to the target.
An oscilloscope can show the time domain voltage waveform of the transmitted pulse. This includes all individual cycles of the RF pulse as in Figure 2.

An RF detector can be used to create a trace of the envelope of the pulse, instead of all the individual cycles. This makes triggering much easier. A Vector Signal Analyzer (VSA), or a spectrum analyzer in zero-span, will display amplitude vs. time. This is the equivalent of using an RF detector. The lower trace in Figure 3 is a spectrum analyzer detected trace of one of the same RF pulses seen in the voltage waveform of Figure 2.

A spectrum analyzer can also show the frequency spectrum of the pulse. The "Sine X over X" classic pulse spectrum plot is seen in the upper trace. A VSA can use a Fast Fourier Transform (FFT), or other Discrete-Time Frequency Transformation, to make such a spectrum plot of a single pulse. A swept spectrum analyzer must either be in a "maximum trace hold" mode, or it must sweep slowly enough that at least one pulse appears at each position across the screen to provide a compete spectrum view. Without additional frequency processing software, the oscilloscope provides only the voltage waveform.

Compressed Pulse signal types and purposes
Basic pulsed radar using time-of-flight to measure target range has limitations. For a given pulse width, the range resolution is limited to the distance over which the pulse travels during the time of its duration. When multiple targets are at nearly equal distance from the radar, the return from the further target will overlap the return from the first target. In this situation the two targets can no longer be resolved from each other utilizing simple pulses.
Consider the range equation:

Where Pr is the received power. Pt is the transmitted power, Gt is the gain of the transmit antenna, Ar is the area of the receive antenna (its gain), Rt is the range from the transmitter antenna to the target, Rr is the range from the target to the receive antenna, and is the reflectivity (Radar Cross Section) of the target.
Using a short pulse width is one way to improve distance resolution. However, shorter pulses contain proportionately less energy, preventing reception at greater range due to normal propagation loss through the air. Increasing the transmit power may be impractical in an aircraft due to power limitations.
The answer is what is called "Pulse Compression". If a pulse can be effectively compressed in time, then the returns will no longer overlap.
Compression is achieved by modulating the pulse in the transmitter so that the various parts of the pulse become unique to each other. Then the actual time compression is accomplished within the radar receiver.
Linear FM Chirps
The simplest concept for modulation that allows pulse compression is a linear FM chirp. This is also one of the most common types of compression. Sweeping the carrier frequency throughout a pulse means that every part of a pulse is uniquely different from every other part since the carrier frequency is different.
In the receiver one compression technique is to process the pulse using a delay that changes with frequency. Such a delay mechanism would have an amount of delay at the chirp start frequency that is equal to the delay at the stop frequency plus an additional time equal to the length of the pulse. Now when the pulse passes through the receiver processor the chirp will transform from a frequency chirp pulse to a narrow pulse containing all the frequencies overlapped. The width of the resultant pulse is dependent on the frequency resolution of the receiver processor. There will be additional time-smearing and ringing due to non-linearities in the transmitted pulse.
Additionally, if the pulse entering the receiver is a target return, there will likely be multiple close reflections due to different surfaces of the target. If the compression processor has sufficient resolution, it can also separate these reflections each into its own narrow pulse.
Frequency Hopping
Another modulation method is to have several frequency hops within a pulse. If each different frequency has a corresponding filter with the appropriate delay in the receiver, then all segments can be compressed together into one segment length in the receiver. If the frequency hopping sequence remains the same for all pulses, then the receiver could even be implemented with a simple Surface Acoustic Wave, SAW, filter for a compression processor.
One form of frequency hopped coding is Costas coding. This is a coding which intentionally reduces the sidelobes in the Periodic Auto-correlation Function and has advantageous performance in the presence of Doppler.
Another use for hopping pulses would be to use a variable frequency pattern to reduce susceptance to spoofing and jamming, or to reduce interference between transmitters in close proximity.
Phase Modulation
Phase modulation can be used in segments of the pulse in the same fashion as frequency hopping. There are specific phase coding schemes, such as Barker Codes, that ensure orthogonality of the coding while providing excellent range resolution.
Digital Modulation
Given that the advancements of software defined radio can be applied to radar, more complex modulations can also be used. Much more effective anti-spoofing can be accomplished using M-ary PSK or QAM modulations. These produce pulses that resemble noise as opposed to coherent frequencies. Other information can also be encoded into such modulations.
Radar Pulse Creation
Transmitter Tests
Modern radars often generate pulses at an Intermediate Frequency (IF) where the processing is easier and then convert that frequency to the final operating frequency before amplifying it to the necessary high power. When testing an up-converter from the IF system, or testing the power amplifier, a radar pulse generator is needed as well as the pulse analyzer.
There are several solutions for generation of radar pulses. Arbitrary Function Generators, Arbitrary Waveform Generators, and software to create the necessary pulses can generate baseband, IF, RF, or microwave signals using direct synthesis up to 9.6 GHz. Test waveforms can be imported into the generators, synthesized, or replayed. Signal generation is often required in the selection and verification of analog transmitter components to test the margin of design and manufacturing processes.
Receiver Tests
Testing the receiver portion of a radar system when the companion transmitter is not yet available requires pulse generation equipment.
But verification of receiver performance under varying signal conditions may not be possible using the companion transmitter. This requires a generator with the capability to add impairments and distortions to generated pulses. This will verify the limits of receiver functionality. A generator of waveforms with arbitrary variation of any part of a digitally created waveform fills this need. Common impairments are in-channel and out-of-channel signals and noise to test desensitization or blocking.
Chapter II. Pulse Generation – Baseband and RF Modulated Pulses
Overview
Traditional RF signal generators may include an internal pulsed amplitude modulator, or even a limited bandwidth phase modulator. This class of generator starts with a narrowband CW signal and adds the modulation to the carrier. For wideband radar testing a fundamentally wideband signal source is needed.
The Arbitrary Function Generator and the Arbitrary Waveform Generator are fundamentally wideband generators. They include a Digital to Analog Converter (DAC) and a digital memory which can provide sequences of data to the DAC. These data can create arbitrarily any analog waveform. Such waveforms can have arbitrary variations sample to sample. Radar pulses with any modulation can be created with bandwidths from DC to the upper frequency limit of the generator.
There are many different varieties of Arbitrary Function and Waveform Generators that meet a wide range of needs. With clock rates up to 24 GS/s and output frequencies up to 9.6 GHz, complex radar signals can be generated as Baseband or Intermediate Frequency (IF) signals. For the lower radar frequencies, even fully modulated RF signals can be directly generated.
Some models also have digital data outputs in addition to the analog signals. Figure 5 shows how the AWG Series can provide signals to insert at any point in the radar chain to verify performance or to simulate a complete range of signal conditions.


Baseband Pulse Generation
The AFG3000 Series of Arbitrary Function Generators has an internal baseband pulse generator. The user only has to enter the parameters of the pulse and the graphic display shows a representation of the pulse on the generator screen. This works the same as having a baseband pulse generator with knobs for the settings.
Pulses as narrow as 4 ns can be created using the AFG3000 Series of instruments.

Pulse Modulated RF
For most applications it is more useful to generate modulated pulses directly from a single instrument without the need for a separate RF generator and modulation generator. Tektronix Arbitrary Waveform Generators have large waveform memories and the ability to sequence many separate waveforms in memory in an arbitrary order to create time-varying complex signals.
RF Pulses Directly from an Arbitrary Waveform Generator
The AWG Series has many built-in waveform samples that can be selected for programmable duration and frequency as in Figure 8. These can be entered into the Waveform Sequencer along with user-defined waveforms. An output sequence can be programmed with each waveform set to repeat its user-specified number of times, and the entire sequence can repeat as well.

The ability to enter user-defined sequences of voltage samples that are sent directly to the D/A converter from memory can make pulse waveforms with wider bandwidth than the pulse waveforms that are possible to create with traditional analog generators.
Synthesizing Signals Directly in the AWG Series with RFXpress®
RFXpress® software delivers advanced capabilities for direct synthesis and generation of radar signals.
RFXpress can be installed directly on the AWG5000 or AWG7000 Series, or it can be installed on a separate PC. The user enters into the software a simple description of the desired RF signal and RFXpress will compile the necessary waveform file. If installed on the AWG Series, RFXpress can communicate directly with the AWG internal software and load the resultant waveform into the instrument. RFXpress makes use of the waveform sequencing ability of the instrument to create longer length waveforms.
The Carrier Parameters
Once RFXpress has been started and then the option RDR is selected, the first step is to set the carrier frequency and the peak amplitude. Figure 9 shows the Carrier Tab where these parameters are set. Another parameter which may be significant is the Coherent Carrier setting. This sets the possibility of restarting the carrier phase with each pulse regardless of pulse timing, or maintaining pulse-to-pulse carrier phase even with asynchronous pulse-to-carrier phase relationships.

Adding Impairments
After defining the carrier there are I/Q impairments which can be added to simulate errors in the transmitter modulator. The impairments available include Carrier Leakage (separately for I and Q modulators); Quadrature error and I/Q imbalance
Figure 10 shows the I/Q impairments tab. Each type of impairment has a check box to disable it if desired. In the lower right of the tab is a graphic which shows visually the type of impairments as they are added to the signal. It shows how they are added to the I and Q signals.

Adding Interference
There is also the ability to add interference to the generated signal. Two types of interfering signals are available.
The first interference allows the addition of a second signal waveform that can be as complex as desired. This signal can be added as separate I and Q waveforms, or as an IF signal waveform. This waveform can be a file that was generated by any of the same methods as the pulse waveforms discussed here.
The second interference allows for adding noise with a desired Signal-to-Noise ratio, S/N, and bandwidth defined with respect to the sampling rate. This allows testing of receiver behavior for different S/N conditions.
Interference can be added on the transmit channel or out-ofchannel. Out-of-channel interference can test the receiver performance for blocking or selectivity.
Pulse Envelope Parameters
The Pulse envelope tab has entries for all the normal pulse shape parameters: The basic shape of the pulse (such as raised cosine, exponential, rectangular, and several others including a userdefined shape file), width, rise and fall times, and pulse OFF time.

As the parameters are entered the graphic display in the upper right shows the selected shape much as an oscilloscope trace would.
There can be a train of pulses generated, with independently programmed parameters for each one including timing, modulation and timing impairments. Each pulse can be repeated as desired before moving to the next pulse.
For each pulse having a repeat number more than "1", there are two other tabs controlling the manner in which the repeating can be accomplished. One is the Hopping tab. Here a separate frequency offset and amplitude offset can be entered for each pulse within the repeat value for this pulse definition. Hopping can greatly diminish the effect of a jammer, which can often not detect and switch its transmitter frequency fast enough.
The Staggered PRI Tab
Staggering the pulse repetition rate in a controlled fashion is used in MTI (Moving Target Indicator) radar to resolve Doppler and range ambiguity. If the target is far enough away that the return pulse gets back to the antenna after the next transmit pulse has left, the receiver will be unable to know which transmitted pulse caused this return. If the PRI is staggered, the receiver has some closespaced pulses and some further spaced ones to work with. Now, the return can be separated by comparing both the return time and Doppler shift of multiple returns.
Figure 12 is the Staggered PRI tab, which allows entry of a linear ramp for the control of the PRI for this set of pulse, or a userdefined sequence of PRI changes.

Adding Timing Impairments
In addition to the pulse definition itself and the modulation parameters, there are other additions to the signal available. Figure 13 is the Pulse tab with Pulse Impairments selected for entry.

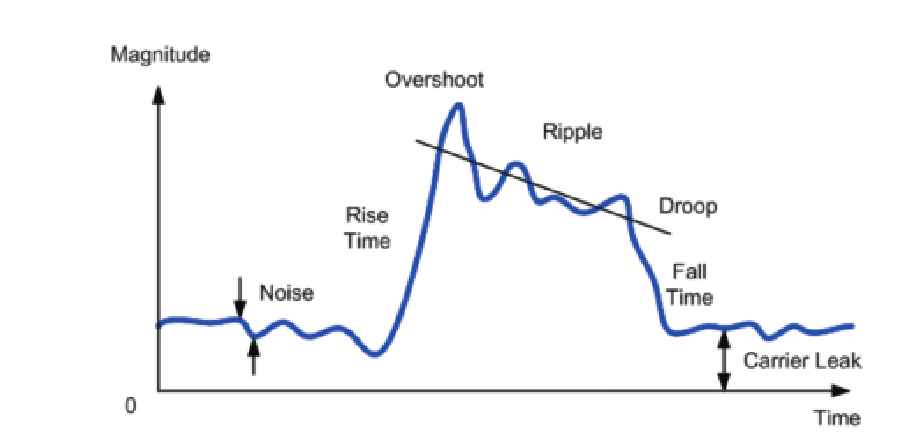
Each pulse in the train can be programmed separately for the real timing errors that radars have to deal with. Amplitude droop and overshoot at the transition can be added. A ripple on the top (ringing) can be programmed not only for amplitude, but the frequency of the ripple can be set as well.
The pulse display also shows these added pulse errors as they are added, as the pronounced 15% overshoot seen here.
Complex Modulations within the Pulse
Within the user entries for modulation in the RFXpress option RDR, there is a selection for User Defined Codes. Here the coding for the modulation can be customized.

In this case the phase segments in the entries are set for a Frank Coded phase modulation. Frank codes use multiple phase segments that can have many phase values.
In addition to the user-defined modulation selection, there are many standard modulation types which can each be programmed as the separate types require. The modulation types include:
- Linear FM
- Non-linear FM (with user entered equation coefficients for the non-linear curve)
- Equal-Stepped FM
- User Defined Stepped FM
- Bi-Phase
- Poly-Phase
A Custom modulation is available which accepts a user-defined file containing the phase profile of the desired modulation.
For each of the different modulation types the graphic on the right side changes to represent how the entry parameters affect the modulation.
Graphing the Results
RFXpress will compile all of the parameters and produce the waveform file for use in an AWG. The user can also call up plots of the waveform that give a preview of what a spectrum analyzer or oscilloscope would show. This Preview window is shown in Figure 15, with an I/Q plot, a spectrum plot and a spectrogram (many spectra taken during the pulse time).

Creating MATLAB® Signals and Importing into the AWG Series
The most versatile waveform creation method is to use MATLAB® to mathematically generate the waveform for virtually any signal that can be envisioned. It requires learning the programming language elements, but is extremely flexible.

For the AWG4000, AWG5000 and AWG70000 Series, MATLAB code may be written to create a text file with the sequential values of the samples needed to synthesize the desired waveform. For pulses it may save quite a bit of memory to make the pulse as one file and then to make an additional file of all zeros. Then use the waveform sequencer in the AWG to output the pulse and then as many of the zero waveforms as necessary to make the correct overall duty cycle. A list of different pulses can also be sequenced in the AWG memory. Once the complete list of pulse waveforms has been put together in the AWG, the entire sequence can then be written back out as a single ".awg" file for future use.
Checking the Phase Modulation
To verify the Frank Coded pulse that was created using an AWG, the signal is analyzed with a real-time spectrum analyzer (RTSA). The Pulse measurement of Phase Deviation clearly shows the many steps of phase and also shows the differing step sizes.
The markers read out the individual phase steps, and the blue lines show the peak-to-peak maximum total phase deviation within this single pulse. This phase deviation is also numerically read out in the left-side readout at 991.9 degrees.
If the pulses have different modulation sequences, one from the other, then each pulse can be selected for display and measurement here. This readout is for Pulse number 1 in the digital acquisition.
Chapter III. Pulse Measurements Methods
Overview
The traditional measurements of a pulse are timing. The width and period are the most basic, and convert to repetition rate and duty cycle. Pulse shaping may be used to contain the transmitted spectrum. Pulse shape includes the rise time, fall time, and aberrations. The aberrations include overshoot, undershoot, ringing, and droop. A challenge is to measure the transient splatter and spectral re-growth if the pulse shaping is not correct.
Timing variations from one pulse to another is the next more advanced timing measurement. These may be intentional variations or unintentional ones which may degrade system functionality.
Radar signals, however, may contain modulation within a pulse. Such modulations can be simple or very complex. There are several ways to measure different modulations within a pulse.
- Amplitude-versus Time
- Phase-versus Time
- Frequency-versus Time
- General Purpose Modulation Measurements, such as BPSK, QPSK, QAM, etc.
- Chirp measurements
Amplitude, Phase, and Frequency versus Time are all single parameter measurements. They operate on a sample-by sample basis. The amplitude measurement plots the magnitude envelope detection. Here the magnitude is calculated for each sample by squaring both In-phase (I) and Quadrature (Q) values for each sample, summing them and then taking the square root of the sum.
Amplitude-vs-Time
In the right pane of Figure 17 is the Frequency versus Time plot of a pulse that is modulated by a seven-step random frequency hop. The left half is the Amplitude versus Time plot for this pulse. The scale of the amplitude plot has been expanded to 0.5 dB per division to provide a detailed examination of the differing amplitudes of the separate frequency hops within this pulse.

The markers are correlated across all the displays. This shows that the higher amplitude segments also are the lower frequency ones. And the lower amplitude ones are higher in frequency. This radar transmitter has an amplitude roll-off, or decrease with increasing frequency.
Because the pulses are moving randomly across the transmitter slope, the amplitude changes show up more dramatically than if it had been a linear chirp. The correlated markers provide analysis of the cause.
This transmitter frequency response error can cause the receiver to incorrectly determine target attributes. These amplitude variations can also eventually suggest the frequency-hopping nature of the transmitter even to simple amplitude-only analyzers.
Phase-vs-Time
Since the digital samples of the signal contain both In-phase (I) and Quadrature (Q) values, the phase at each individual sample can be calculated. The phase is the arctangent of Q / I. for the simple phase versus time plot, the phase reference is the beginning of the acquisition record. Using this reference the phase is plotted versus sample number (expressed in time).
In Figure 18 the left side shows the frequency versus time plot and the right side is the phase versus time plot for the same acquisition. The signal is a single pulse with Barker coded phase modulation. The phase plot shows seven phase segments within the pulse. Note that for this particular code, the phase values remain the same between segments two and three, and again between segments six and seven, giving the appearance that two of the segments are twice as wide as the others.

The frequency plot shows very large frequency glitches because the phase modulation has two problems. The first is that the segments inherently are not phase-continuous. This has no impact on the phase plot, but causes a large instantaneous frequency modulation at the instant of phase change. Such a discontinuity is a very short-term wide band spectrum "splatter" which may exceed the allowable spectrum mask for a very short time, may cause interference to equipment operating on nearby frequencies, oreven create a recognizable "signature" for this particular radar.
The second issue is that there is apparently little or no bandwidth limiting filter on this transmitter. This exacerbates these same phase discontinuities. If this were filtered, the frequency plot would be flat.
For the phase versus time plot it is important to realize that since the phase reference is the beginning of the acquisition record, if the record starts within a pulse (triggered) then the phase may be similar from one acquisition to another. But if the beginning of the record is random, then the phase reference point is in the inter-pulse noise. This will result in a large random variation in the phase reference from one acquisition to another.
Frequency-vs-Time
The Frequency versus Time display can measure the frequency of any single incoming signal including pulses. Like any FM detector, it will measure the combination of all signals within its detection bandwidth, so the capture bandwidth of the instrument must be set, or other means must be employed, so that any signals other than the desired one are excluded. This is also true of the Phase versus Time plot.
Frequency is very simply the change in phase over time. In one cycle per second there are 360 degrees of phase rotation in that one second. The frequency at any two samples is measured by first measuring the phase at each sample (see above) and then dividing the phase change between two adjacent samples by the time between these same samples as "f = ∆ Ø / ∆t" from the IQ sample pairs. A plot of the frequency change from one sample to the next is in Figure 19. The horizontal axis is then re-stated in time for the user's convenience.
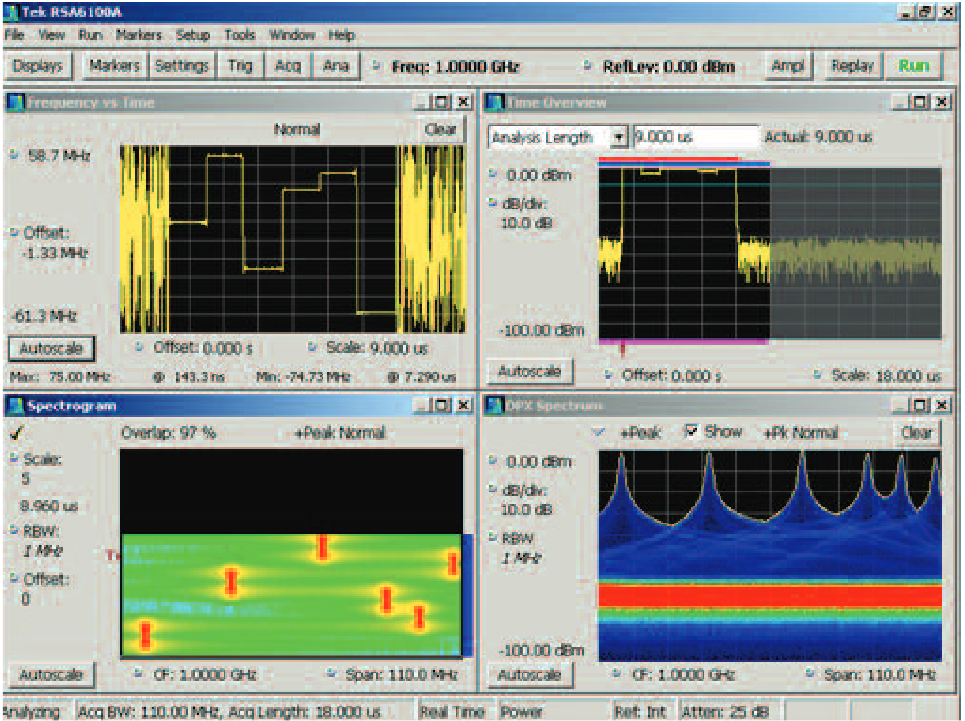
It is important to note that since this is simply phase change versus time, no reference is needed (other than the main instrument time base) and the frequency plot is in absolute frequency.
Modulation Measurement
Analysis of digitally modulated signals is more complex. The desired plot includes the amplitude, the phase, or both plotted against the transmitted "symbols" (the data words transmitted). This requires entering the modulation type, symbol rate and the measurement & reference filter parameters as in Figure 20. There are many other settings providing more flexibility of demodulation.

This measurement can display constellation, error plots, signal quality and a demodulated symbol table. Figure 21 shows a constellation display of a higher-order QAM pulse on the left and both signal quality and a spectrum plot on the right.
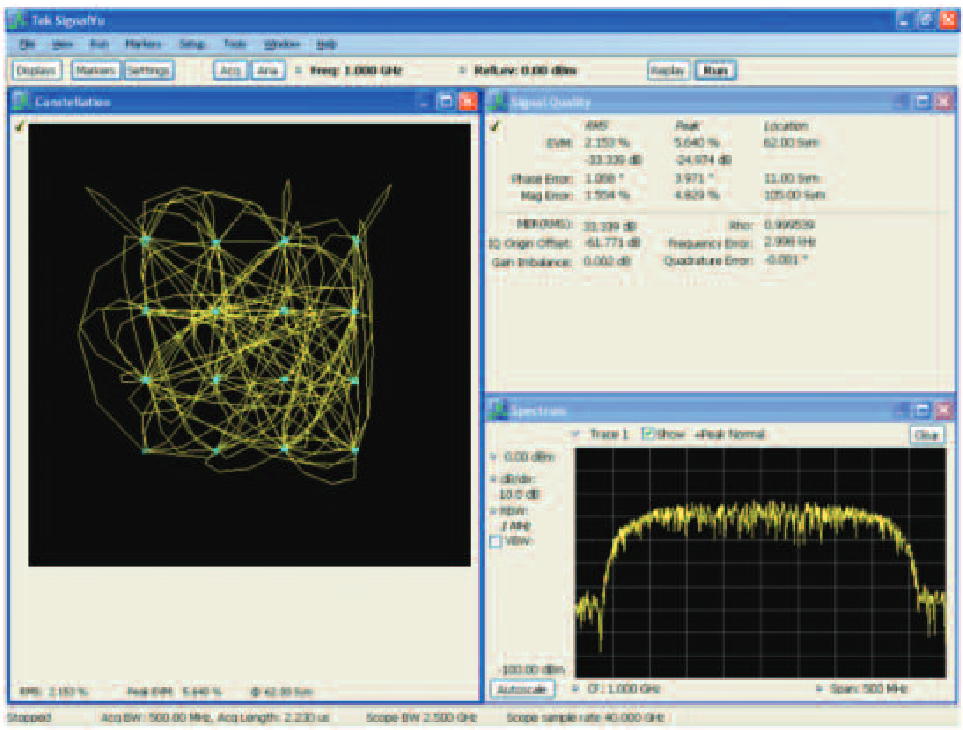
These demodulation measurements can be made on continuous ors pulsed signals. This is becoming more important for radar, as more complex modulations are being designed into new systems.
Automated RF Pulse Measurements
The following descriptions of pulse measurement techniques generally apply directly to both the RSA5000 and RSA6000 Series Option 20 spectrum analyzers and the MSO/DPO/DSA Series oscilloscopes with SignalVu™ vector signal analysis software. In the few cases where there are differences, these are explained as needed.
Short Frame Measurements – The Pulse Model
Measurements made of a single pulse (sometimes called Short Frame measurements) depend on the intended use of the pulse. The applied modulation will determine the needed measurements.
For simple single-frequency (CW) pulses the measurements may include power (or voltage), timing, shape, RF carrier frequency and RF Spectrum occupancy.
For modulated pulses, additional measurements are required. The accuracy of modulation contained within the pulse is needed. Parameters such as phase or frequency modulation, frequency extent of a chirp, and phase linearity of a chirp are crucial to the performance of the radar system. Modulation accuracy of digitally modulated pulses is also important.
Sampling the RF
All of the detection is based on examination of the decimated samples from the digitized record of the Intermediate Frequency, IF, within the analyzer. When the analyzer software is installed on an oscilloscope, the digitized record includes the entire effective bandwidth of the oscilloscope.
Choosing Measurement Parameters
There are several parameters that the user must set correctly before measurements are attempted. These affect the processing of pulsed signals, and are dependent on the character of the signal and on the desired interaction of the instrument with the incoming pulses.
Measurement Filter Type
The first parameter is the Measurement Filter type and bandwidth. All measurement devices are inherently bandwidth limited. MSO/DPO/DSA Series oscilloscopes can have a bandwidth as much as 33 GHz. This extends from DC to 33 GHz on the upper end. The RSA Series spectrum analyzers can have up to 110 MHz of bandwidth. This bandwidth limit results from the internal RF down conversion filtering. The signal is digitized at an Intermediate Frequency lower than most of the input signal range.
Once the signal is digitized (using either the spectrum analyzer or the oscilloscope) further digital processing can reduce and shape the measurement bandwidth if desired. Smaller bandwidth filters will reduce the noise within the measurement bandwidth and therefore reduce the uncertainty of some measured parameters. However, this is useful only in cases where the incoming pulse to be measured does not have spectral components wider than the filter in use (either fast rise/fall edges, or wide frequency/phase modulations). Rise time measurement uncertainty is increased with the use of narrow filters.
In any case, if a pulse signal passes through a band limiting filter, there will be some distortion that results. Any filter will add its own contribution to the pulse Rise Time. Any pulse with a sharp rise or fall time will have some spectral components widely spaced from the carrier. The more of these frequencies that are removed by a filter, the more distortion (overshoot and ringing) can be introduced to the pulse. The shapes of filters that remove undesired signals from a measurement have phase and amplitude variations that will introduce distortions even if the filter is wide enough to otherwise pass the pulse without problems.
One filter type that minimizes these induced artifacts is a "Gaussian Shaped Filter". Additional filter selections in the RSA Series include: No Filter Wide Open; No Filter; Gaussian, etc. The "No Filter Wide Open" uses the maximum possible acquisition bandwidth of the instrument. For the RSA Series these can be up to 110 MHz depending on the instrument model and option. For the MSO/DPO/DSA Series oscilloscopes, the maximum bandwidths of all of these filters are determined by a combination of sampling rate, bandwidth of the instrument on which the SignalVu software is installed, as well as the center frequency of the analysis. "No Filter" either sets the current decimated acquisition bandwidth to the closest power of two to the number the user enters into the "bandwidth" entry just underneath the filter definition in Figure 22, or it will decimate in software if the hardware is forced to a wider bandwidth by another active measurement. The "Gaussian" filter digitally implements a Gaussian-shaped filter which is about half the acquisition bandwidth. The user enters the "bandwidth" parameter and the instrument sets the appropriate acquisition bandwidth to accommodate the Gaussian filter.

The Gaussian filter type usually introduces 5% or less pulse distortion, and should be selected if overshoot or ringing of the pulse must be minimized. If the pulse is wideband enough that the widest Gaussian filter will be too narrow, then one of the "No Filter" options must be selected
When using the SignalVu vector signal analysis software on an oscilloscope, these filters have the full bandwidth available from the oscilloscope in use, and this changes the way the filter limits are implemented.
Detection Threshold and Minimum OFF Time
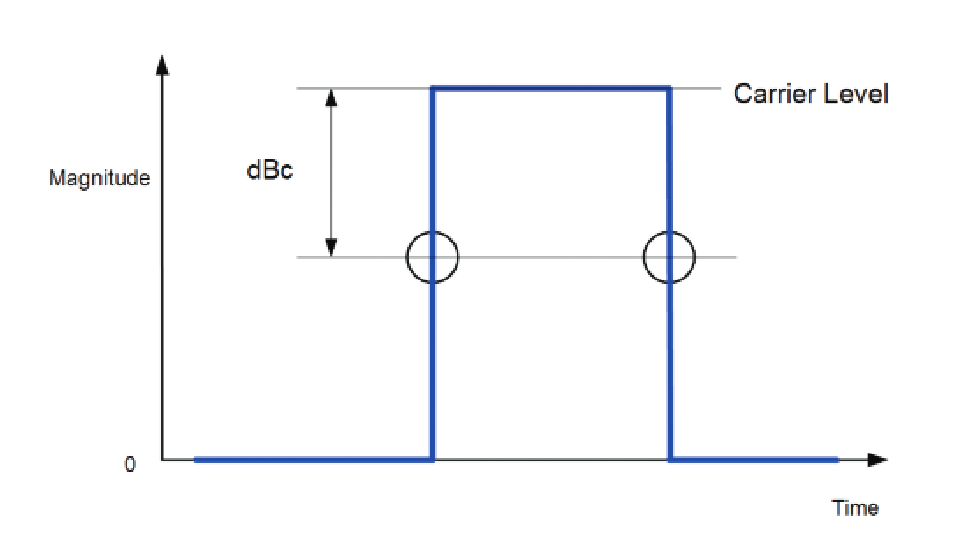
The measurement algorithm requires that pulses must exceed a set threshold amplitude. In some cases there may be variations in the noise floor and it is desired that the measurements not be attempted on these noises. In an off-the-air situation it may be desirable to only measure the highest amplitude pulses from a nearby transmitter. The threshold selection is entered in dBc (dB below the pulse top).
The measurement will search the acquired record and find the pulse top first. Then it will decide if any pulses exist that cross the user-entered threshold. The threshold value entry is seen in the top right of Figure 23.

Some pulses may not have a flat top. Some may actually have intentional amplitude variations across the top including a reduction in amplitude which is enough such that the pulse detector would find two separate pulses. If it is known that such a pulse shape will be measured, then a minimum OFF time can also be specified. The parameter entry for this is shown on the middle right of Figure 23. Here a time is entered greater than the amplitude dip, but smaller than the OFF time that will be found in between the pulses.
This allows for a pulse with an amplitude dip below the threshold, but of a duration shorter than the "Minimum OFF time" to be properly detected.
Maximum Number of Pulses to Measure
The automated measurement is capable of finding and measuring up to 10,000 pulses within an acquisition record. This allows for detailed statistics on the trends of pulse parameters. The processing of pulses starts after the acquisition record has been saved.
If the measurement does not need all of the available pulses, then entering a smaller number in the "Max Number of Pulses" in the lower right of Figure 24 will cause pulse processing to stop after either the max number of pulses or the end of the record is reached. This can vastly reduce the time needed to process the data and get the pulse measurement results. The check box must be checked to enable this limit.

Frequency Estimation Method
Many measurements require knowing the carrier frequency of the pulse. All of the frequency modulation and phase modulation measurements, and even some of the more sophisticated pulse finding algorithms, all require knowledge of the carrier frequency. There are two ways the instrument can know the carrier. One is for the user to enter it. This is entered in the "Freq Offset" box in Figure 25. The value to be entered is the difference between the current center frequency of the analyzer and the actual center frequency of the pulse. The "Auto" box must be unchecked for this to take effect.

If the RSA Series frequency reference is externally locked to the pulse source, and if the exact frequency of the pulse RF carrier is known, the manually entered method produces the best and fastest results.
When the "Auto" frequency reference offset is selected, the instrument will automatically estimate the pulse carrier frequency. There are three algorithms for this. One works if the carrier is constant frequency and the phase from pulse to pulse is "constant" as if the carrier is constant and the pulses are simply gating the carrier ON and OFF. The second is also constant frequency (CW) but allows for the condition where the phase from one pulse to another may vary. The third works if the pulse is a Linear FM Chirp. These are selected in the box on the left of Figure 25.
Measurement Point Definitions
Some measurements are made at user-definable points within a pulse. These require entry of the position of these points if the default values are not suitable.
Several measurements are made as the difference from each pulse to a reference pulse. These include Phase and Frequency differences. The point within the pulse at which this measurement is made is selectable in the Pulse Settings window on the Define tab as seen in Figure 26.

Other measurements have positions entered in this same tab. The measurement of Ripple across the pulse top usually excludes the leading and trailing portions of the top since this is where overshoot will be. The amount excluded is settable.
Also the measurement of phase and frequency flatness across the pulse top has selectable start and stop points that are referenced to the 50% points of the rise and fall of the pulse. Figure 26 shows the user selection of the definition of these 50% points as Voltage or Power levels on the pulse.
Droop Compensation and Rise/Fall Definitions
Rise time and fall time measurements have two different definitions. Many measurements use 10% to 90% of full amplitude as the definition of the transition time, but in some cases the definition is 20% to 80%. Both of these are selectable, seen in Figure 27. These points are defined as voltage points on the pulse waveform.
But even this much flexibility on definition is not quite enough. How one determines the top of a pulse can greatly affect the definition of transition time. If the top of the pulse is flat, then there is no problem. But if the top of the pulse is tilted, or has droop then there is a problem. If the pulse droops down, by 20% over the duration of the pulse and if the upper “transition point is 90% of the highest part of the top, then the “rise time will be correctly calculated. But the falltime will be quite incorrect as the "falling" 90% point will be somewhere in the middle of the pulse due to the droop.
There is a compensation selection for this. If Average is selected, then it will be correct for flat-top pulses. But to correct for droop, the user should select "Independent". With this selection (shown in Figure 27), a best-fit straight line is calculated for the pulse top, and this is used to determine the upper beginning and end points of the top of the pulse for purposes of transition time calculations.

50% Level Definitions
There are two standards available for the definition of the "50% point" of the pulse waveform. Baseband pulse measurements “generally assume that the beginning and end of a pulse is the 50% point of the voltage waveform. However, measurements made on RF modulated pulses sometimes assume that the 50% point is stated in RF power, not voltage.
The automated measurements allow for the selection of which of these definitions to use for the start point and stop point of pulses. These settings affect the measurements of width, period, frequency deviation & error, phase deviation & error, ripple, droop, ON power, and pulse-to-pulse phase & frequency.
Finding the Pulse
Before any parameters can be measured, an automated system must identify that a pulse exists and further locate some critical features of the pulse, from which the timing, amplitude and frequency measurements will be referenced.
Minimum Pulse Width for Detection
The algorithms used for finding pulses require at least seven samples between the rising and falling edges to be assured of good reliability of pulse detection. If there are fewer points, then the detector will be less reliable and the pulse measurement specifications will all degrade.
For the 40 MHz bandwidth digitizer, 7 samples is equivalent to 150 nSec. And for the 110 MHz digitizer it is 50 nSec. For a 20 GHz bandwidth oscilloscope it is roughly 140 picoseconds.
Using the Threshold Setting
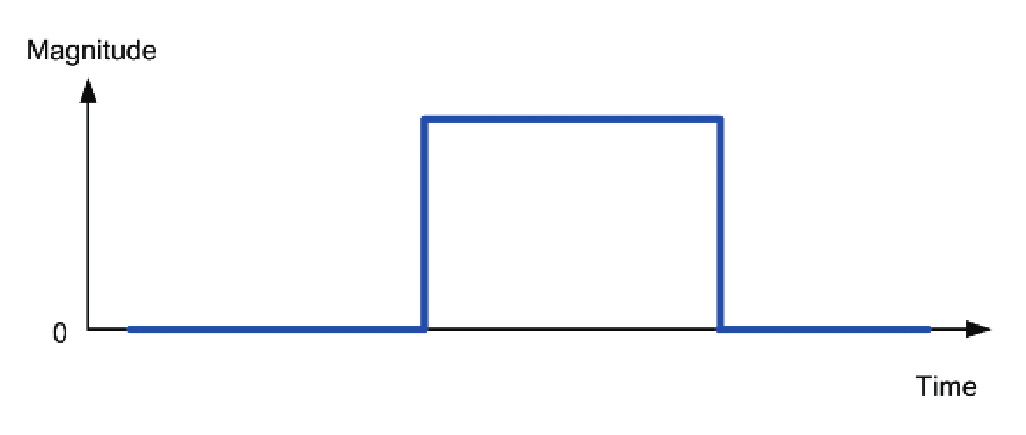
The user can enter an amplitude threshold for pulse detection. When measuring RF signals, Spectrum Analyzers and other RF receivers may have dynamic range exceeding 100 dB, which gives visibility of very low-level noise within the same display as high-power signals. The threshold setting prevents the detection algorithm from seeing the noise as pulses, as well as any overshoot, undershoot, and other pulse distortions that may be present. In the RSA Series, this threshold is specified in dB below the pulse-top carrier amplitude.
For a pulse to be detected there must be an increase in the digitized power level passing through the threshold level. Then there must also be a corresponding decrease in power level back through the threshold. Note that some parameters, particularly pulse period and transmitter power, require that there be at a second pulse before this parameter exists for the first one. These measurements require measuring the time from the beginning of one pulse to the beginning of the next pulse.
The actual detection of pulses is complicated by the extremes of some of the parameters and the variations of these parameters which are encountered in modern pulsed radars.
The duty cycle may be very small, which leaves the pulse detector looking at only noise for most of the pulse interval. The pulse timing may vary from pulse to pulse, or the frequency of each pulse may hop in an unpredictable sequence. Even the amplitude may vary between pulses.
Other difficulties arise if the pulses exhibit real-world characteristics such as ringing, droop, carrier leakage, unequal rise and fall times, or even amplitude variations such as a dip in the middle of a pulse.
And the greatest difficulty to overcome is poor signal-to-noise ratio. Particularly as the pulse width gets smaller, the rise time gets faster, or as a frequency chirp gets wider, the bandwidth of the measuring system must also get greater. As the bandwidth increases, the noise increases with it.
Due to the threshold itself being specified as dBc from the Pulse Amplitude, in order to set the actual detection level, the pulse amplitude must first be found. But without having first found the pulse, finding the pulse amplitude is a challenge.
Finding the Pulse Carrier Amplitude
The basic tradeoff in the pulse amplitude algorithm is between the reliability of the detection versus the speed of the algorithm. Even though the pulse measurements are an off-line process (they only operate on data already stored in memory) the user still wants the measurements to complete quickly.
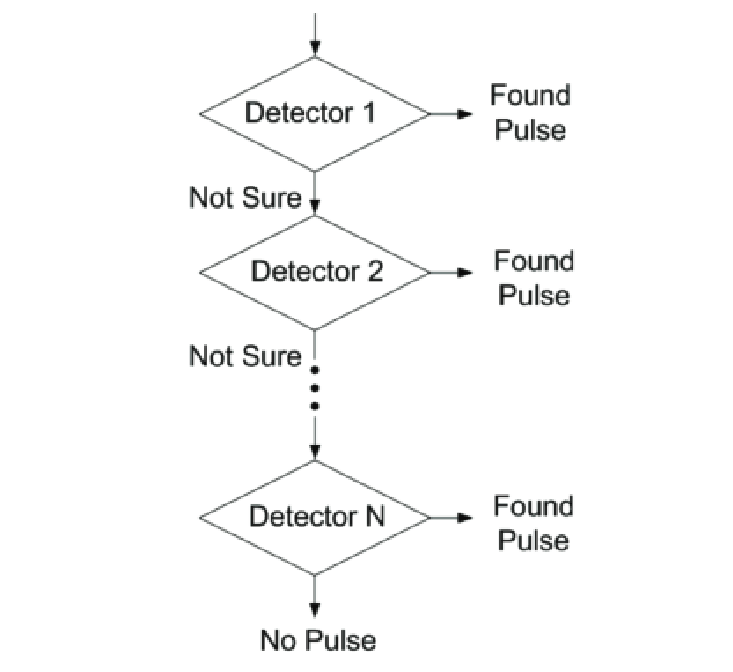
The method used in the advanced pulse analysis includes four separate pulse detection algorithms. Each of these algorithms is called within the DSP processor one at a time. They are called in order of the simplest and fastest first. Then the next detector with increasing complexity will be tried. This will continue, and if at any time a pulse is found, then the process ends. In this manner the finding of the pulse and its amplitude is completed in the least amount of time required.
The pulse Carrier Detection Algorithm reports "no Pulse Found" only if all four methods fail to find a pulse.
All of the carrier level detection algorithms use envelope detection. With this method, a simple CW pulse will be represented by a voltage waveform that represents the baseband pulse that modulated an RF carrier. The actual mechanism is to take the square root of the sum of the squares of the (I) and (Q) values at each digital sample of the IF signal.
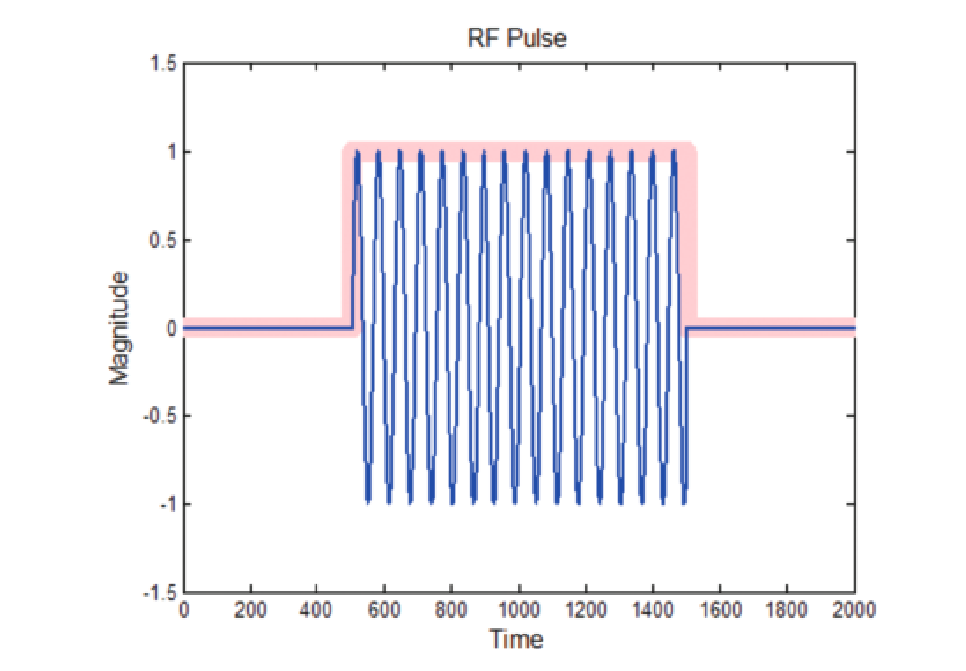
In Figure 33, the blue trace illustrates an RF pulse. There are 16 complete cycles of the RF contained in this pulse. The pink trace is the complex envelope of the pulse. The envelope is a baseband pulse, and is the signal upon which the first detection algorithms operate.
Note that Figures 33 through 49 are mathematical simulation plots demonstrating the measurement theory, and are not displays taken from an analyzer.
Method One: Magnitude Histogram
The simplest detection of the existence of a pulse is to generate a histogram of the magnitude values in an acquisition record. If the pulses are relatively clean and have good signal-to-noise ratio, then there should be a bi-modal histogram. The large grouping will be centered on the noise level present during the pulse OFF time and (if the duty cycle is less then 50%) the lesser grouping will be centered on the pulse-top level.
The magnitude histogram method works in most cases with relatively clean pulses. In the case of RF pulsed transmitter measurements the connection means is usually a coupler into the transmit transmission line or waveguide. This will provide enough RF power that the measurement has excellent signal-tonoise ratio suitable for this first method. The Magnitude Histogram as used in the advanced signal analysis software for RF pulses is also the method usually used in oscilloscope baseband pulse detection methods.
A pulse with only 15 dB signal-to-noise as seen in Figure 34 is easy enough to see, but the noise is enough to greatly obscure any detailed ringing or other artifacts within the pulse if there is no other filtering applied. The histogram plot in Figure 35 shows two very clear groupings. From this plot the amplitude of the pulse is much easier to calculate than from simple observations of the magnitude plot directly.
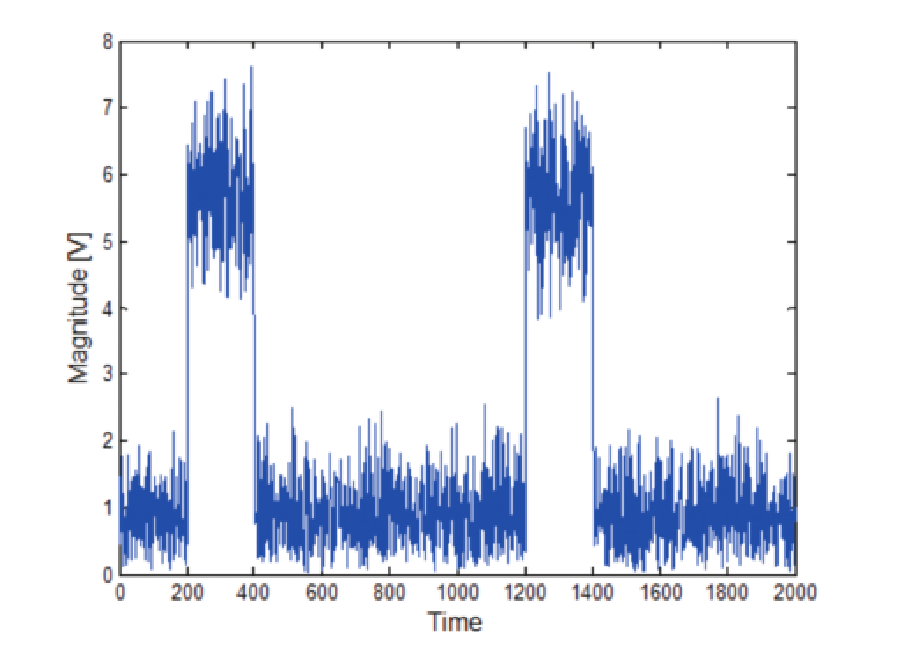
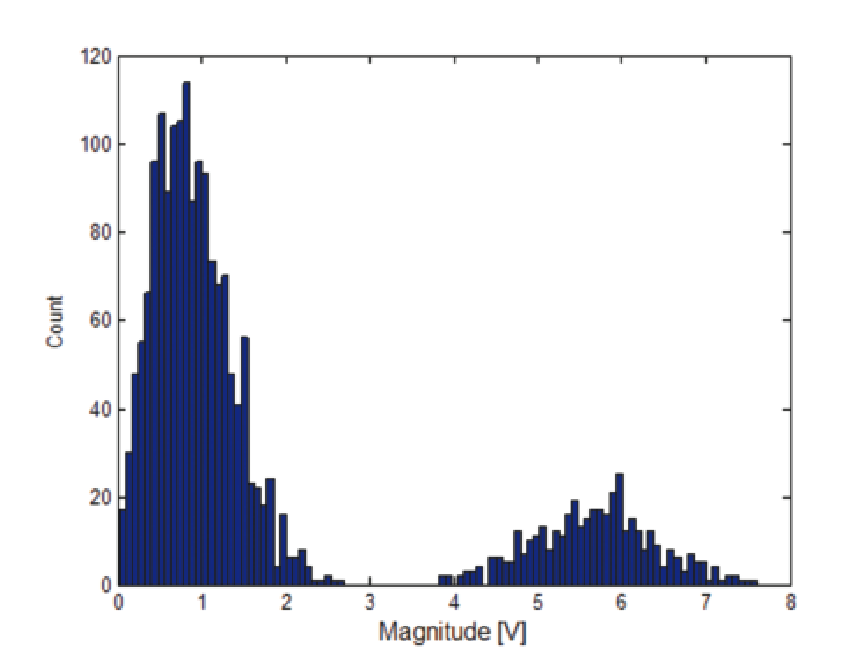
But if the signal-to-noise ratio degrades much more, this method will become less reliable. Figures 36 and 37 show these same two plots for a pulse where the S/N ratio has degraded to 8 dB.
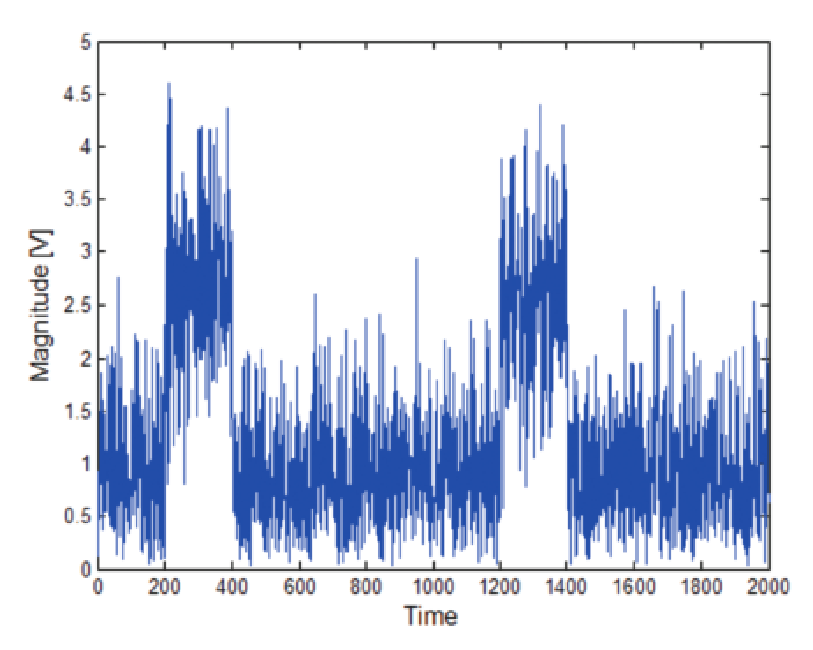
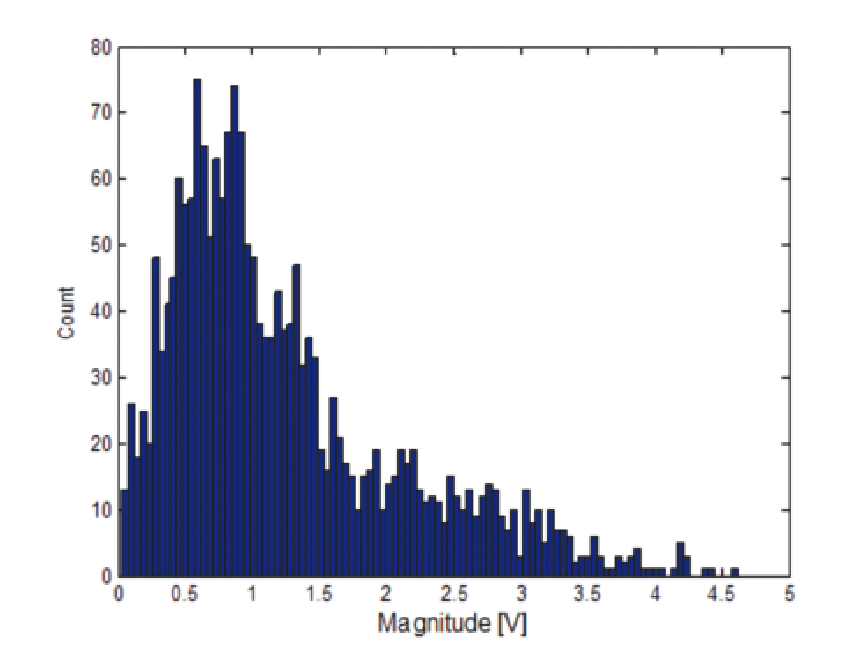
At 8 dB S/N there are no longer discernibly separate groupings. This shows one limitation of this detection method.
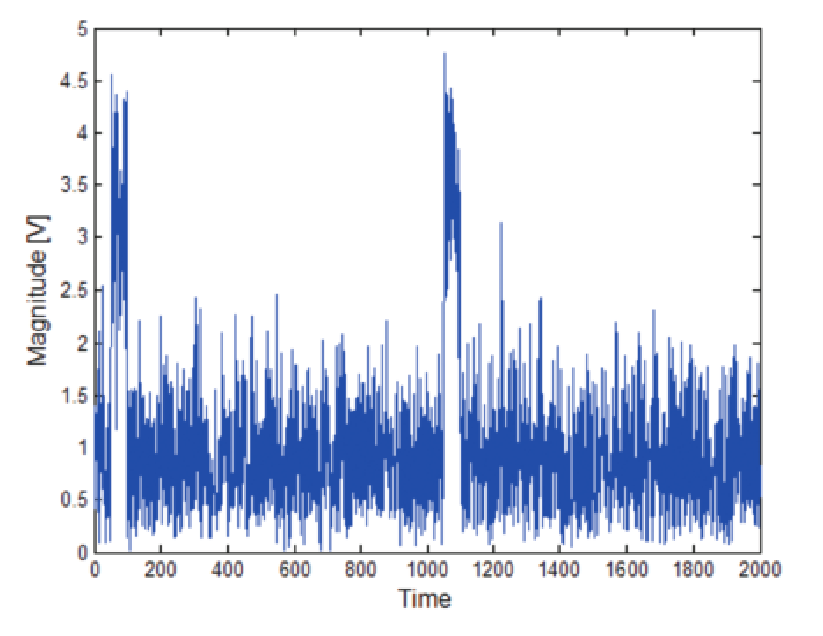
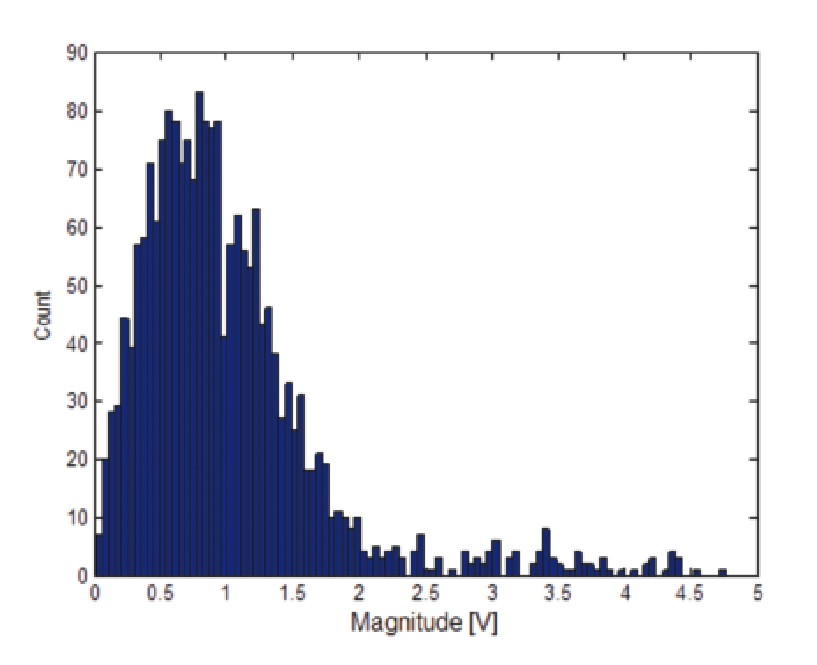
However, even with the better signal-to-noise signals there are other limitations to the Magnitude Histogram method. One problem is that as the pulse width becomes less, there are fewer samples within the shorter time of the pulse top. This inherently reduces the histogram hits at the amplitude values for the pulse top, and Figures 38 and 39 have the results. While simple observation of the magnitude still shows a very visible pulse, the histogram has all but vanished except the part at the noise level.
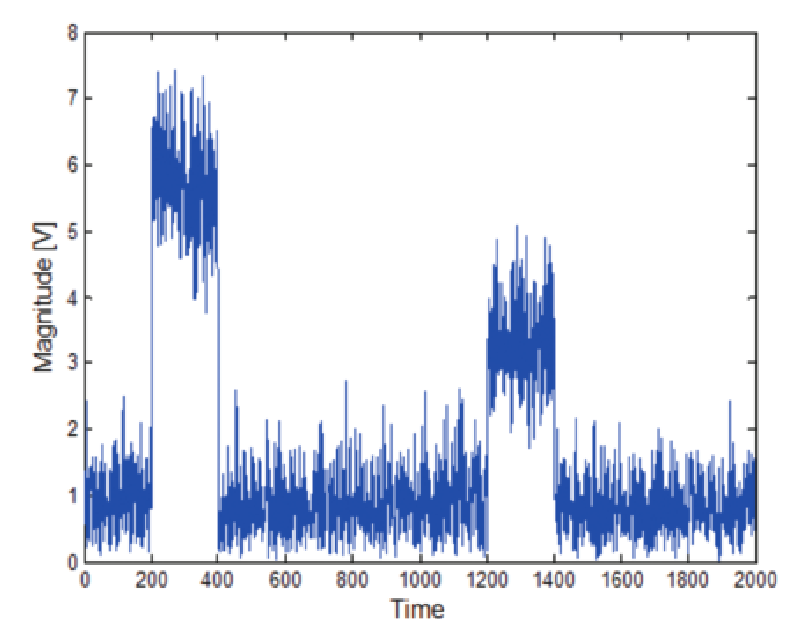
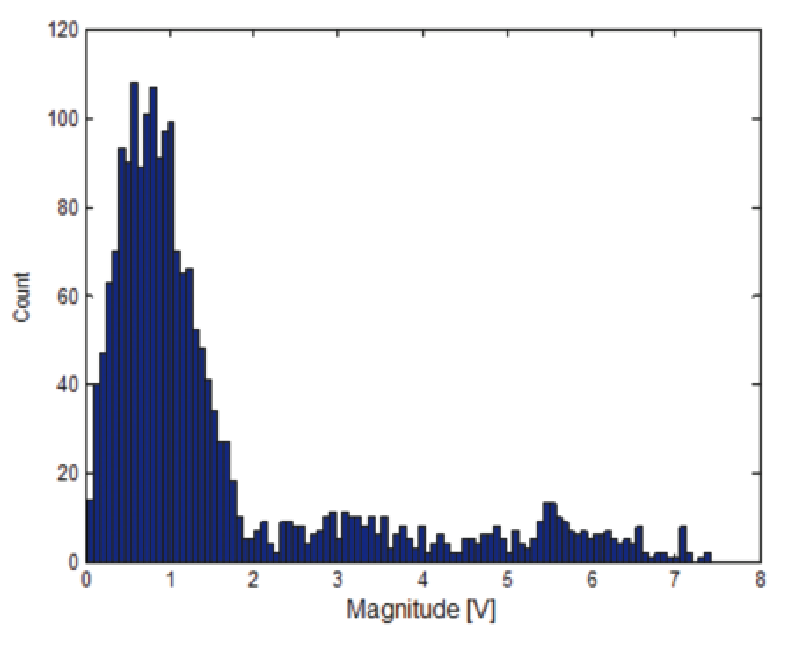
Another drawback to the Magnitude Histogram method is apparent if some pulses have differing amplitudes, the histogram loses clean groupings as they drop into the noise. The nature of a histogram requires that the underlying amplitude have only two states.
In figures 40 and 41 are the results for a pair of pulses with different pulse top levels. Even though the S/N is 15 dB here, the two top levels have spread out the histogram so badly that it is no longer discernable that any upper level grouping exists.
The Magnitude Histogram method works well for most cases, but for both lower S/N and particularly for narrow or infrequent pulses it is insufficient.
Method Two: Local Statistics
For the case where multiple pulse amplitudes are present, or the pulse has slow transition times, the histogram is spread out so that levels are no longer distinguishable. In this case, the second method will work much better. The Local Statistics method moves a sliding time window across the magnitude samples and the statistics are computed at each window position only for the samples within the window.
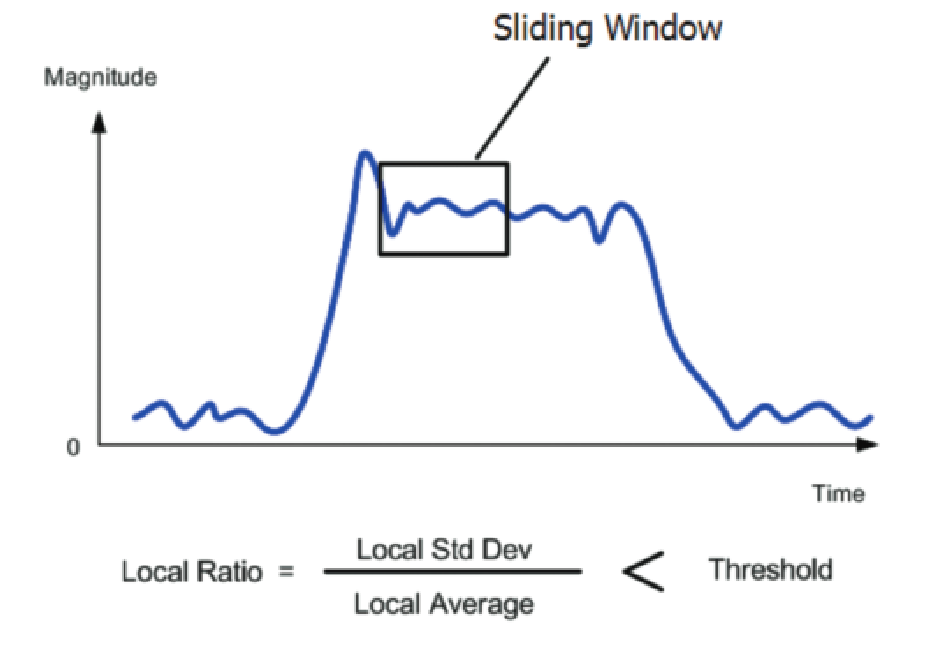
The "Local Area" is the set of samples (10 samples) within the window. If the additive noise is the same at the pulse top as it is at the lower noise floor, then the standard deviation will be similar at both amplitudes. But the average will be higher at the top level.

Calculating the ratio will provide a measure of the level which does not have a problem finding pulses with different levels. This is because unlike the histogram method which calculates over many pulses together, this calculation is individual for each small area of the digitized record.
This method is also useable for very short pulses. It only integrates over the ten samples contained within the window at any time. This allows detection of pulses as short as 20 samples or less. For RSA Series with 110 MHz bandwidth, this would be about 130 ns wide. When using the SignalVu vector signal analysis software on a 20 GHz MSO/DPO/DSA Series oscilloscope, this is a pulse about 400 picoseconds long.
The drawback to the Local Statistics method is that not only does it require increased processing power, but it also requires even better signal-to-noise ratio than does the histogram, about 30 dB. This is due to the fact that it averages over a smaller time window.
Method Three: Moving Average
The method used to find pulses in low signal-to-noise conditions is a moving average of the magnitude samples. Figure 43 shows the raw magnitude samples from a record including five pulses. The raw data is plotted in blue. The red trace overlapping the blue one is a plot of the moving average.
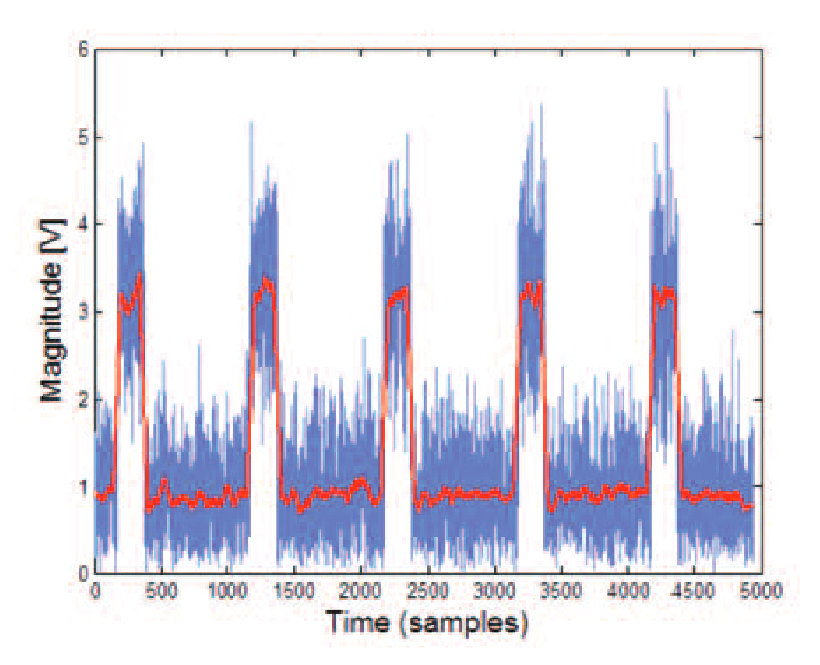
One reason for using this method is to improve the detection of pulses with poor signal-to-noise. To this end, the length of the moving window is selected to contain 60 samples. Since the data is averaged over this longer time record, this is a simple way to greatly improve the signal-to-noise ratio of the detection. However, since this does use a longer time window for the averaging, it has decreased ability to find short pulses (less than about 100 samples). They are simply averaged down into the noise.
This same longer averaging time has the advantage that it works well for pulses containing digital modulations such as QPSK or Direct Sequence spreading.
Noise Histogram (preparation for method four)
The last detection method is much more calculation-intensive than any of the preceding methods. Since it will likely take significantly more processing time than all of the other methods combined, it is prudent to take a very small time to detect the absence of any coherent signal before invoking the last method.
Note that all of the histograms so far presented that contain pulses have a distribution of amplitude that has variations in the curvature. While these may not be enough to detect the pulse itself, they do exist. Therefore, to rule out the existence of detectable pulses before this last method, one more histogram will be calculated. This one is normalized to its own mean value.
If the digitized record being analyzed has no coherent signals, or even any signals with mean that is even slightly different than that of the entire record, then the resultant histogram will be of pure noise. This histogram will have a Rayleigh distribution as seen in Figure 44. If such a distribution is found at this point, the algorithm can indeed terminate with a "No Pulse Found" result. If the result is not Rayleigh, the algorithm will proceed to the last detection method.
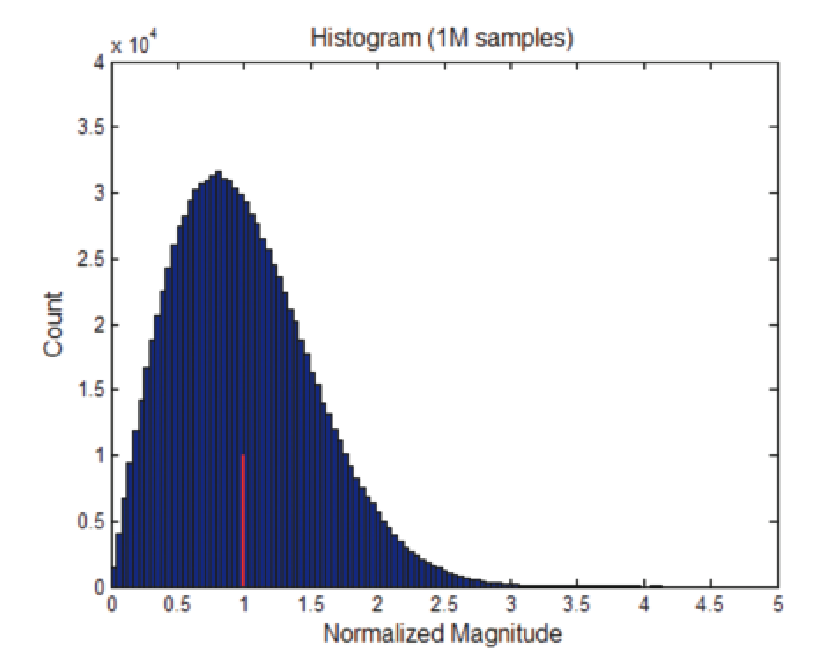
Even though the Noise Histogram is not by itself a method to discover a pulse, it does discover if there is a "lack of pulses" before proceeding to the most time-consuming method.
Method Four: Least Squares Carrier Fit
The Least Squares method was devised to improve the ability to find pulses which are narrower and at the same time have lower signal-to-noise ratios. This is a class of pulses which is not well covered by the other three methods, but as pulse bandwidths have increased and duty cycles also decreased this has become more important.
If the user can enter the basic modulation type (such as CW or a Linear FM Chirp), then the algorithm can use this knowledge to greatly increase the probability of detecting pulses with lower S/N.
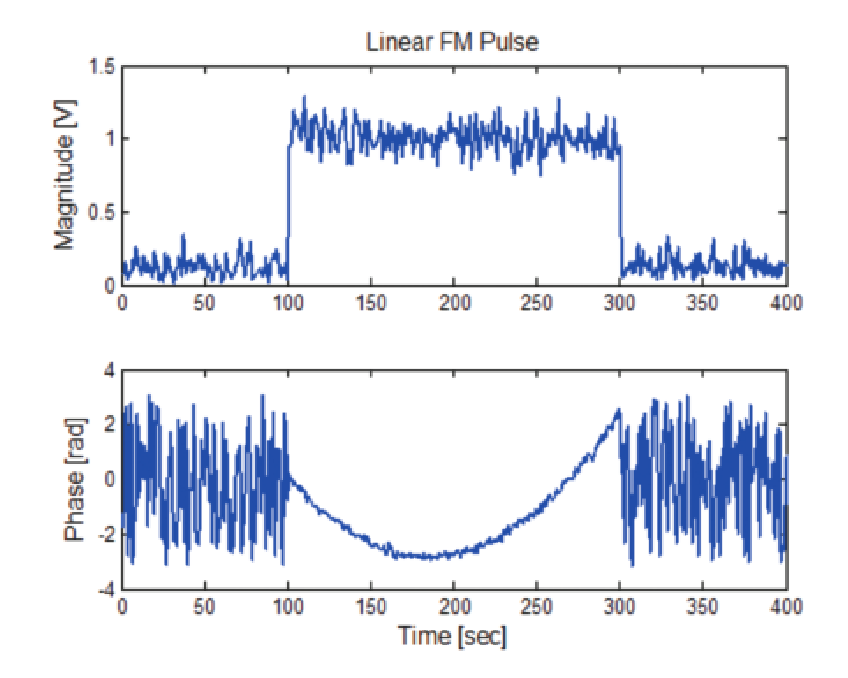
In Figure 45 the magnitude and phase of a pulse are plotted with constant carrier frequency. The phase is constantly changing in this plot, which demonstrates that even though the frequency is constant, it is somewhat different than the analysis center frequency. The measurement of phase is very sensitive and can easily show the character of a signal. Figure 46 shows the same plots made from a linear FM chirped pulse. Note the very distinctive characteristic parabolic shape to the phase plot. In this case there is also a center frequency offset, which can be seen in the unequal sides of the parabola.
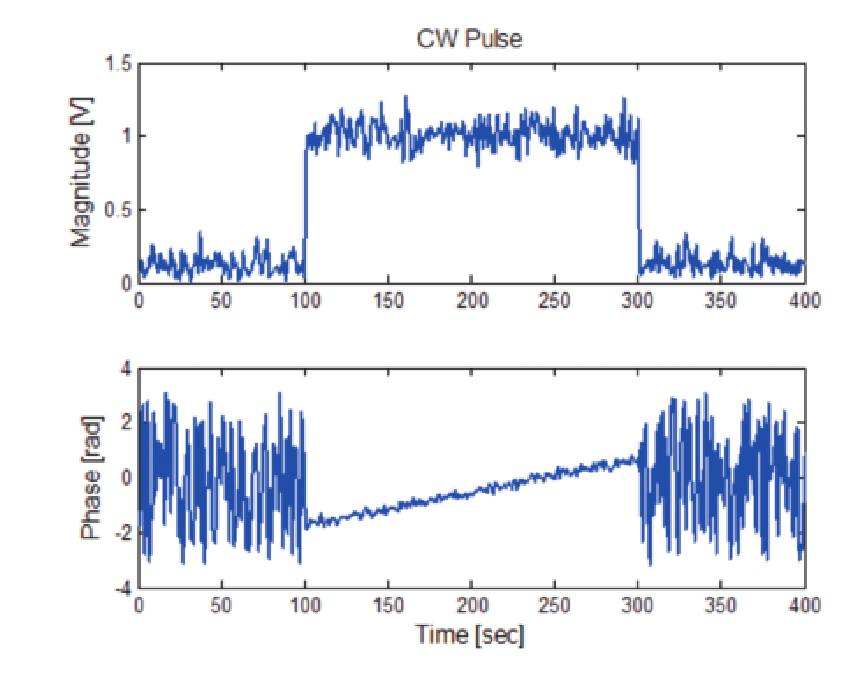
If it is known which of these characteristics the pulse is expected to have, then the detection can be accomplished as a measurement of how closely a portion of the digitized record correlates to the known phase function.
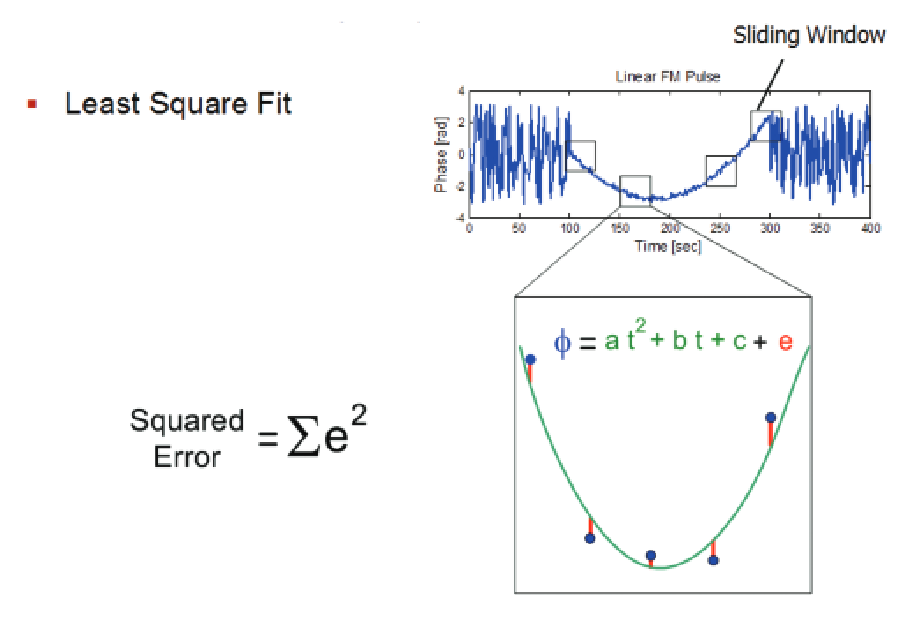
A small time-window is moved across the record and the algorithm re-calculates the fit at each position of the window. This is the same basic concept as correlation to find a particular pattern within a long record.
Looking at the case of a linear FM chirp, the window (six samples wide) is moved, and at each position a least squares fit is used to find the equation parameters to a quadratic equation (a parabolic curve) and then the errors are squared and then summed.
When the box is located inside the chirp pulse, the sum of the errors is less than when the box is outside the pulse. Outside the pulse there is just noise, and therefore the phase exhibits huge random variations. This difference in error result is used to determine that a pulse exists and generally where it is
The use of a very small time window (six samples) provides for detection of the narrowest pulses of any of the detection methods. At the same time, the need for finding pulses with poor signal-tonoise is met by the correlation process. This process does not average the samples, but finds the degree of correlation to the ideal phase curve. Narrow pulses are not integrated into the noise.
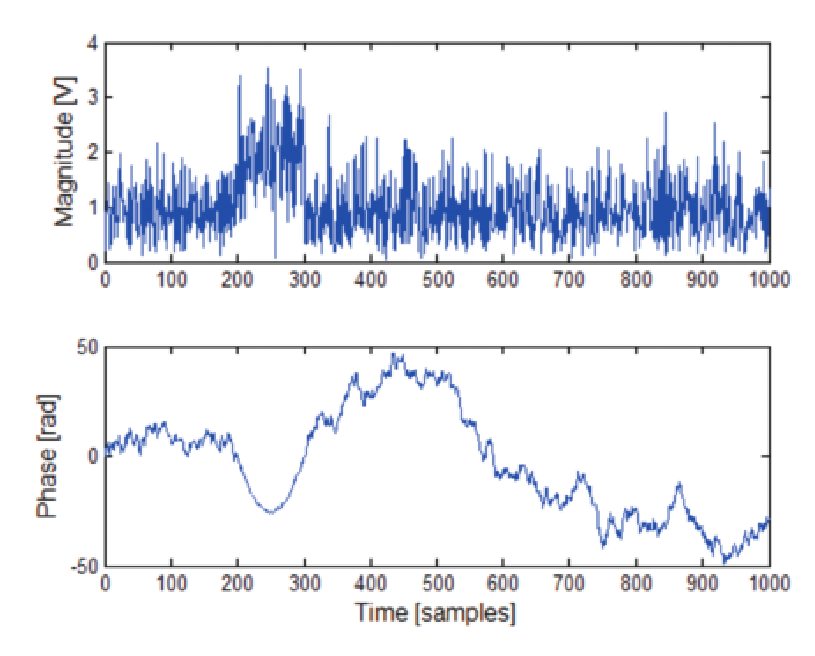
In Figure 48 the top trace is the magnitude plot of a pulse with only 8 dB S/N ratio. The noise can be seen to have a peak-to-average ratio that is at least as large as the average amplitude of the pulse itself. This makes simple amplitude detection of the pulse impossible. While it can be generally seen visually, detection by an automated routine needs greater processing power.
For the raw data record of the 8 dB S/N pulse, it is clear that no automatic pulse finding can be accomplished based on magnitude or phase. But in Figure 49, the plot of the squared phase error shows that the phase has a very well-defined low-error segment. This segment is where the pulse phase correlates to the ideal phase of a chirp.
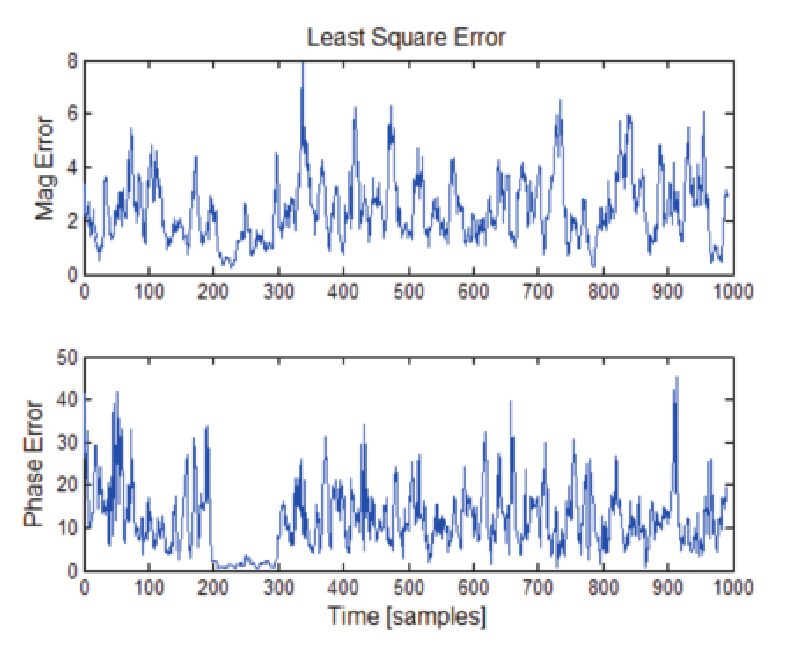
The same result is obtained for a CW pulse, with the phase being simply a straight-line instead of parabolic curve.
If the Least Squares Method does not find an acceptable result, then it is possible that no signal present is a pulse, or is sufficiently different from any of the models used for the algorithm that it can not be found.
Once the pulse has been found, the magnitude can be determined from the samples now known to be inside the pulse and the reference points (cardinal points) can next be located.
Locating the Pulse Cardinal Points
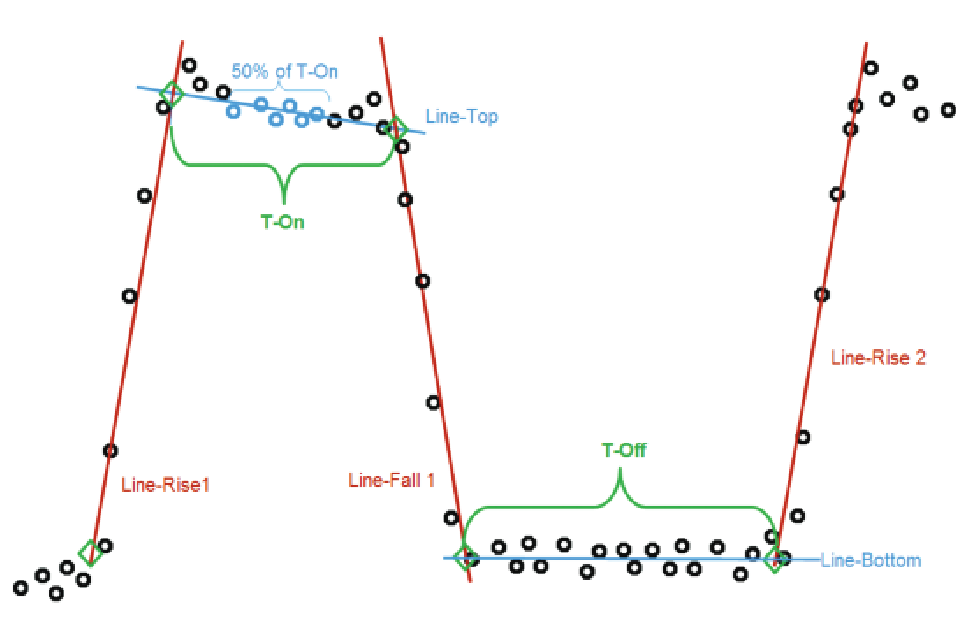
Once it has been determined that a pulse does exist, a model of the pulse will be constructed with four "cardinal points" and four lines. These points and lines are the fundamentals from which all of the measurements are referenced.
Figure 50 shows a set of magnitude samples with the lines drawn through the samples. Then the points are shown at the intersection of the lines. When a pulse view is selected on-screen with a linear scaled display these calculated pulse lines will be shown overlaid on the actual plot of the measured pulse.
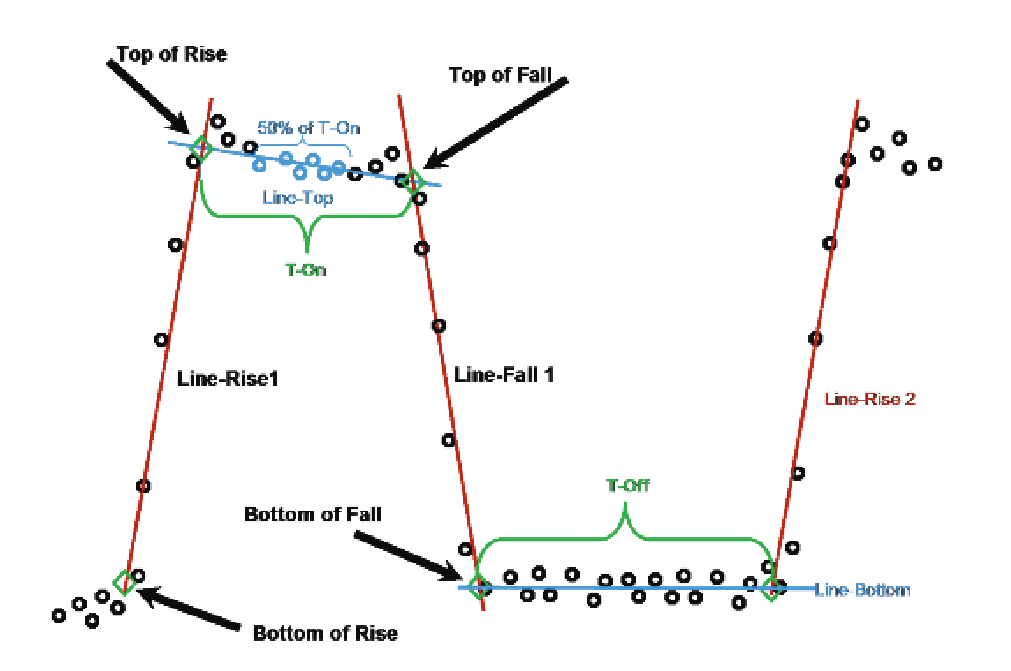
To construct the model, the instrument first performs a re-iterative least squares fit in the pulse points to determine the best-fit position for these lines. The process starts with the top line. For greatest likelihood of good fit, the line-fit is started with only the center 50% of the points at the top. This is done to minimize errors from any overshoot or ringing at the transitions.
This line fit process finds the slope of the top line if the droop compensation is selected. If the Average Top method was selected, then a simple average of the magnitudes of the top samples is used with a flat slope.
Next the same straight-line fit is performed on the rise time and the fall time. Then a baseline is calculated through the bottom points.
Finally the four points are located at the intersections of the lines. These points and lines describe the model of the measured pulse.
There is one more notable detail regarding the finding and measuring of pulses. Figure 51 shows a pulse analysis time that includes four pulses. The user-selected analysis time is seen with a black background. The rest of the total acquisition is seen with a grey overlay. On this Figure, the user-set pulse detection threshold and the minimum off-time are also illustrated as they have been mentioned previously. The pulse analysis is performed only on pulses found in this selected analysis time. Each of the two gray boundaries – the beginning of the analysis time and the end of the analysis time, can be changed either by numeric entry, or by dragging with the mouse.
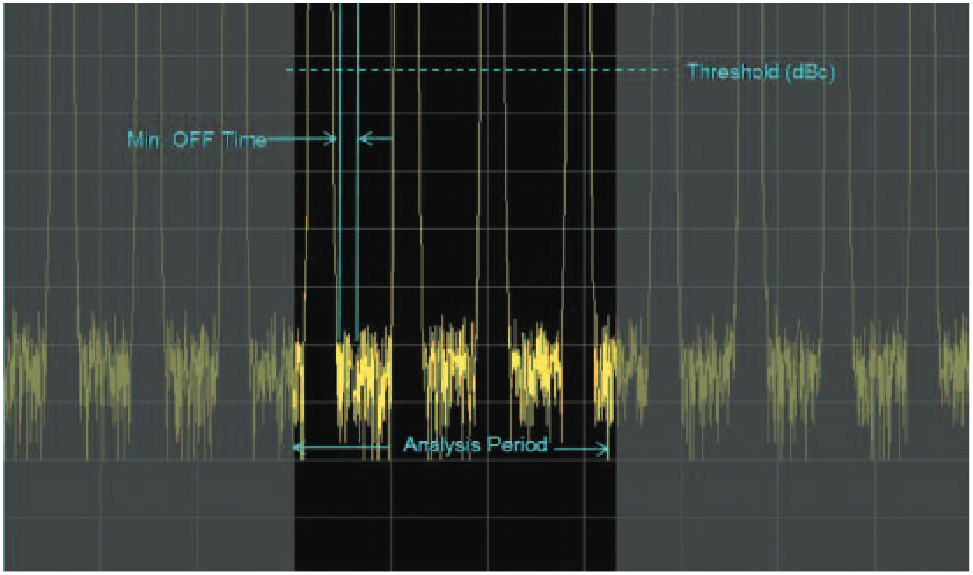
The last of these pulses is unique in that within the analysis time there is no pulse rise following this pulse. Therefore since the Pulse Repetition Interval, PRI, is calculated from the point at the bottom of the fall line to the bottom of the rise on the subsequent pulse, there can be no PRI reported for this pulse.
Interpolation
The preceding example had at least five sample points used to calculate each best-fit rise and fall line. If there are fewer than four points within any of the resulting lines, then a cubic-spline interpolation is performed on the underlying samples (which are a "linear-in-voltage" set of samples). This improves the accuracy of the resulting cardinal Points.
The interpolation and generation of lines and points is always done on samples still in a linear (voltage) scale. The measurements are also performed in this scale. Most measurements report the results in a log power units display (often dB or dBm). The use of a log scale for plots is the reason why the pulse model lines are only shown in the linear displays. If they were shown in the log displays, they would be curves, not straight lines.
Estimating the Carrier Frequency
All frequency and phase measurements within pulses are made with respect to the carrier frequency of the pulse. This frequency can be entered manually by the user if the frequency is known. Or the instrument can automatically estimate the carrier frequency.
If the frequency is to be estimated internally, there are some settings that the user can enter to help with the estimation. The frequency estimations are performed based on the user entry of the type of pulse.
If the carrier were ON constantly, then there would be little difficulty determining the frequency. But for these pulses the carrier is ON and visible for only a small fraction of the time. And these fractions are very discontinuous as well. This makes the determination much more difficult.
Constant Phase
In the case of a CW pulse (all pulses are one carrier frequency) where the phase from pulse to pulse is constant as if the carrier is constant and the pulses are simply gating the carrier ON and OFF.
The measurement calculates the difference in frequency between the pulse carrier and the currently selected center frequency of the analyzer. If the pulse carrier frequency is exactly the same as the center frequency, then the phase of the RF within each pulse will be exactly the same as every other pulse. This is the trivial case and the result is "Zero frequency offset".
Figure 52 shows the result if the frequency is not exactly at the instrument center frequency. Each pulse is measured for phase. Since the IF signal has been digitized and processed into sample pairs with I and Q values, the carrier phase at any sample pair within a pulse can be calculated by taking the inverse tangent of the result of dividing the "Quadrature" sample value by the corresponding "In-phase" sample value.
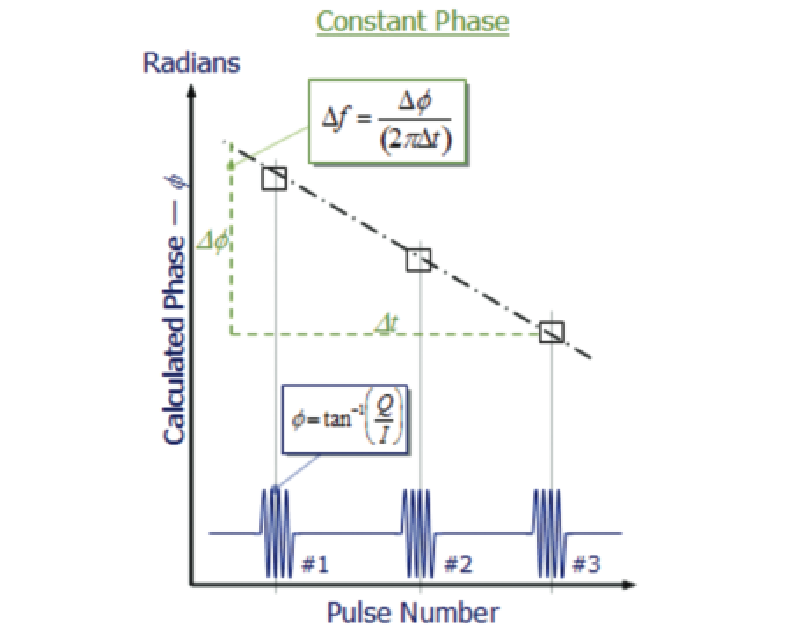
This is done in the middle of each pulse so as to avoid errors that could be introduced by overshoot or ringing that may be present at the beginning or at the end of the pulse. For the first pulse in the record this results in the reference phase. Now there will be a different phase found from one pulse to the next. Plotting the phase value for each pulse versus the time of each of the pulses, a straight line can be found (If the frequency is indeed constant).
This line has a slope which is a change in phase versus a change in time. The formula for the frequency difference is dividing the change in phase by two pi times the change in time. This is now read out as the frequency offset between the measured pulses and the instrument center frequency.
Changing Phase
Figure 53 shows the result if the frequency is not exactly at the instrument center frequency and the phase at each pulse is arbitrarily different from the others. In this case there is no particular phase relationship from one pulse to another. Therefore a complete frequency measurement is made for each pulse using the change in phase versus the change in time across the one pulse.
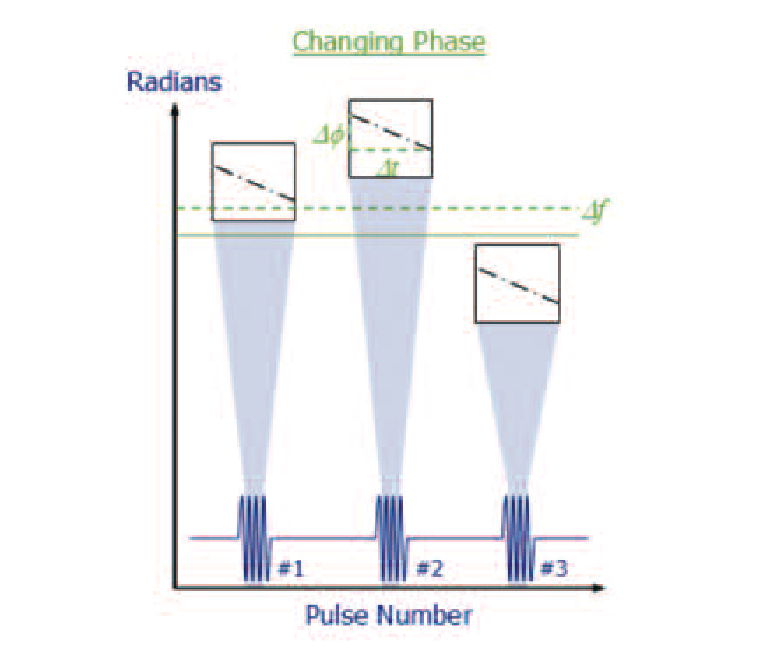
Now all the different frequency measurements are averaged together. This not only finds the average frequency error, but it also averages out the errors that are inherent in frequency measurement over such a short time interval. This method is more calculationintensive than the first one, and so should not be selected unless it is needed.
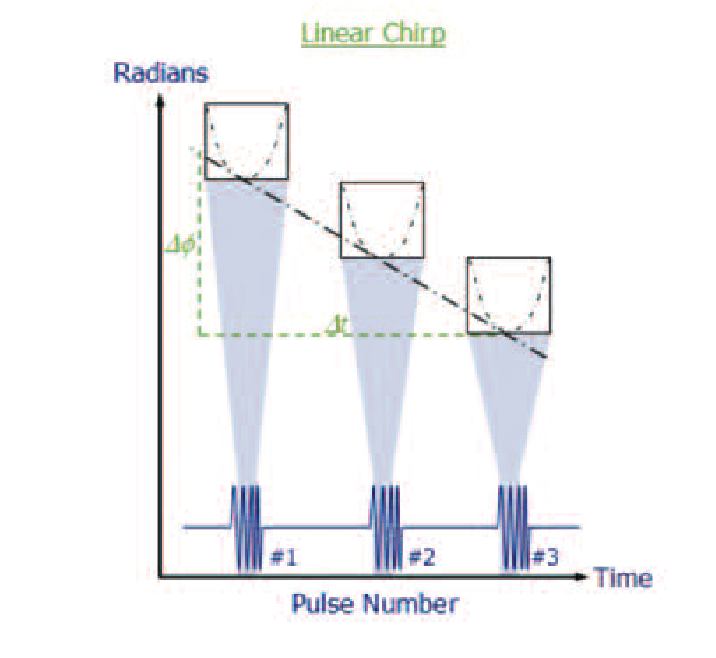
Linear Chirp
For the Linear FM Chirp, it is a bit more complicated. Neither the frequency nor the phase is constant across each pulse, and the phase will additionally shift from one pulse to another if there is a frequency offset.
Again in this method the phase is measured and plotted across the time of each pulse. This phase will have a parabolic shape if indeed the pulses are FM chirps. Once the pulses have all been measured for phase, a line is fitted so that it is tangent to all of the parabolas. This line again describes the frequency offset using the same formula from the first CW method.
Once the frequency offset has been found, it will be used in many of the pulse measurements to account for the difference between the actual pulse carrier frequency and the analyzer's user-selected analysis center frequency.
If the method chosen for frequency estimation is not correct, the answer obtained may be significantly incorrect also. Particularly for some phase measurements within the Pulse Suite, it often provides better results to set the frequency offset manually and lock references between the signal generation and the analysis equipment If the pulse has a modulation form other than the three provided for (such as a non-linear FM chirp), the user will have to manually enter the offset frequency required by the measurements.
Making the Timing Measurements
Once the cardinal points have been located, the timing measurements can be calculated. All are made with reference to these points.
Rise Time/Fall time
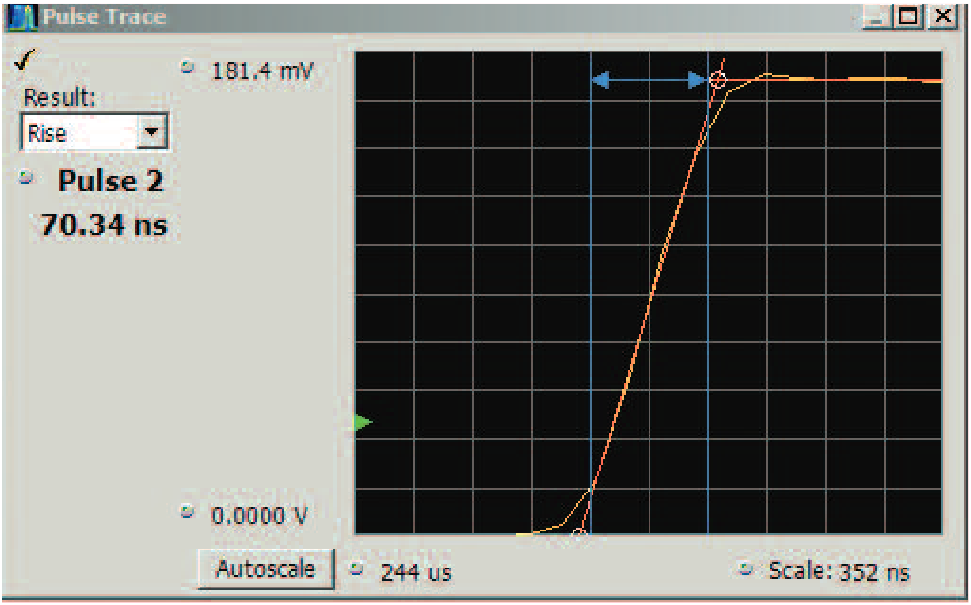
The first measurements are the rise and fall times. The best-fit lines were found as part of the pulse and cardinal points location process. While a good approximation would be to simply measure the time between the lower and upper points at each transition, this would be slightly incorrect. The specified time is between the two points that lie on the actual pulse and are also at the specified amplitudes.
The amplitudes were specified as either the 10 and 90 percent voltage or 20 and 80 percent. In Figure 55 the pulse Trace window shows the measured pulse, the best-fit lines, the cardinal points and the arrow with the vertical lines shows the exact points of the rise time of the pulse.
Measurement System Impact on Rise and Fall times
This next discussion is specific to the hardware in the RSA5000 and RSA6000 Series spectrum analyzers. The calculations work similarly for the SignalVu vector signal analysis software installed on an oscilloscope, but the oscilloscope hardware performance and the different filter limits will have to be factored in to the calculations instead of the RSA5000 and RSA6000 Series performance.
The rise time of any pulse is highly dependent on the rise times of all the elements through which that pulse has passed on its way from being generated to being measured. All passive elements, linear active elements and many non-linear active elements will degrade the rise time of pulses that pass through them. Band-limiting filters in particular will degrade the rise time of pulses.
The rise time of a pulse after passing through a linear system is the square root of the sum of the squares of the rise times of all the cascaded elements. One of the terms is the rise time of the original pulse. For example, the typical rise time of the RSA5000 and RSA6000 Series is 8 ns. If the 55 MHz Gaussian filter is used, then it has a rise time of 12.73 ns. Then if a 10 ns rise time pulse is to be measured, the observed rise time will be the square root of (64 + 162.05 + 100) or 18.06 nSec. This is nearly twice the expected rise time of our pulse with 10 nSec rise time!


Pulse Width
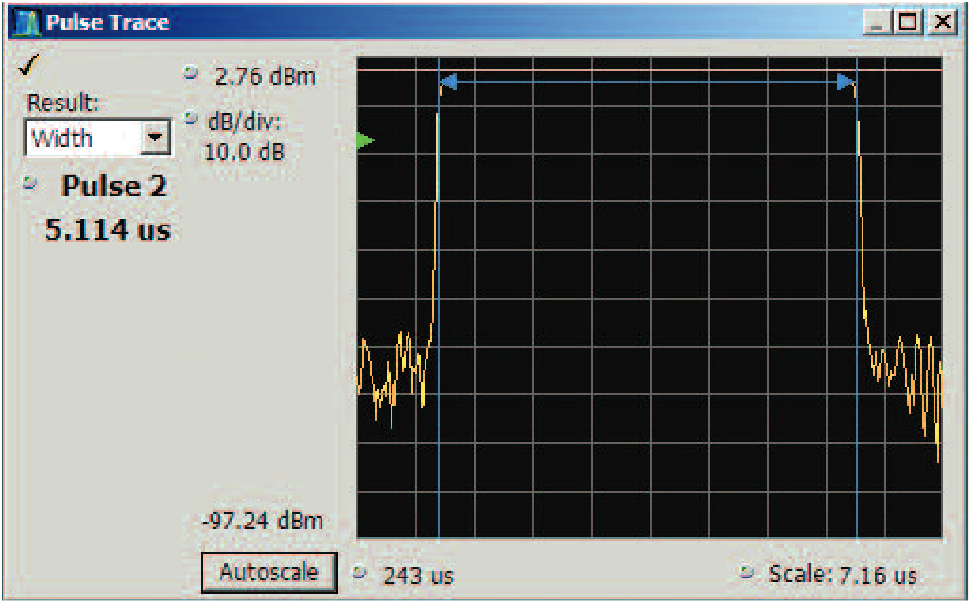
For the pulse width the definition is the "50% points of the rise and fall of the pulse". The user entry defines whether the 50% points are measured in voltage or power. Once these points have been located the width is simply the time between them.
These points may be actual samples, or they may also be interpolated in between samples in the case of sparse samples as previously discussed. Figure 56 is a pulse width measurement with the width measurement lines shown in the Pulse trace window.
Repetition Interval/Duty Cycle
The previous measurements can all be performed even if there is only one pulse. However, the Pulse Repetition Interval (PRI), Pulse Repetition Rate (PRR) and Duty Cycle can exist for any pulse only if there also is a second pulse which follows the one being measured.
These three measurements use the time between the rise of the first pulse and the rise of the subsequent pulse. The PRI is the measurement between the 50% point of the rise of the pulse in question and the next one. The PRR is the inverse of PRI expressed as a frequency. The Duty Cycle is the Pulse Width divided by the PRI, and may be expressed as the ratio, or as a percentage.
Peak Amplitude
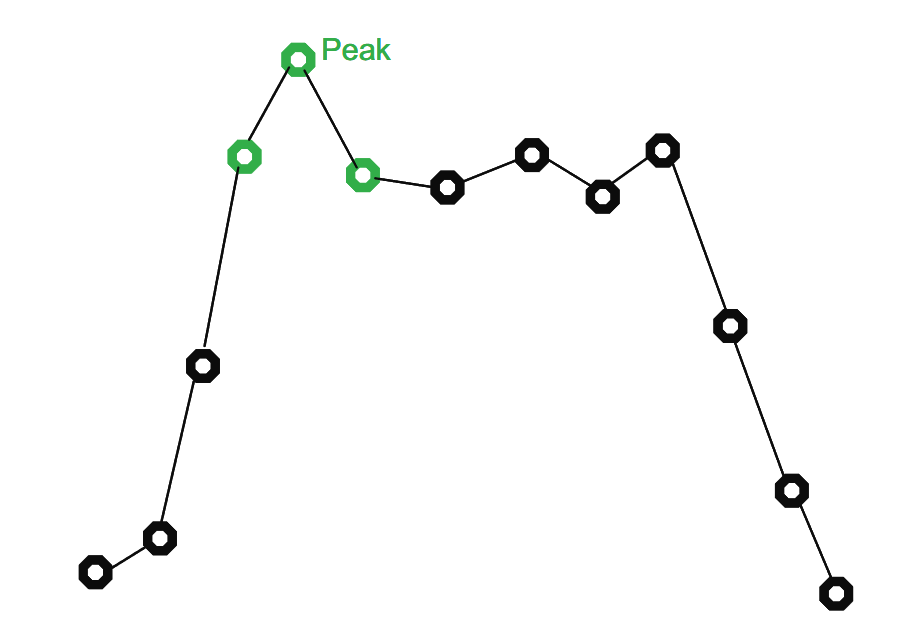
The Peak Amplitude is the highest RMS voltage (local average power) on the pulse top. This represents the overdrive capability needed if this pulse is to be fed to a power amplifier.
If a pulse has significant overshoot, the Peak Amplitude will be the highest of the overshoot peaks. See Figure 57.
Average ON Power
Average ON Power is the integrated power (RMS) present only during the pulse "ON" time. This measurement is gated OFF during the time in between pulses, so no matter how much noise or other power may be incoming during the OFF time it does not contribute to the measurement.
The units of measurement are selectable, including: Voltage, Power, dBm, etc.
Average Transmit Power
The difference between Average ON Power and Average Transmit Power is that for the transmitter measurement ALL power is measured between the rising edge of a pulse and the rising edge of the subsequent one. This represents all power emanating from the radar transmitter integrated over time.
The units in which the answer will be reported are user-selectable.
Droop
The ideal pulse usually has constant power throughout its duration. But there are two conditions under which this might not be the case. The first is sometimes found in high power transmitters (such as klystron amplifiers) if the amplifier is unable to maintain full power output during a long pulse. The result is a pulse that "droops" as the power falls off.
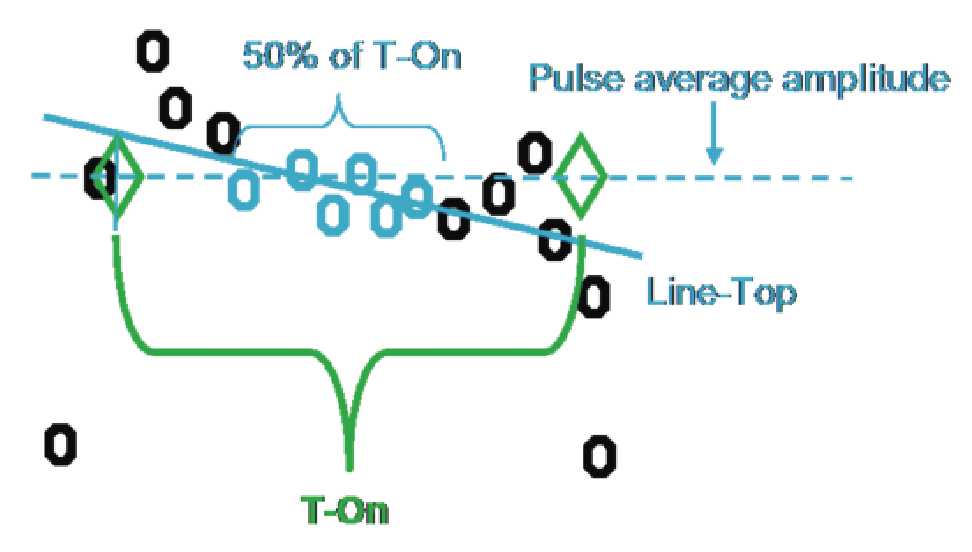
The Droop measurement examines the set of samples making up the top of the pulse. The first 25% of samples across the top and the last 25% of samples are excluded from consideration because these are the most likely places to have overshoot distortions.
While the average amplitude has already been calculated, now a straight-line best fit line is calculated through the remaining center 50% of the samples.
This represents the droop of the top of the pulse. The Droop readout is the difference between the start and end of the pulse top expressed as a percentage of average pulse voltage amplitude. If the independent start and stop points determination has been selected, the pulse cardinal points (described earlier) will be calculated at the intersections of this line instead of the flat top line.
Pulse Top Ripple
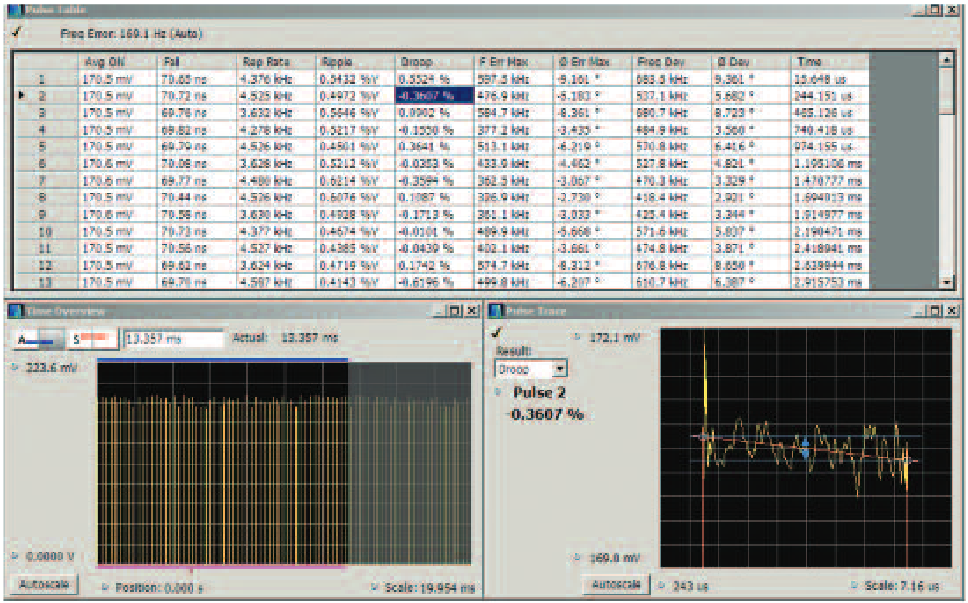
Once the droop has been found, ripple can be measured. The Ripple is defined as the difference between the peak positive and negative excursions from the best-fit line (which was already found to be the Droop). This ripple as seen in Figure 60 and is expressed in percent of the pulse-top voltage.
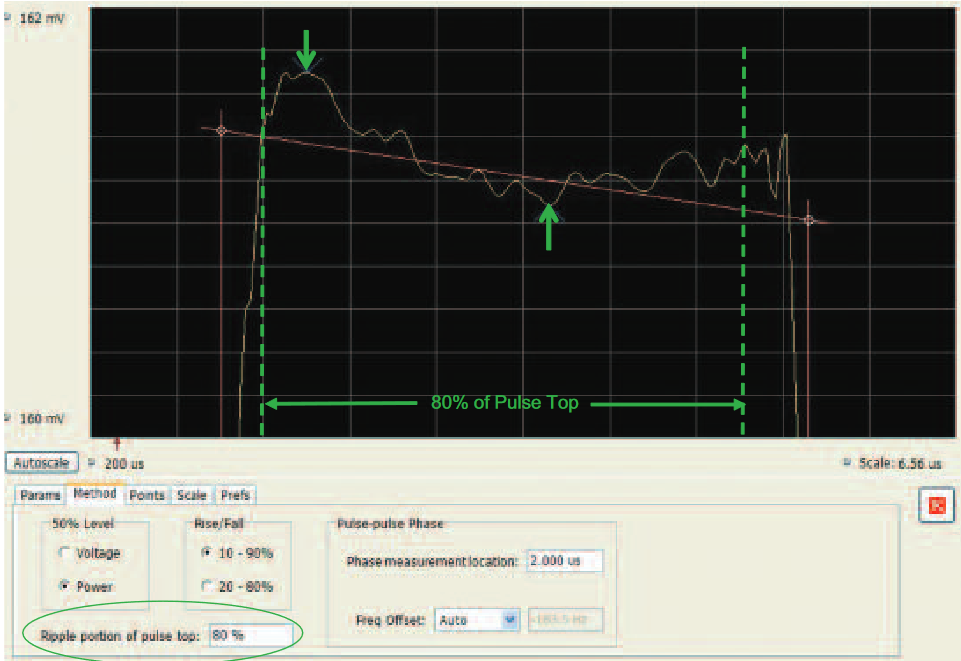
This measurement does not differentiate between coherent ripple (such as a sinewave impressed on the pulse top) or random variations in the pulse top. All variations are considered to be ripple.
There is a user control for the "Ripple portion of the pulse top". This allows exclusion of any overshoot which is present only at the pulse transitions, so that it does not impact the answer. The Figure 60 shows a selection of measuring the center 80% of the pulse. The default for the ripple measurement is the center 50% of the pulse top.
Making the Frequency and Phase measurements
Carrier Frequency
For CW pulses only, a frequency measurement can be made using the marker on a spectrum display, but this method has limitations due to the PRF lines that are an artifact of swept spectrum analysis and the difficulty of locating the center one to place the marker depending on the space interpolation and signal repeatability.
In this section we look at the method used by the software to find the carrier frequency within pulses in preparation for the automated measurement of all of the phase and frequency parameters.
The result from this frequency measurement is available by examining the "Freq Estimation" tab within the Pulse Table Settings menu. The readout is in the far right of Figure 61. This reading is the difference between the instrument center frequency and the carrier frequency measured within the pulses. It must be added to the center frequency setting of the analyzer to fully determine the carrier frequency. This measurement functions for all pulse modulation types supported for automatic carrier offset estimation.

Note, that this is a measurement only if the "Auto" box is checked. If the Auto mode is not selected, then this box contains the manually entered frequency offset, and is not a measured frequency.
Pulse-to-Pulse Measurements
The Pulse-to-Pulse measurements below could be considered as long frame measurements, since each pulse is actually compared to the first pulse in the acquisition. But they are listed here, since they each provide one value for one pulse, and are not themselves processing the values from all pulses at the same time.
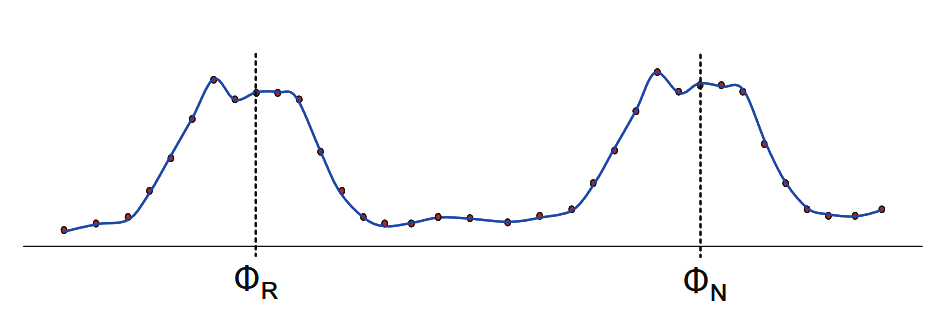
These measurements use the previously presented entry for the measurement position within the pulse. At this user-defined point, a measurement is made in each pulse. This measurement is a comparison of the phase or frequency of the pulse carrier at that point in each pulse to the same measurement made on the first pulse in the digital acquisition.
Pulse-to-Pulse Carrier Phase Difference
The following measurement in particular is dependent on the phase noise performance of the Analog acquisition hardware including the system digitizer clock. All of the performance discussed here applies only to the RSA6000 Series spectrum analyzer. The phase noise performance of the SignalVu vector signal analysis software installed on an oscilloscope will be dependent on the phase noise performance of the particular oscilloscope on which the software is installed. Also, the architecture and the phase noise performance of the RSA5000 is different, so the results will not be the same.
In Figure 63 the blue vertical line on the pulse trace denotes the point at which the phase measurement is made on all of the pulses. The result is seen on the left of the pulse trace in the "result box".

The measurement is made using the same I/Q processing as other phase measurements described here. However, the accuracy of this measurement is subject to four major influences that need to be considered: signal-to-noise ratio, phase noise, estimation of the pulse rising edge, and finally the overshoot present on the pulse as measured.
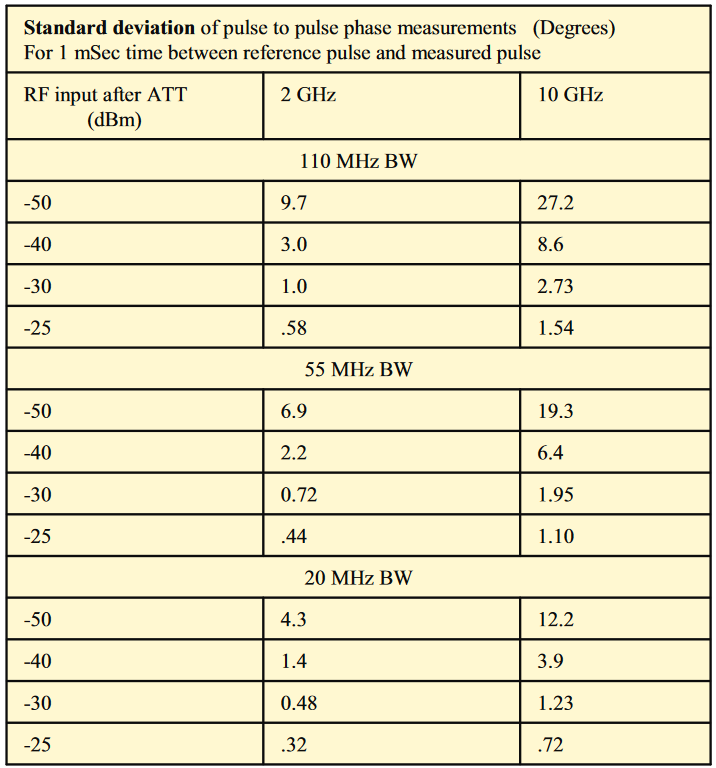
Signal-to-Noise Ratio Effects on Pulse-to-Pulse Phase
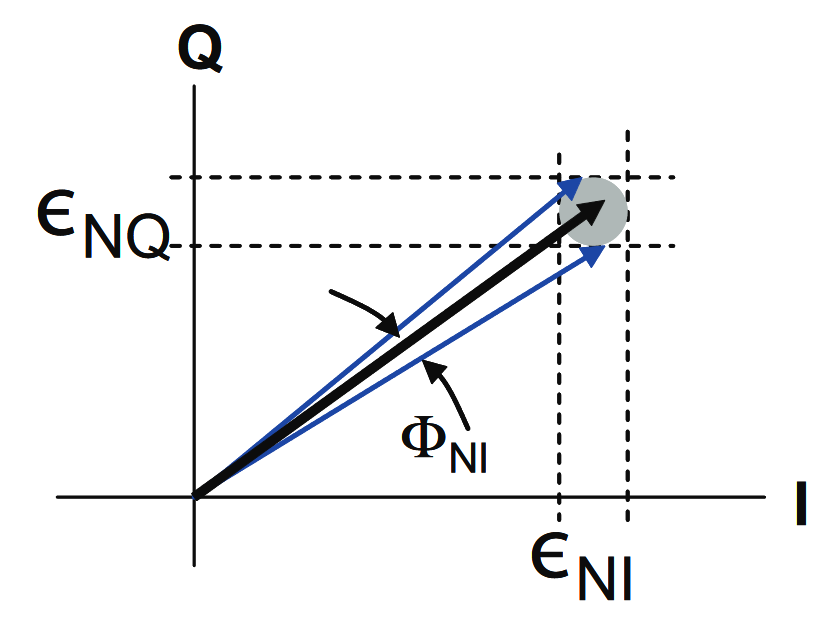
If the S/N is less than perfect, the added noise will cause the phase measurements to have added uncertainty. This effect is seen in Figure 64. The variability is the gray circle, and the resultant angular measurement uncertainty is shown as the angle that encompasses the circle.
This formula in Figure 65 holds where: S/N is expressed as ratio of powers (not in dB), t = Time between measured pulse and reference pulse, and BW = Measurement Bandwidth.

Phase Noise Effects on Pulse-to-Pulse Phase
Phase noise adds an uncertainty term directly to the measurement of phase. However this addition is heavily impacted by the length of time between the reference pulse and the particular pulse being measured. The longer the time, the dramatically greater is the uncertainty which is added to the phase measurement. This is a result of the longer integration time including the phase noise at lower offsets as seen in Figure 68. The phase noise at the lower offset frequencies rises significantly.
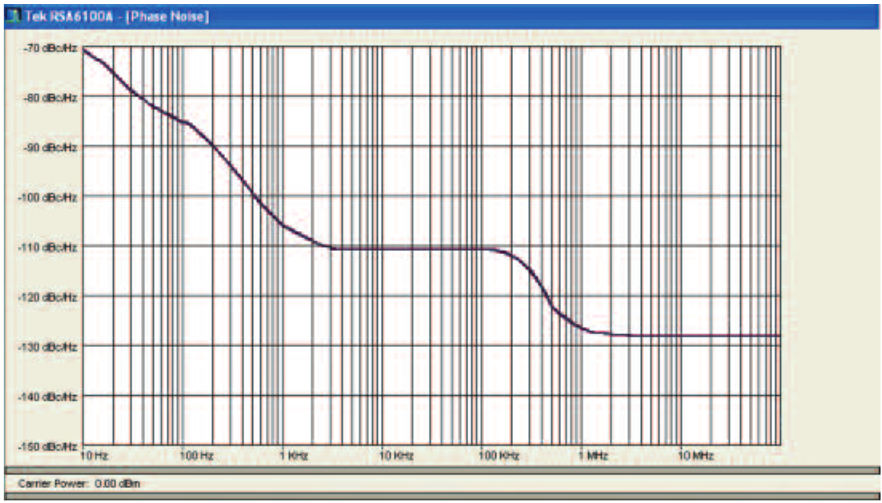
See Figure 67 for error formula for phase noise.

This formula in Figure 67 holds where: t = Time between the measured pulse and the reference pulse, and BW = Measurement Bandwidth.
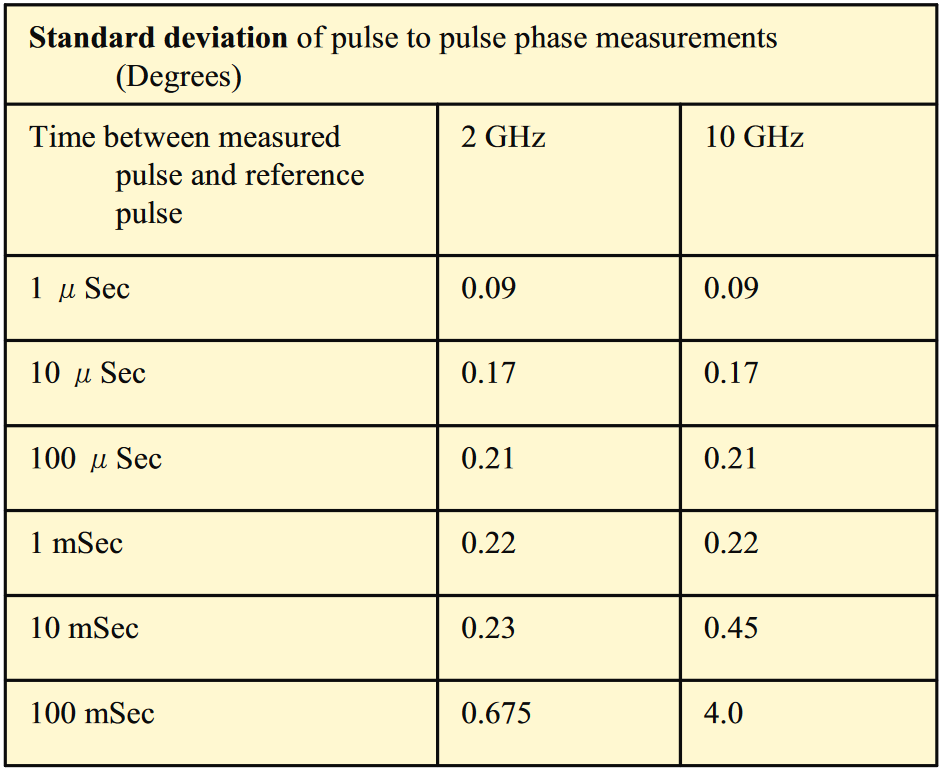
The contribution of phase noise to pulse-to-pulse phase measurement accuracy is listed in Figure 69. For a 1 millisecond time between the reference pulse and the measured pulse there is a 0.22 degrees of error. If the time is increased to 100 ms, the error contribution rises to 4 degrees for a measurement frequency of 10 GHz. The difference at 10 GHz is due to the difference in the phase noise performance at this measurement frequency.
Effects of Pulse Leading Edge on Pulse-to-Pulse Phase
Another error term arises from uncertainty in determining the shape and location of the rising edge of both of the pulses. The point at which the phase measurement is made on each pulse is userdefined to be a particular time delay from the center of the rising edge. If there is an error in determining the exact location of the rising edge, then there will be a time error in the location of the measurement position. This time error directly causes a phase error in the measurement.
For added amplitude noise due to signal-to-noise, the longer the rise time of the pulse, the more time error there is for a given amplitude error which is due to amplitude noise in the determination.
If there is also a frequency offset of the pulse carrier frequency, there will be a much increased phase error due to the leading edge uncertainty. This is due to the fact that a frequency error translates to a constantly changing phase, and the time uncertainty error walks up and down this changing phase.
Overshoot Effects on Pulse-to-Pulse Phase
Another error is introduced by any overshoot and resultant ringing present on the pulse top.
When a pulse passes through a band-limiting filter, the filter does two things. One is that some of the further-out sidebands which are due to the rate of rise of the transition time will be filtered off. This adds some overshoot. But the greatest cause is usually the group delay changes near the filter edges.
Both analog and digital filters exhibit these effects. Digital filters can additionally exhibit "Gibbs effect" which is a result of the digital sampling of the signal.
A crude simplification of the filtering effect which can usually help with predicting the worst-case ringing is that a good Gaussian filter (to at least 12 dB down) will likely introduce up to 5% overshoot. For band-limited RF converters with sharper filters the overshoot can easily be 30% to 50% of the pulse amplitude.
From Figure 70 it can be seen that there is a decaying ringing that starts at the overshoot and decays as it progresses toward the center of the pulse top. If the measurement point is picked somewhere within the ringing, then with very small changes in the pulse width, pulse position, or other parameters, the measurement point will move up and down the ringing. This causes highly variable phase readings. The table in Figure 71 gives some approximate uncertainty predictions for various amounts of time from the rising or falling edge and the phase measurement point expressed in terms of the inverse of the filter bandwidth. In this case, the "no filter" column is the standard deviation present when "no filter" is selected in the bandwidth control of the RSA6000. This results in the measurement being affected by the phase variation of the RSA6000 IF filter.
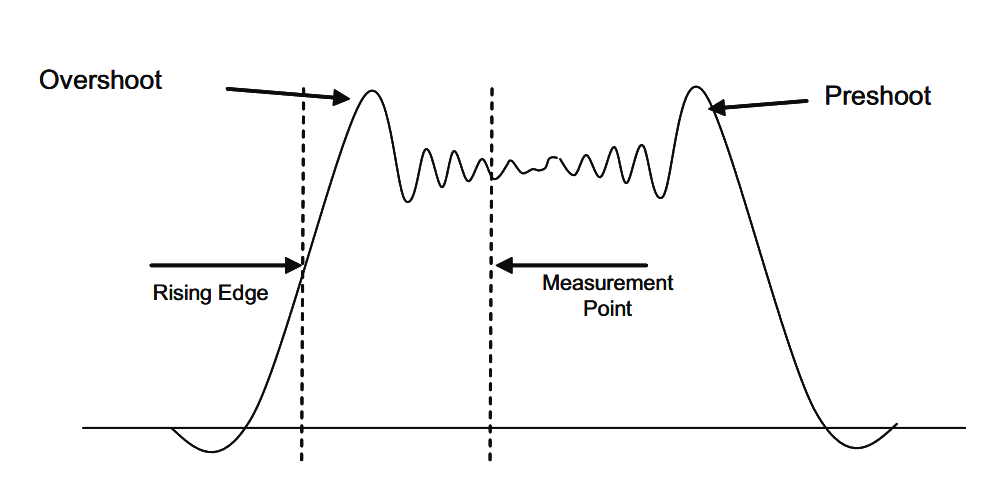
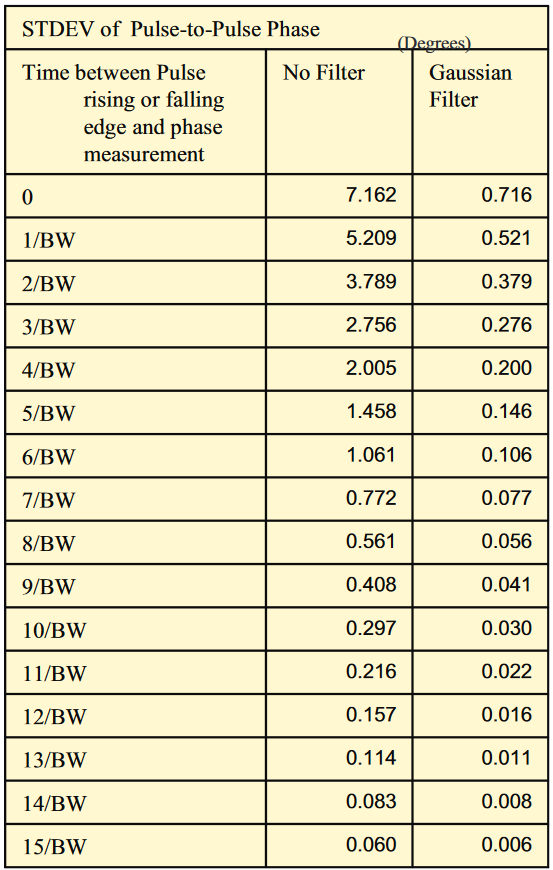
Pulse-to-Pulse Carrier Frequency Difference
The Pulse-to-Pulse Frequency measurement is just like the corresponding phase measurement, except that the error effects are far less pronounced. Frequency measurement is a relative phase-change measurement made locally on the pulse, from which the frequency is calculated. Then the measured pulse frequency is compared to the reference pulse frequency which was found locally within the first pulse.
The multiplication of error with increasing time between the reference and measured pulse that plagues the Pulse-to-Pulse Phase measurement is simply not an issue for the frequency measurement. This is due to frequency being made as a local absolute measurement, not depending on phase differences across multiple pulses.
As with phase measurements, the bandwidth of the measurement directly impacts the uncertainty doe to the increased noise power in the measurement bandwidth. Also, for FM chirps, the uncertainty increases as the point of measurement lies on a frequency further removed from the center frequency of the measurement bandwidth.
The frequency measurement is made at the same point on a pulse as was the pulse-to-pulse phase measurement.
Chirp Measurements
There are specialized measurements required for verification of the performance of frequency chirped pulses. For simple Time-of-flight pulsed CW radar, the main concern is that the timing parameters of the pulse be as designed. For chirp radar, the possible transmitted errors which will cause errors in the receiver can be much more subtle. While parameters such as pulse timing, center frequency, chirp frequency width and frequency errors across the chirp will all certainly cause problems when the transmitter adds these to the radiated signal, the phase errors across each pulse as well as from one pulse to another are the more subtle contributors to the success of chirped radar.
Chirp measurement in our context is much like other measurements in that it is not so much a duplication of the radar receiver for its own sake as it is a measurement of the quality of the transmitted pulse. The primary quality indicators will be driven by the need for the transmitted pulse to not contain distortions or artifacts which themselves would appear to the receiver as interesting characteristics of the target.
The chirp measurements depend on the previously discussed determinations of pulse position, timing, cardinal points, and carrier frequency offset. The frequency offset and the pulse start and stop times are very critical to chirp measurements. All of the frequency and phase measurements are referenced to the carrier frequency (analyzer center frequency corrected by the carrier frequency offset). The start and stop times of the pulse also determine where chirp total deviation measurements are made.
Frequency Total Deviation
Frequency Deviation is the chirp frequency width. The plot (as seen in Figure 72) defaults to zero frequency in the middle of the vertical axis. This is the carrier frequency. Then the extent of the frequency sweep is measured as minus and plus extent from the carrier.
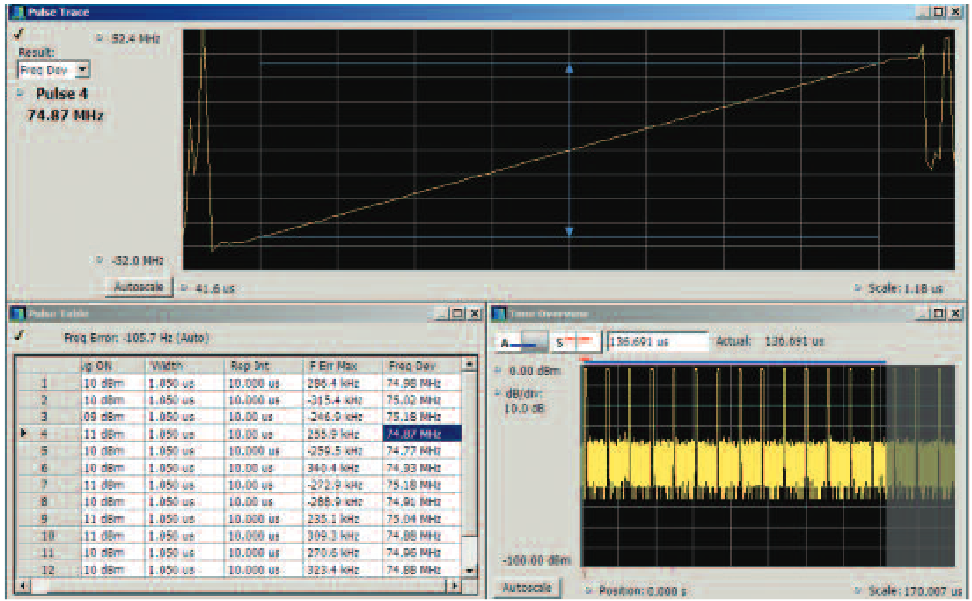
The actual measurement is performed sample-by-sample using the phase calculation at each sample and then the time between samples. The frequency difference from the carrier is calculated at each sample.
Frequency Linearity Error
Once the frequency data has been built for the chirp, a best-fit straight line is calculated from the measured points. The advanced signal analysis software currently uses a linear FM model for the ideal chirp.
Now the ideal model is subtracted point-by-point from the measured frequency plot. The result is a plot, as in Figure 73, of the error as compared to ideal. There is a single numeric result available for each pulse. The calculation of this number is selectable as either the peak value or the RMS of all the values across the pulse measurement window.
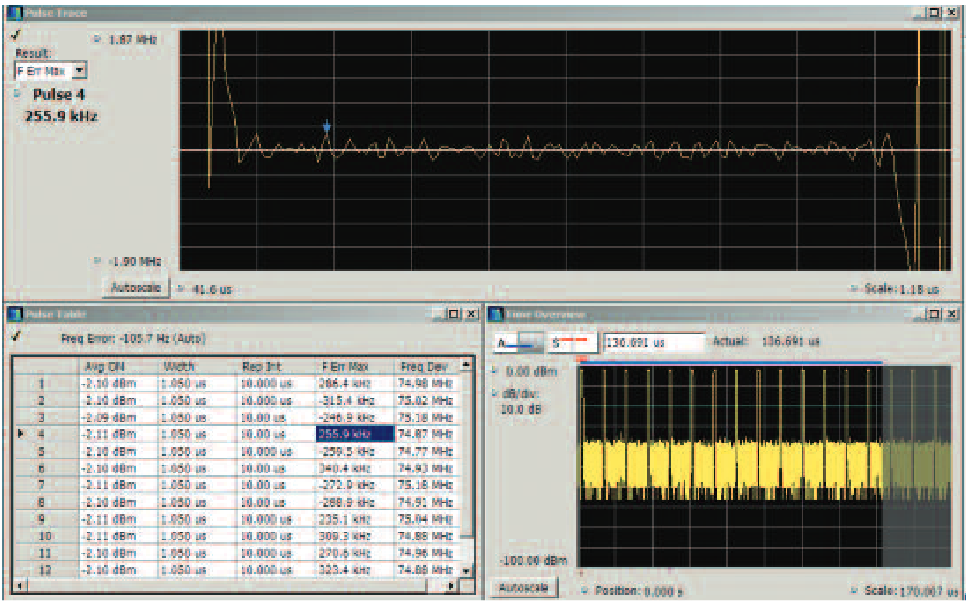
Phase Total Deviation
The term, phase deviation, is used because the phase change being examined is so similar to frequency deviation in FM modulation. The frequency term came from FM communications where the amount of modulation is expressed as a change or deviation of frequency from the carrier frequency as the modulation is performed.
This measurement is calculated in the same manner as other phase-versus-time measurements. The digital samples from the IF A/D converter are processed into In-phase and Quadrature sample pairs within the signal processing hardware. This decimates the original samples by two, and results in a single I/Q pair of values for each decimated sample time.
The instantaneous phase at each sample is calculated by taking the arctangent of Q / I (with conditional checking for the divideby-zero case and the opposite quadrant cases).
Since there can only be phase values from this calculation in a range of 360 degrees, the phase wraps around from -180 degrees to +180 degrees if it changes more than 180 degrees. This requires that the software "unwrap" the phase by adding or subtracting 360 degrees whenever the plot would have values that change from -180 to plus 180. The result is the complete nonminimum-phase change plot. There can be huge phase change numbers across a chirp. The plot in Figure 74 shows 3347 degrees across the chirp.
Before a plot of the phase means anything, there needs to be a reference against which the phase values are compared. This is conventionally taken to be the RF pulse carrier frequency. This is when the correct determination of carrier frequency becomes most important.
When the phase is referred to the carrier frequency (which is at the center of a linear FM chirp) the phase plot will be a parabola centered on the carrier. Each instantaneous phase value is calculated with respect to the center frequency, the phase deviation (the phase change across the pulse time) is the plot of these values versus time.
If the chirp has increasing frequency with time, the parabola will have its "opening” facing up as in Figure 74. If the chirp is decreasing in frequency, the parabola will be upside-down.
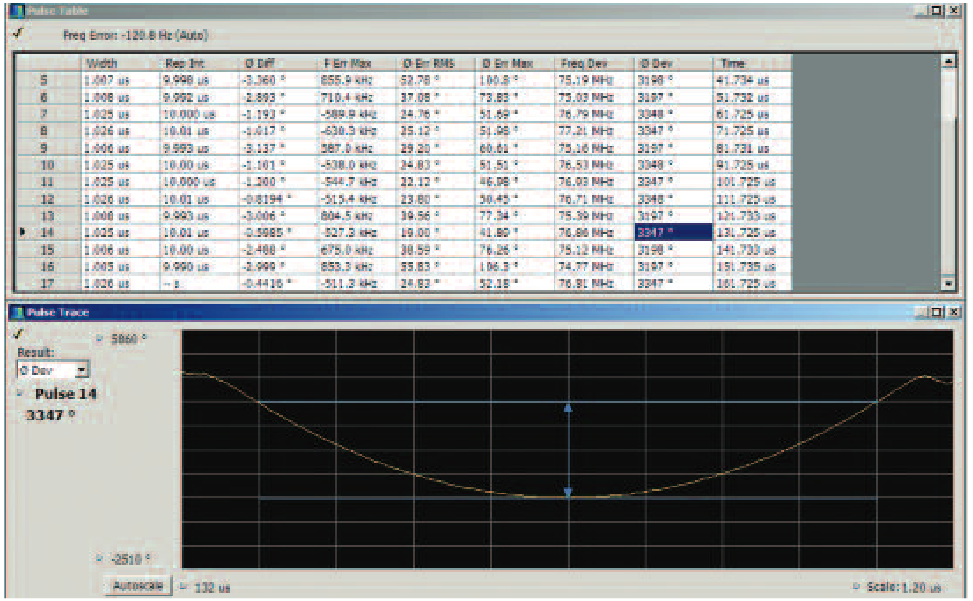
The blue lines on the phase plot represent the maximum extent of the phase change across the portion of the chirp that has been selected to be measured. The numeric readout is the distance between these maximum and minimum phase values.
Phase Linearity Error
Phase Linearity is the single most important characteristic of most frequency chirps. The most common reason for chirping a pulse is to provide for the compression of the pulse in the radar receiver. When compressed, all of the frequency components of the pulse compress into one very short pulse. In this manner, the pulse return from each target will be very short, and a much longer transmitted pulse can now separately resolve targets which may be physically very close.
For a single target return, as this compression is performed, if the incoming chirp were perfectly linear, the result would be a single impulse. If there were two closely-spaced targets, there will be two closely spaced impulses. However, if the transmitted pulse is not perfectly linear, the compressed return from a single target will have distortions in the impulse. Depending on the character of these distortions, they may produce side lobes on the impulse response which can obscure a smaller target, or in the extreme produce false targets in the receiver. The most sensitive measure of these distortions is the phase linearity of the pulse.
To measure the phase error, the perfect reference phase trajectory must first be determined. The first steps are listed above: Carrier Frequency, Frequency Deviation, and then Phase Deviation.
From the center frequency and the frequency deviation the perfect phase trajectory can be calculated. For a linear frequency chirp with equal frequency deviation above and below the center frequency, the trajectory is a parabola if the center frequency is the reference for phase calculations.
After the reference phase trajectory is calculated, then the actual phase trajectory is measured, which is the plot from the Phase Deviation measurement above.
Next, the reference phase trajectory is subtracted from the measured trajectory in the same manner as was the frequency error. The result is a plot of the phase error versus time of the chirp.
There are two selectable numeric processes performed on this error plot. Either the maximum number of degrees of phase error across the chirp, or the RMS value of the errors across the chirp calculated. The user-selected result is an overall measure of the quality of a Linear Frequency Chirp.
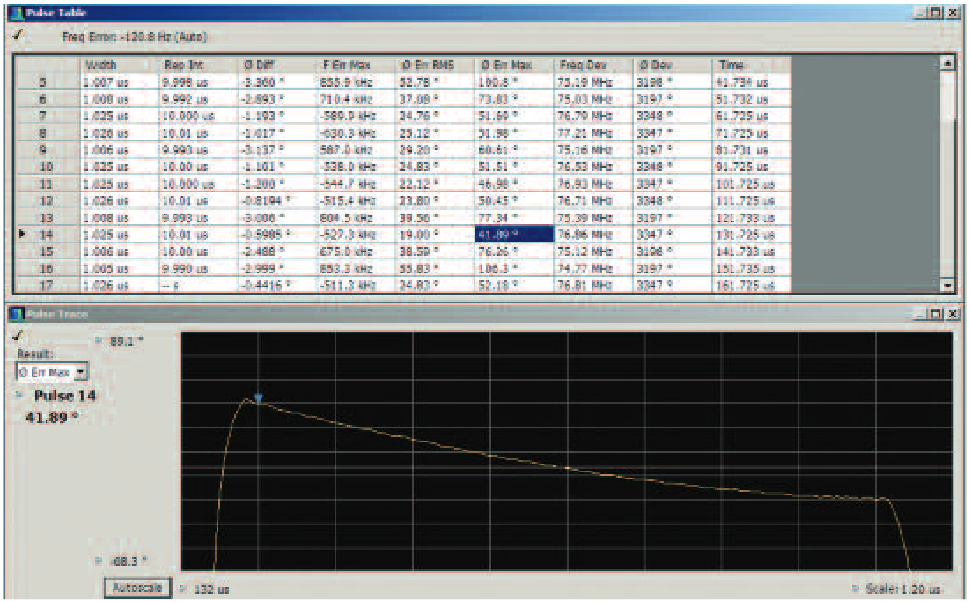
Dynamic Range Requirements for Chirp Measurements
The automated pulse measurements were originally developed for use on the RSA Series spectrum analyzers, some of which have up to a 78 dB typical SFDR at the 40 MHz wide acquisition bandwidth. Neglecting both A/D distortion/noise/bandwidth additions, as well as possible reductions of noise/distortion due to the application of DSP, the raw S/N should approximate 6 dB per bit.
While the usual oscilloscope bit depth of 8 bits has sometimes been thought to be insufficient for Chirp Radars, there are many cases where the oscilloscope's dynamic range can be used to great effect. Over sampling also effectively increases the dynamic range by a log ratio of the sampling rate divided by Nyquist sample rate. When you consider the sampling rates of MSO/DPO/DSA Series oscilloscopes of 100 GHz, and the Nyquist sampling required analyzing chirps of 1 GHz, the resultant increase in total effective bits dynamic range can be greater than 13dB (> 10 bits).
Impulse Response Measurements
Impulse response (IPR) is usually thought of as a time-domain measurement of the input-to-output transfer response of a network. This measurement is usually performed by a Network Analyzer on separate components such as amplifiers, filters, switches, etc.
Figure 76 shows the amplitude and time differences of an impulse response. In this case, we are performing a time-domain measurement of a frequency-domain linear FM chirp pulse. The result can be thought of as similar to a Time Domain Reflectometer (TDR) measurement, but with the excitation signal being the chirp itself.
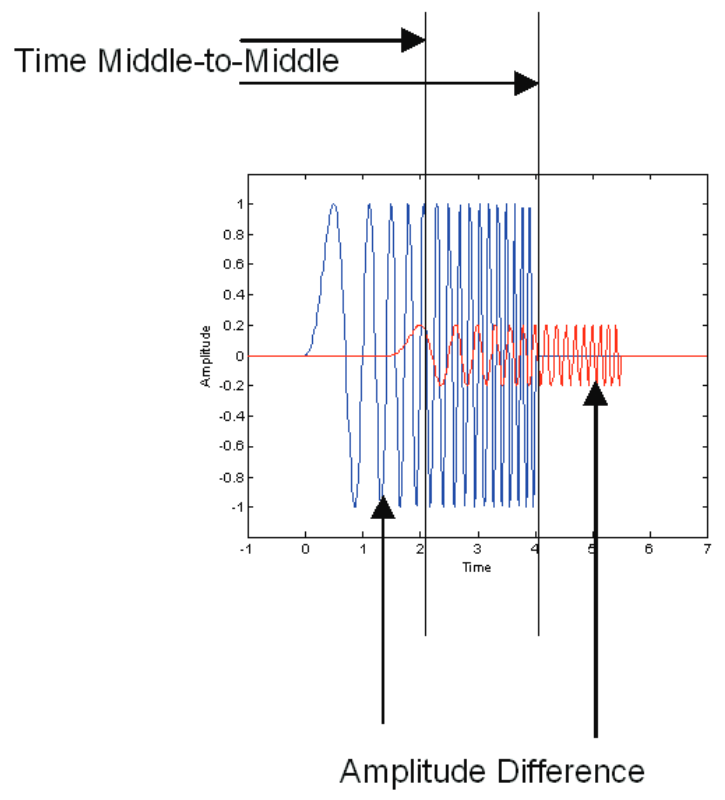
IPR can also be thought of as a swept correlation looking for copies of the reference signal. Any reflections or otherwise delayed copies of the main chirp will show up in the output plot as a “sidelobe” of the main “lobe”. Figure 77 shows an example of a mismatch error that can contribute to the impulse delay (reflections) and suppressed level of a response. The amplitude and time delay of each secondary pulse copy will be represented as the sidelobe amplitude and location. The amplitude is normalized to the amplitude of the main chirp. For this reason, the IPR measurement is sometimes referred to as a Time Sidelobe measurement.
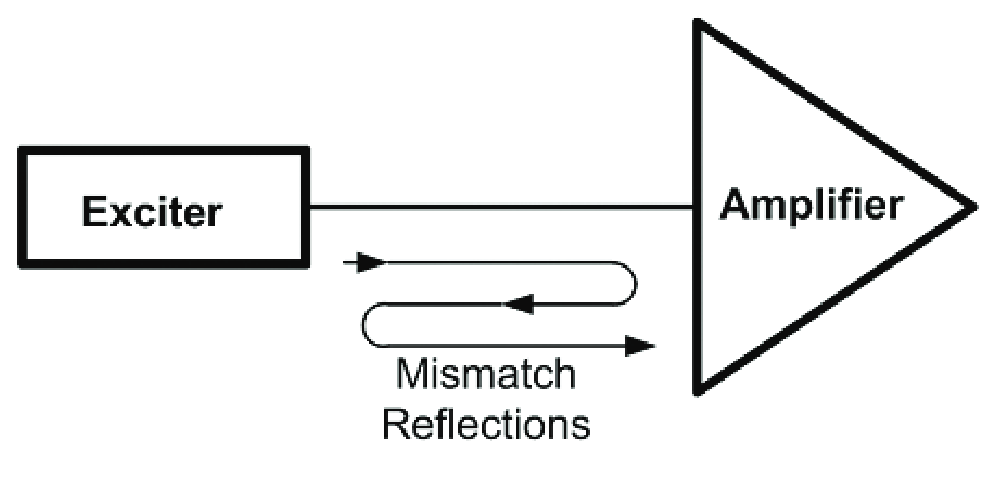
Of the other available chirp measurements, none of them can replace the detail or the insight of the IPR measurement method:
- Frequency-vs.-Time can work only for single RF signals at any time. If multiple signals are present, an FM discriminator will only follow the higher amplitude signal, or produce noise.
- Spectrogram can see multiple signals at the same time, but it cannot compare two signals for errors if they are copies of one another. More importantly, the Spectrogram is limited in time resolution. It can see no shorter time than one FFT Frame of digitized samples of the signal.
The IPR method shows both time and amplitude simultaneously for signals that are copies of one another.
The calculations follow the block diagram shown in Figure 78. After the RF pulse is digitized, a time window is applied to reduce the unwanted sidelobes that result from an FFT mathematics when the input signal is finite time limited (not continuous). For the IPR, the Taylor window is a good compromise between lobe width and residual sidelobe level.
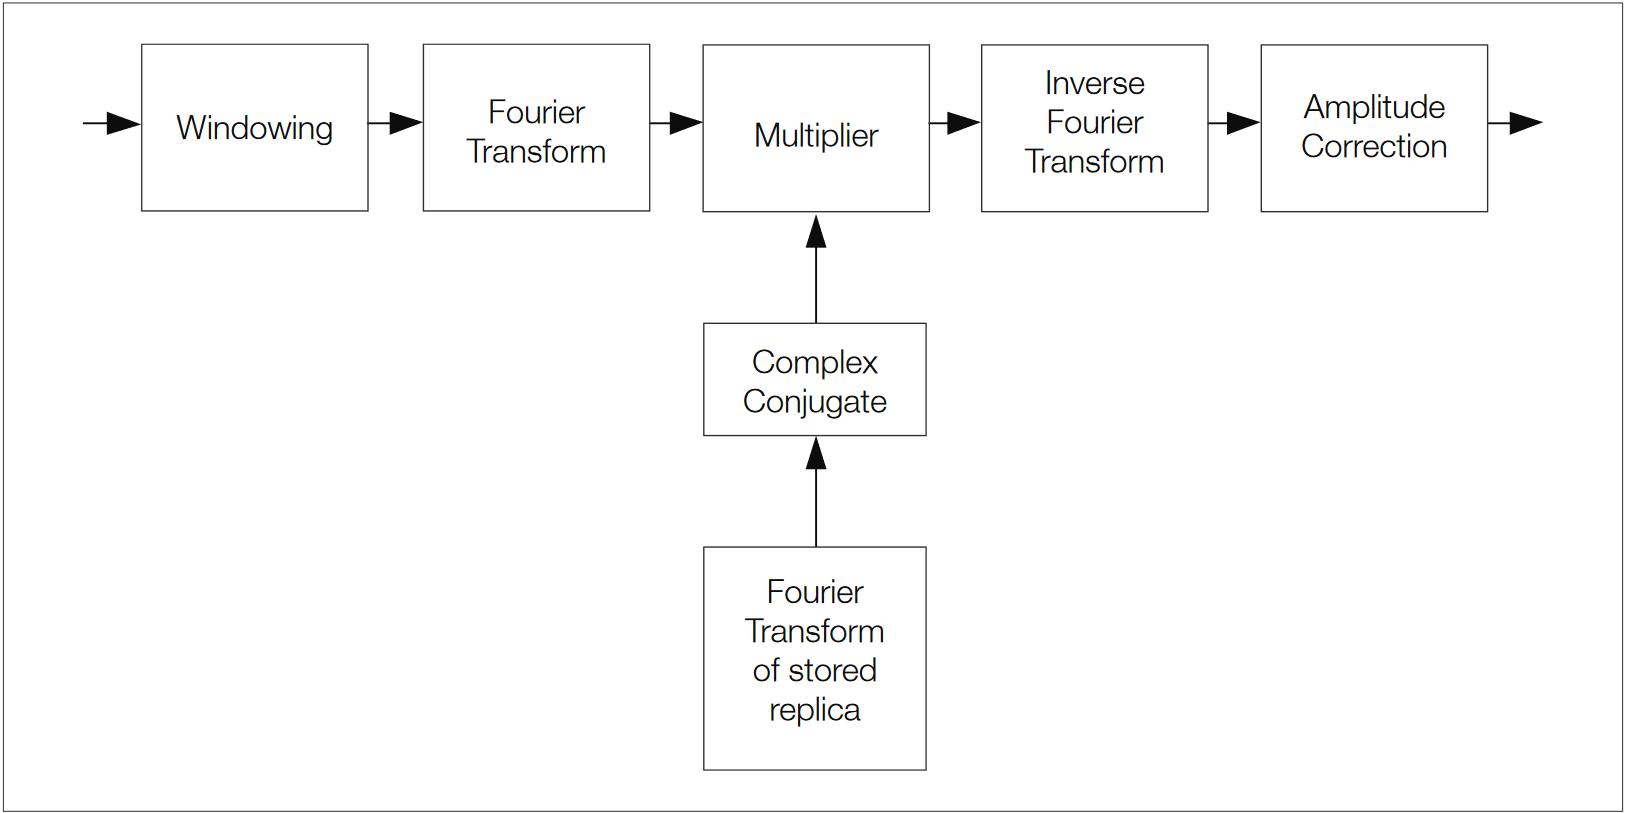
After the windowing, an FFT or other Discrete Time Transform is performed to give a frequency-domain intermediate result. This spectrum is multiplied by the complex conjugate of an ideal chirp. This de-chirps the pulse.
The ideal chirp can be estimated by the measurement routine as a best-fit against the incoming signal. Or the user can enter the “ideal chirp slope” for a more accurate measurement.
After the multiplication, an Inverse FFT is performed to transform back to the time domain. The result is a standard Impulse Response (IPR) plot. The last block applies an amplitude correction to the IPR plot which is shown in Figure 79.
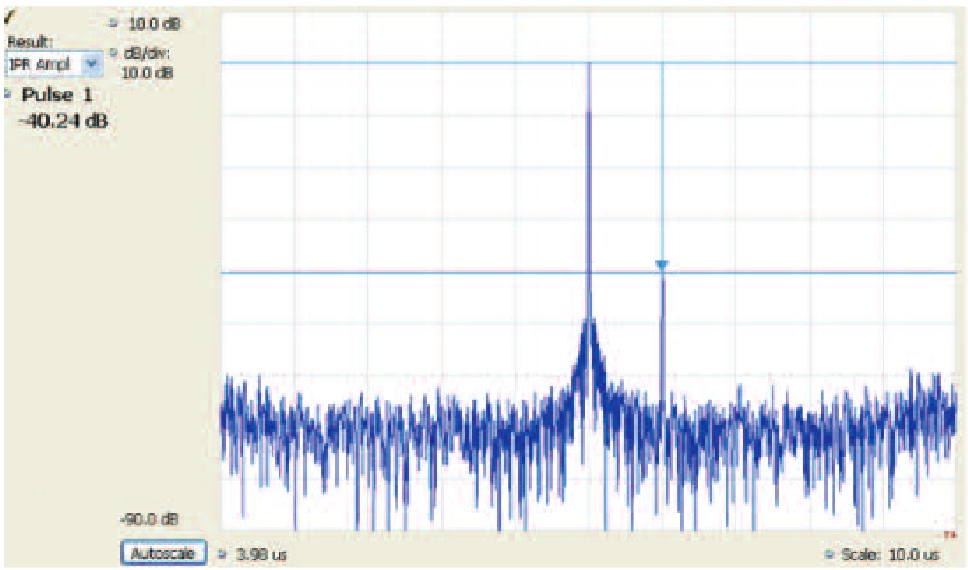
Several chirp defects are best discovered using the Impulse Response. Not only time reflections, but incidental modulations can be discovered. The frequency sidebands that result from undesired modulations present on a chirp pulse appear as a lower amplitude chirp on both sides of the main chirp pulse.
As the chirp changes frequency, the sidebands move along with the carrier and are indistinguishable from any other side lobe except that they appear on both sides of the main lobe.
These may be difficult to see using FFT spectrum analyzer methods, as the minimum time resolution of an FFT is the time occupied by the entire frame of digitized samples used by the FFT.
The relationship between the impulse side lobe delay time and the frequency components of the chirp is given by the formula in equation 1. Where” Delta T” is the time difference between the time side lobes and the main lobe, Fm is the frequency of the incidental modulation, Td is the duration time of the chirp, and Fd is the frequency sweep width during the chirp.
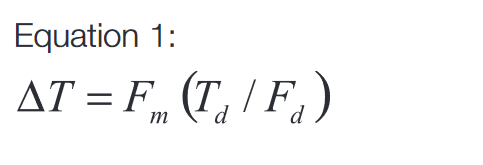
Figure 80 shows the different time responses of the mismatched reflection and a separate intermodulation product. The IRP measurement method can be an important tool in assessing the overall quality of the chirp response.
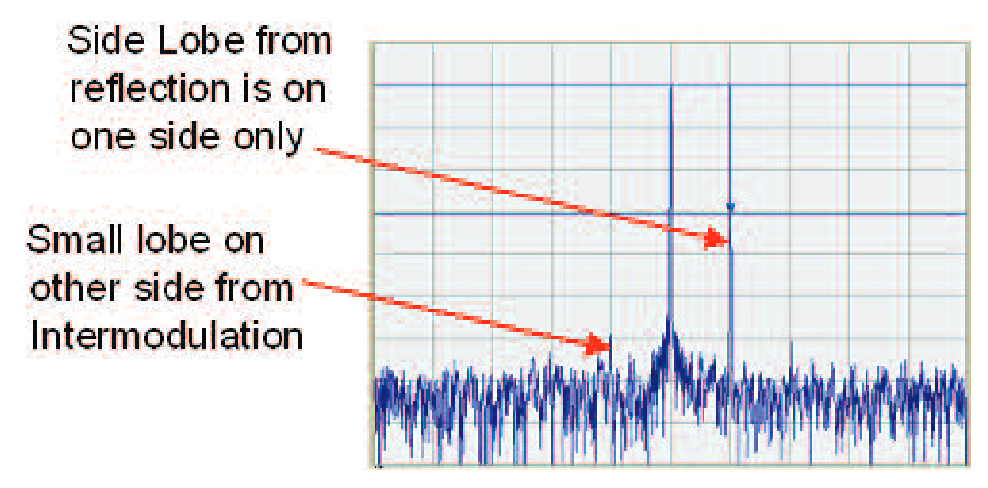
Other Modulation Types
Pulses can have other and more complex modulations applied. Higher order modulations such as QAM, OFDM, and even direct sequence spreading (like CDMA). These can spread the pulse spectrum, giving it less chance of discovery, and allow pulse compression in the receiver. They can even allow transmission of data contained within the radar pulses.
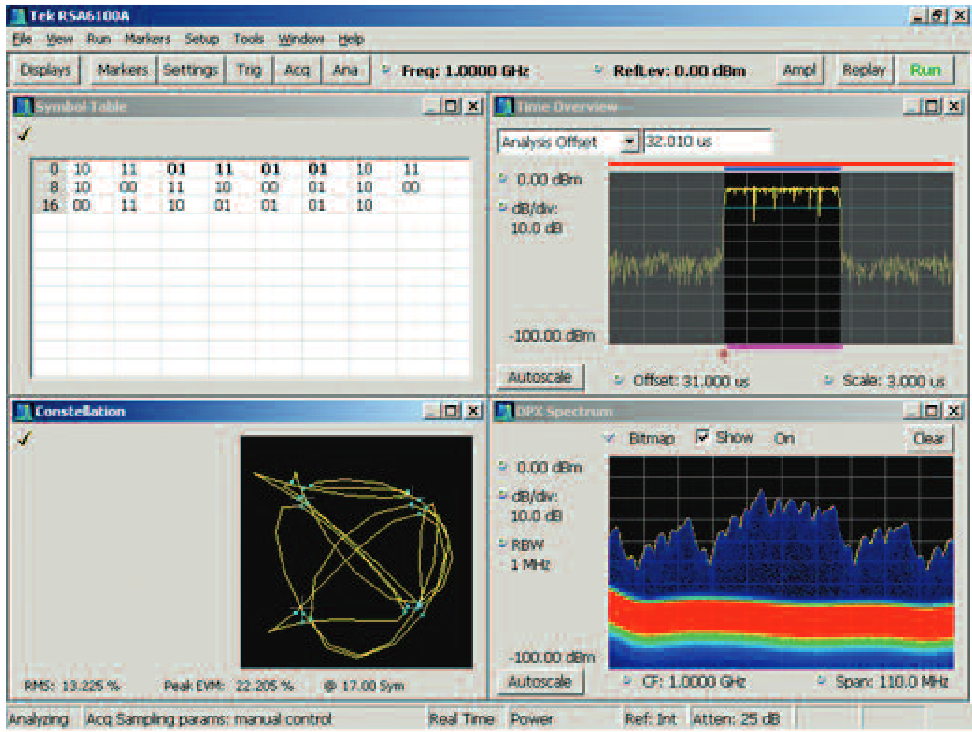
The General Purpose Modulation Analysis software has a generalpurpose digital demodulator which is applicable to pulses.
Pulses can be demodulated using the same mechanism as continuous or long-burst communications signals.
The modulation types available include: QPSK, 8PSK, DQPSK, π/4DQPSK, D8PSK, BPSK, 16QAM, 32QAM, 64QAM, 128QAM, 256QAM, MSK and GMSK. The demodulator requires that Symbol rate and filter type be entered. While this demodulation measurement requires a minimum of 21 symbols to perform its analysis, there is a trick which can be used to analyze short pulses. Simply set the symbol rate to an integer multiple of the actual rate. For example, if the symbol rate is 100 kHz (10 µs per symbol) within a 100 µs wide pulse, there will only be 10 actual symbols. The symbol rate can be set to 300 kHz, which will analyze 30 symbols in the pulse duration. Now the results will simply have three duplicate symbols listed for each one RF symbol.
The available results include Constellation and Symbol Table as in Figure 81, as well as EVM, Phase error and Magnitude error.
Center Frequency Offset Measurements
Measurements on hopping radar signals, measuring signals overthe-air, and even measuring signals in the presence of adjacent channel interference have typically represented a challenge for measurement systems. Traditionally, either modulation hopping was required to be turned off, or you were challenged to capture a pulse sequence at the center frequency to be able to analyze the radar signal.
The flexibility to measure signals that are not captured in the center of the analysis bandwidth can be extremely important in the analysis of the true hopping behavior of a radar. Figure 82 shows a frequency hopped pulse signal. By de-selecting the measurement frequency lock to the center frequency, a sliding measurement window appears so the user can easily select the frequency of the interest over the acquired spectrum.
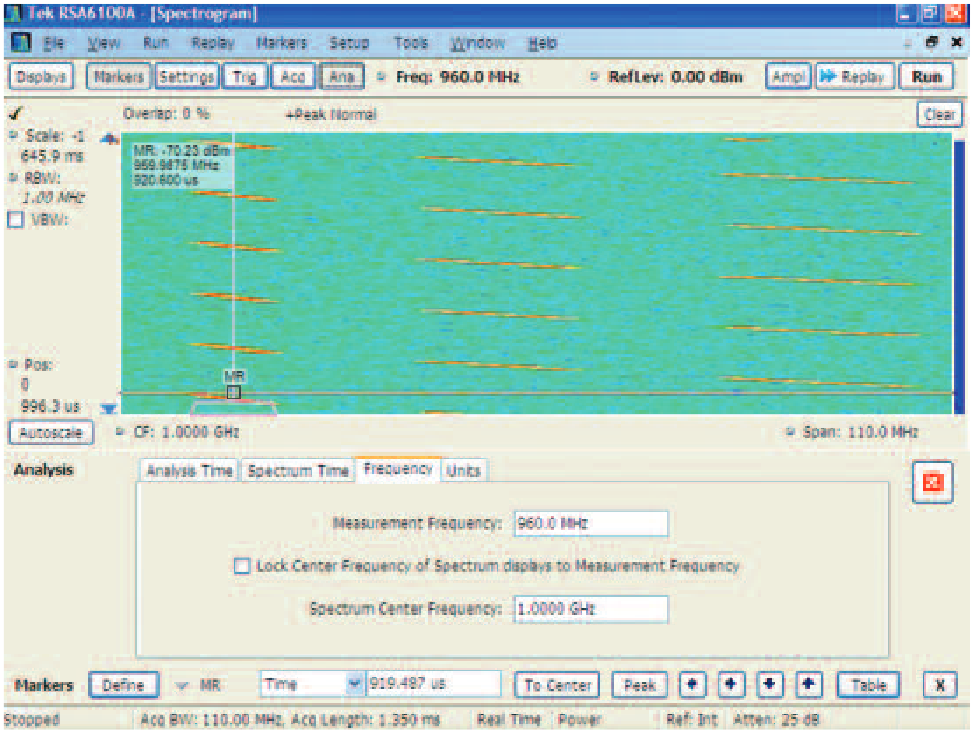
This signal is a pulsed hopping chirp radar signal that hops across three frequency channels sequentially. The measurement window has been selected to measure just the pulses in the acquired spectrum lowest in frequency.
Figure 83 demonstrates the results of the pulse signals occurring only in the selected measurement window. The subsequent frequency stepped pulses are not included in these measurement results. However, once the data has been captured into memory, the sliding measurement window can be positioned over the subsequent occupied hopping channels and the data can be “replayed” to calculate the results of the subsequent hops.
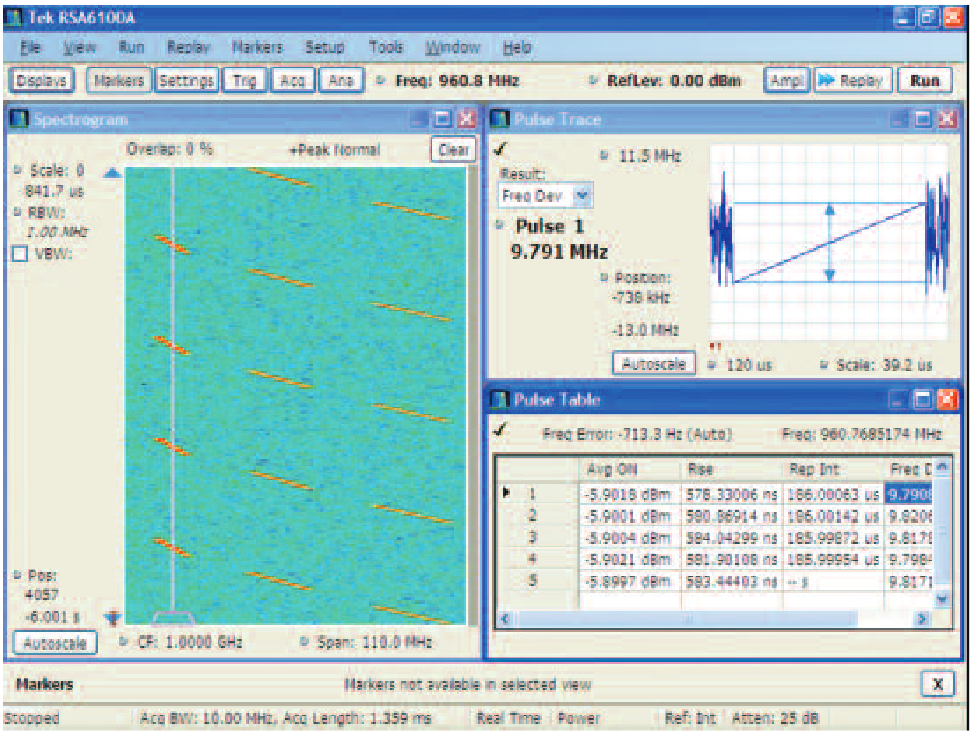
The flexibility of selecting a measurement window that is not at the center frequency is an invaluable method for over-the-air measurements and testing for problems with hopping radars that only manifest themselves during hopping conditions (such as frequency settling and timing issues).
Long Frame Measurements (Multiple Pulses)
Measurement of a single pulse is not usually sufficient to assure transmitter performance. Many pulses can be measured and if there are differences from one pulse to another, this by itself can be used to diagnose problems that may be otherwise difficult to find.
Table of Measured Values
The first view into such variations is the Pulse Table. When there are many pulses in one acquisition, the measured values can be arranged into a table as seen in Figure 84. The numeric values of all measurements are calculated for each acquisition. The user can select which measurements will be shown in the table. Each column contains the results from one parameter displayed sequentially for all the pulses which were measured. A new column is added for each additional parameter selected by the user.
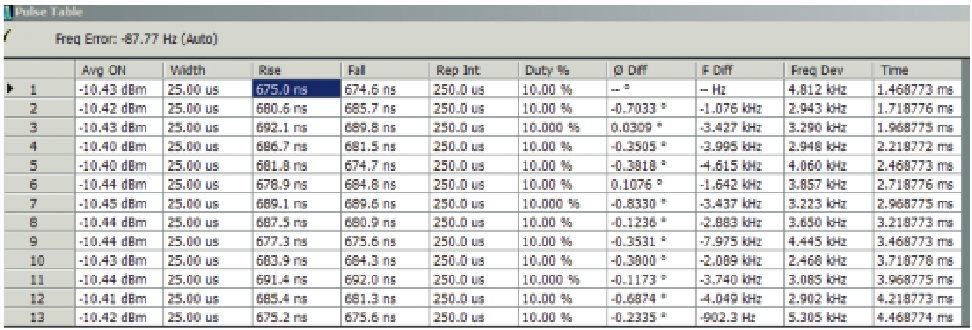
Measurement Trends
The table of measurement results helps to manually see if there is a difference in a measurement result. To more graphically see if there is a coherency with differing results, there is a plot of the trend of any results available to the table.
The results table shows variations in the pulse power of only about one tenth of a db amongst the pulses. Even though this is only an extremely slight variation, it may be significant. To see if there is some regularity to the results, the trend of results is plotted.
The trend plot plots one point for each pulse. This effectively removes the long time in between the pulses and gives a readable trend plot.
Figure 85 shows such a plot for the results of Average ON Power of a series of pulses. There is a pronounced periodicity in the pulse power being produced by this transmitter. If the variations were random, then, as small as they are, they might well be ignored by the receiver. But a periodic variation may well produce false target information, so there is a need to find the nature of the periodicity as well as the cause.
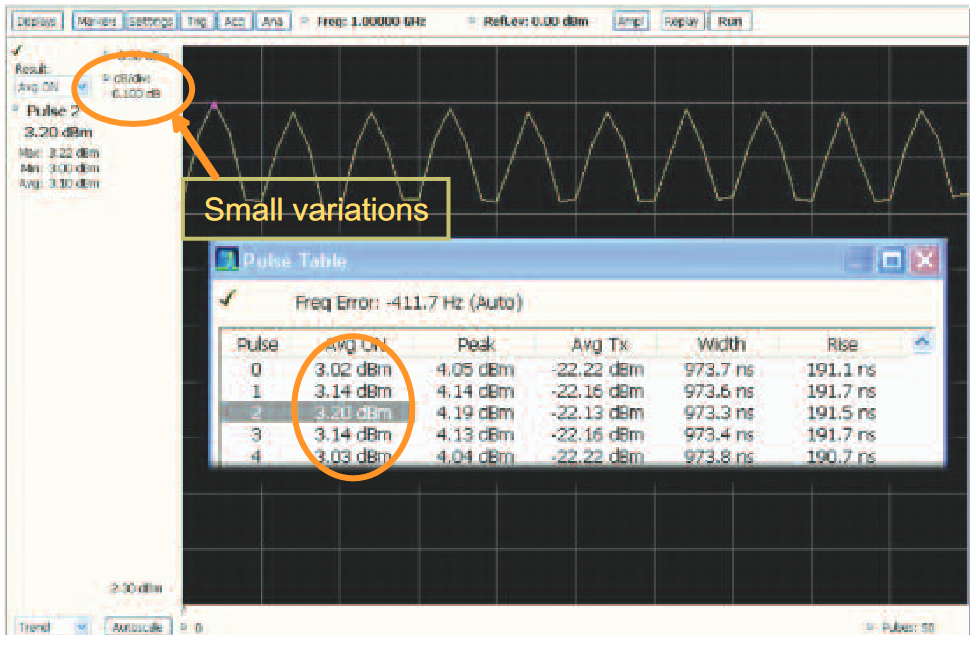
FFT of Measurement Results
The table of values is useful to manually see if there are anomalous readings for some pulses. The Pulse Trend plot graphically shows the character and magnitude of such variations. But to analyze these results and make a possible determination of the root cause for such variations requires further computations.
The method provided is an FFT of the tabular pulse measurement results. Figure 86 shows the process.
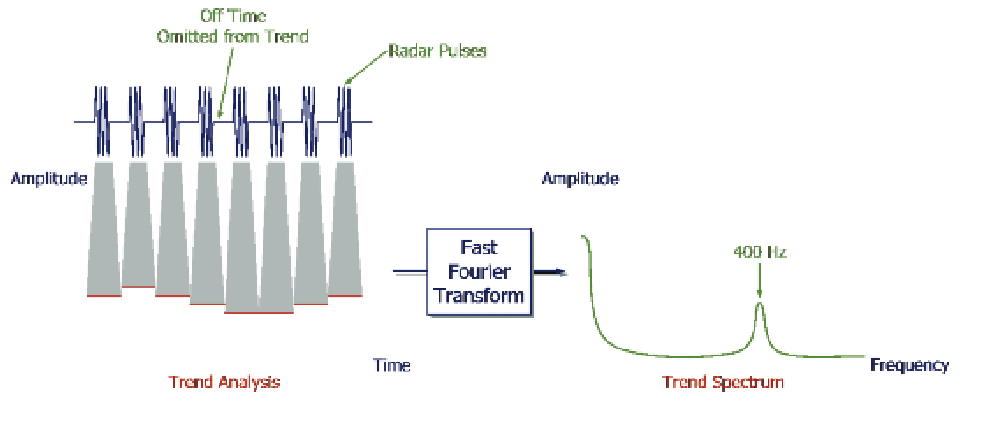
The drawing shows the FFT which might well have been from the previous trend plot. Here the 400 Hz primary power supply is modulating the transmit power. Having found a correlation between the variations and a possible cause, remedial action can now be taken.
Eliminating the OFF Samples
Some pulse systems use a very low duty cycle, and at the same time the measurements require many samples be taken for each pulse so as to provide high resolution of the measurements. For these cases, the huge number of samples that would be taken during the OFF time in between the pulses takes up an exorbitant amount of acquisition memory without providing any useful measurement information.
Since there is finite acquisition memory, this may severely limit the number of pulses which can be stored. Even if the Pulse Trend is used for viewing results, this does not help with the problem of availability of acquisition memory. The Pulse Measurement Software provides a method of eliminating these acquisition samples that are not needed.
FastFrame
The FastFrame acquisition mode in the RSA Series and oscilloscopes use the acquisition trigger to locate the start of incoming RF power and initiates capture into memory. The acquisition continues for the length of time entered by the user for the acquisition. This is one frame. In the control panel (as in Figure 87) there is also an entry for the number of acquisition frames to acquire before stopping.

Any of the normal real-time spectrum analyzer triggers can be used, such as Power Trigger or External Trigger. Since all acquisitions are time-stamped, using its internal system clock, any analysis performed on a FastFrame record (a collection of FastFrame acquisitions) will correctly measure the time between events that occur in different frames of the full record.
Measurements such as pulse period will be correct for pulses where the "OFF time" spans across different frames. Measurements that are reported in the pulse table will have an asterisk after them if they include inter-frame time. This alerts the operator that if a pulse indeed existed during the inter-frame time but the trigger system did not find it, then data from that pulse was not acquired. This would be the case if the missing pulse had had amplitude lower than the power trigger was set for, or if an external trigger were from a timer that did not provide triggers for every incoming pulse.
The FastFrame acquisition using an external trigger allows for a series of short acquisitions to be taken with extended time (even multiple days) between sequential frames.
Since the incoming power is not acquired at all during the inter-frame time, the Average Transmitted Power measurement is inhibited from providing an answer if the measurement time includes an inter-frame "OFF" time.
Pulse Spectrum
Ordinary FFT-based spectrum analyzers digitize a bandwidth and then use a discrete time transform to convert a segment of time to a spectrum plot. This means that a signal must remain stable for the entire FFT frame time if it is to produce a correct spectrum plot.
In most cases it is either difficult, or more often impossible to change the length of the FFT to allow a good spectrum plot of a pulse. The advanced signal analysis software has an easy method of effectively doing that. The Time Overview window allows setting both the time over which the particular analysis is called for is performed, and separately controlling the time window over which the spectrum analysis is performed.
When the spectrum analysis time is more than a frequency transform frame, multiple frames are analyzed and the results are combined into a single spectrum trace.
The analysis of the acquired series of chirped pulses is shown in Figure 88. The Time Overview window on the left shows a portion of the acquisition with amplitude plotted versus time. The clear section is the portion of the acquisition over which the analysis of pulses is performed.
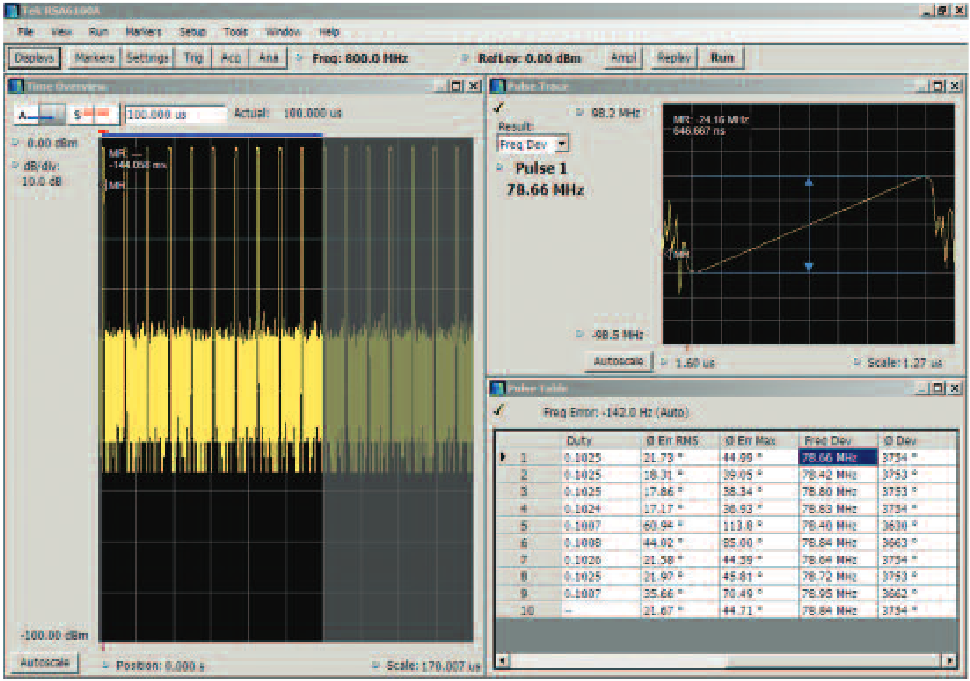
The grayed-out portion is the unused remainder of the original acquisition. The results of the analysis are in the table in lower right, and the upper right is the Pulse trace with Frequency Deviation versus time selected.
Next in Figure 89 the pulse trace is replaced with a spectrum plot. But after clicking on the "Replay" button to cause the current windows to re-analyze the stored record, the spectrum plot does not appear to show the spectrum of a pulse. It is analyzing a different portion of the digitized record.
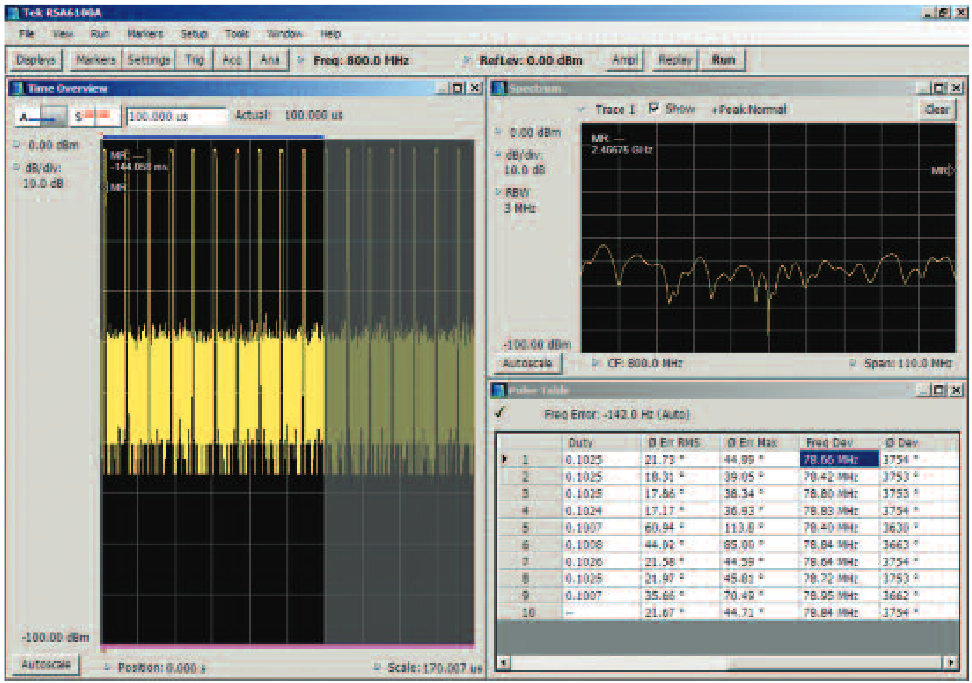
This analysis software allows independent selection of the time over which the pulse analysis is made, and the time over which the spectrum analysis is calculated. To adjust the spectrum time, click on the "S" box immediately above the Time Overview plot and to its left.
In Figure 90 the only part of the acquisition record not grayed out is on the very far left, and does not include only noise between pulses. This is why the spectrum shows only noise. Above the Time Overview there are two color stripes. The green one shows where the analysis time is located. And the red one on the far left shows the portion where the spectrum analysis is performed.
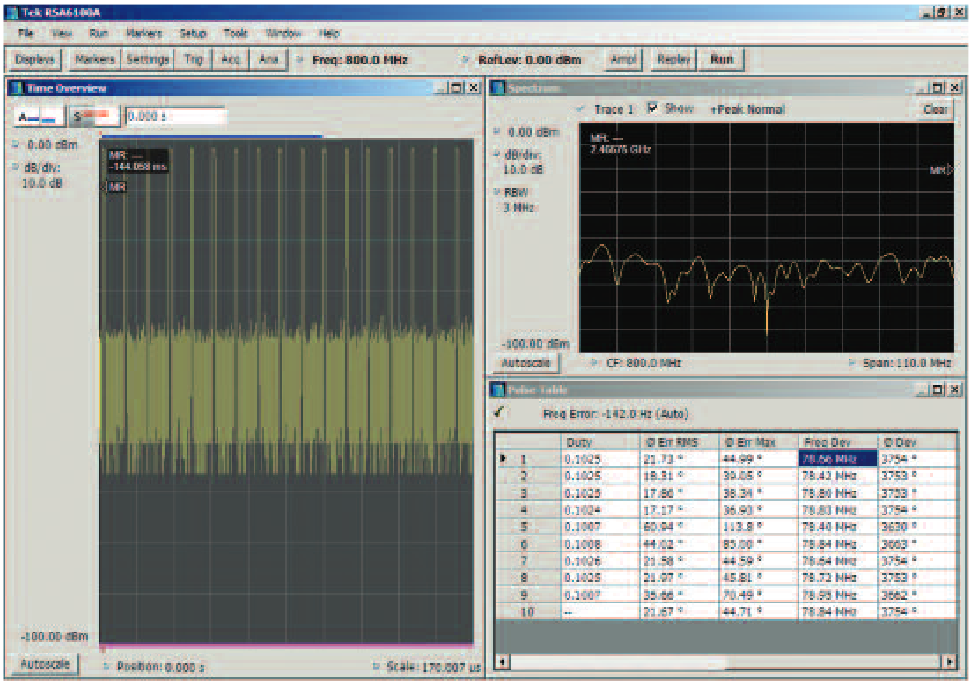
In the Time overview in Figure 91, the edges of the gray areas can be moved using the mouse, and place the spectrum analysis time window around only one pulse.
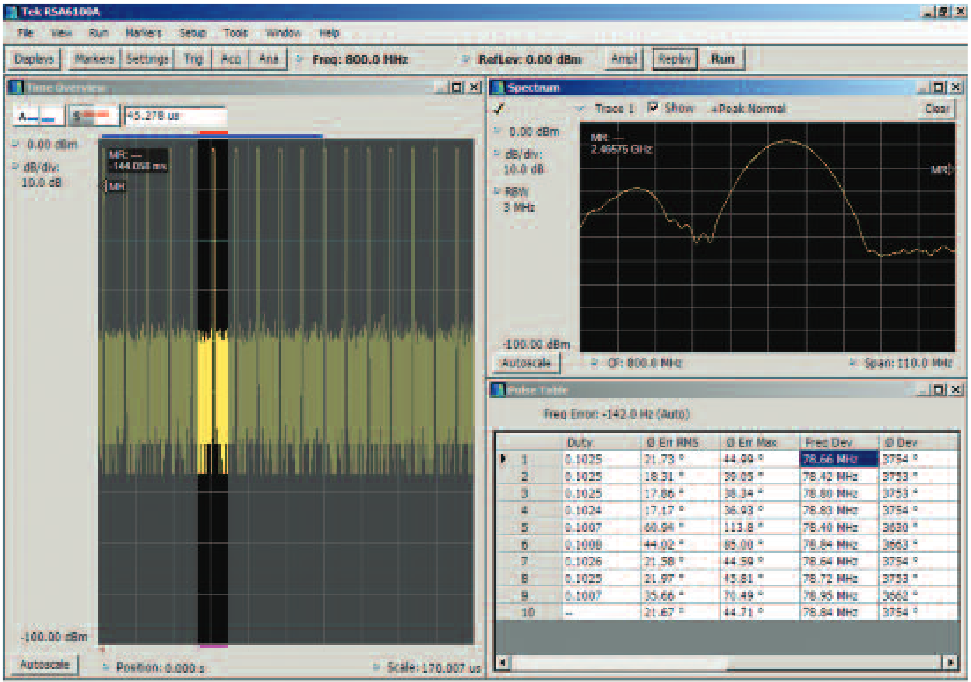
But the spectrum plot lacks detail, due to the resolution bandwidth default setting being too large (3 MHz) for this chirp. If the spectrum window is large enough to contain more than one spectrum frame, then these frames are combined into one spectrum for display. This makes the position of the spectrum frames important to obtain maximum spectrum plot detail, as the pulse spectrum can be reduced if the pulse is positioned near the end of a spectrum frame.
In Figure 92 the Resolution bandwidth is set to a more useful 150 kHz. Now there is a nice spectrum plot of just the one pulse.
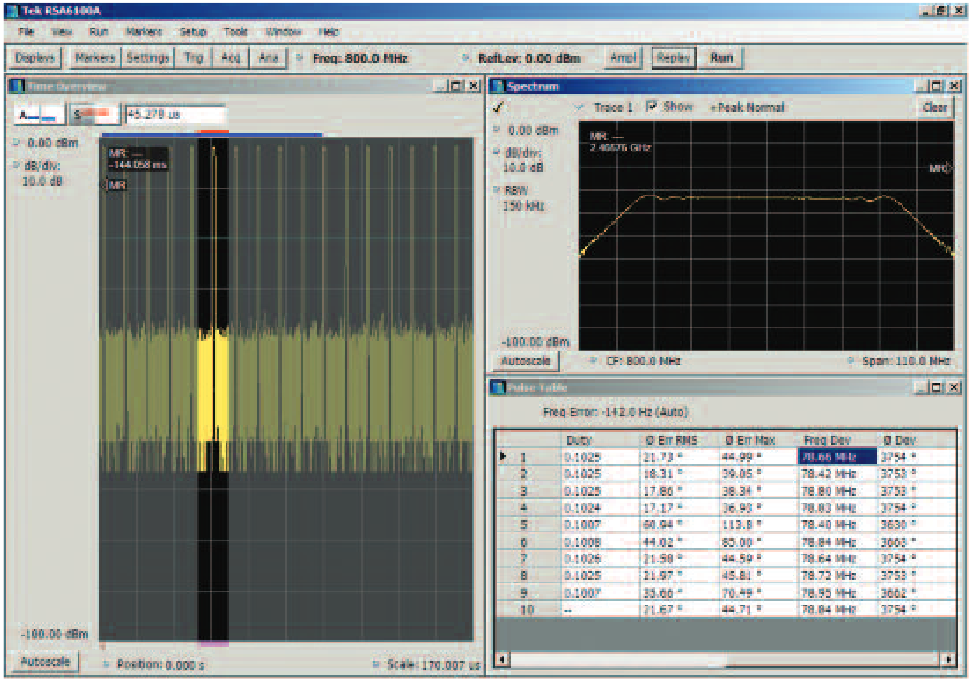
The Spectrum Analysis time window and time permit optimizing the spectrum plot for pulse measurements.
Note that in this case, there is a good spectrum plot, but the amplitude that it shows is lower than the real amplitude of the pulse. This is due to the fact that the pulse only fills a small portion of the FFT time window, and the displayed amplitude is proportionately lower.
If the spectrum time is made narrower, then the smaller number of samples available in that time will not support the 150 kHz Resolution Bandwidth, and the RBW will be automatically increased. The spectrum plot will then display a warning message that the RBW was automatically changed to fit the available number of samples. This will also not be an optimum spectrum plot.
Appendix 1. IF & Measurement Filters, and Filter Correction in the RSA Series
All the measurements made in the RSA6000 Series rely on getting signals which have passed through an IF frequency converter system. This system needs a filter in the IF so that only the conversion products of interest can get to the A/D converter. For the 110 MHz bandwidth option, this filter is approximately 120 MHz wide.
Due to the nature of frequency conversion schemes that are this wide, the filter used must have relatively sharp frequency response roll-off at the filter edges.
Most of the measurements internal to the RSA Series will be degraded if both the amplitude and the phase do not have flat response wherever any signal will pass. To achieve this, there is a calibration mechanism which creates a filter that is the exact opposite of the IF filter in the areas of interest.
The correction filters are re-calculated at instrument power-up by enabling an internal calibrated wideband digital spread-spectrum signal source. This is passed through the IF and converter system, digitized, and processed to generate new coefficients for the IF correction filter as necessary. This internal adjustment is performed again if the internal instrument temperature changes more than 5 degrees.
Figure 93 shows how the correction filters are cascaded with the IF filter to flatten the IF response. This result still has as much as 40% pulse overshoot. For the purposes of pulse measurements there is a need for a Gaussian response filter to minimize this overshoot on a pulse. This Gaussian filter can be cascaded beyond the corrector to flatten pulse response at the expense of bandwidth.
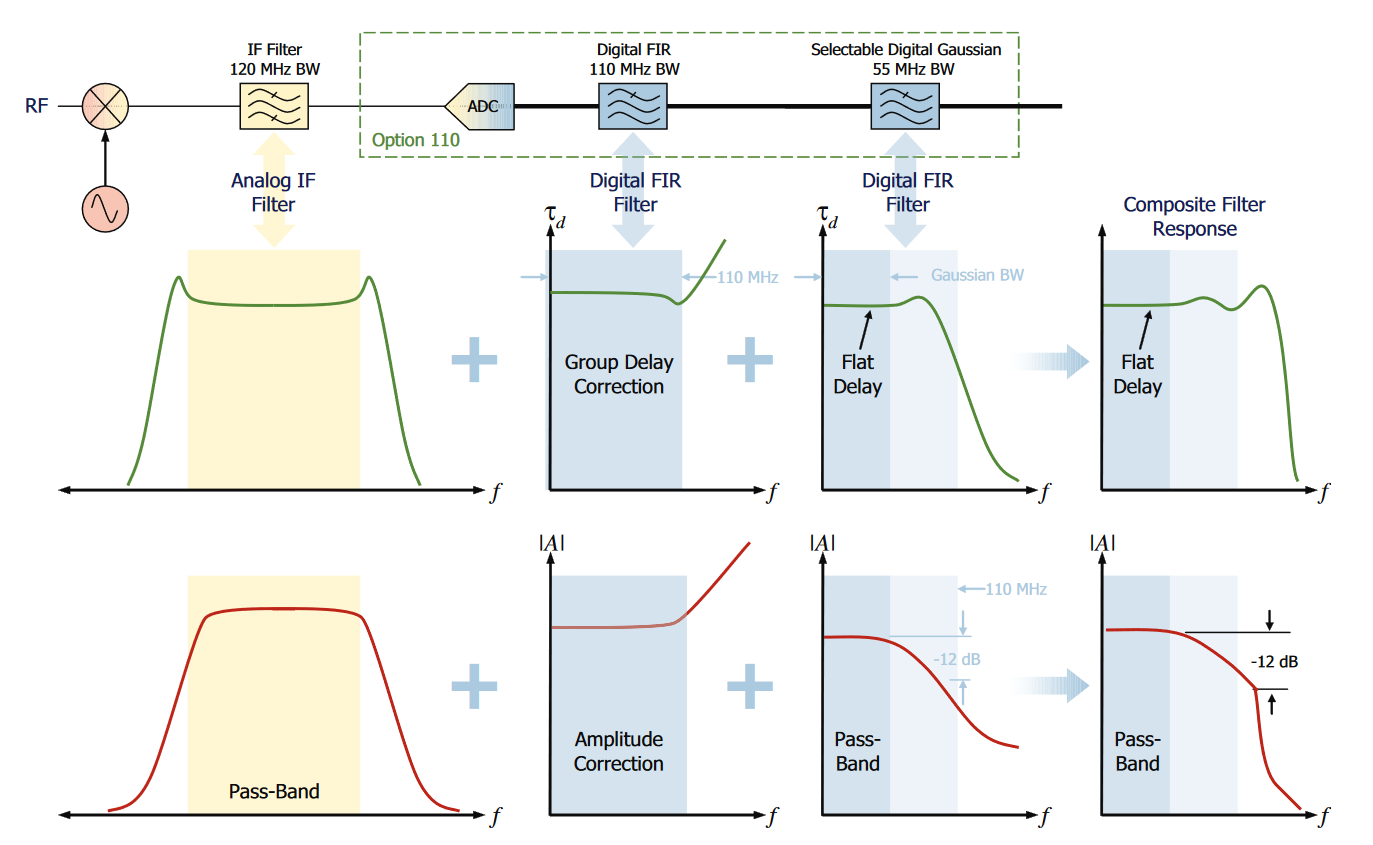
On the far right of Figure 93 is a representation of the resultant overall response of the filter through which all pulses must pass before being measured.
Find more valuable resources at TEK.COM
Copyright © Tektronix. All rights reserved. Tektronix products are covered by U.S. and foreign patents, issued and pending. Information in this publication supersedes that in all previously published material. Specification and price change privileges reserved. TEKTRONIX and TEK are registered trademarks of Tektronix, Inc. All other trade names referenced are the service marks, trademarks or registered trademarks of their respective companies.
07/16 37W-22065-4

