Contact us
Live Chat with Tek representatives. Available 6:00 AM - 4:30 PM
Call us at
Available 6:00 AM – 5:00 PM (PST) Business Days
Download
Download Manuals, Datasheets, Software and more:
Feedback
TekScope Anywhere™ Offline Analysis Datasheet
Collaborate - Measure, Analyze, Document - Offline
The products on this datasheet are no longer being sold by Tektronix.
View Tektronix Encore for reconditioned test equipment.
Check support and warranty status for these products.
TekScope Anywhere™ brings the power of the oscilloscope analysis environment to the PC. Users now have the flexibility to perform analysis tasks including timing, eye, and jitter analysis outside the lab. Waveform data and setups from Tektronix DPO/MSO5000, DPO7000C, or DPO/MSO70000C/D/DX/SX and waveform data from DPO/MDO3000 and DPO/MDO4000 Series oscilloscopes can quickly be shared between team members and remote sites, resulting in improved efficiency.
Key features
-
Collaborate
- TekScope Anywhere™ runs on your PC- Enabling better time and resource utilization; view, measure, and analyze data captured in your lab, independent of the oscilloscope hardware
- Composite Save/Recall Format- More accurate and repeatable results with composite Save/Recall files with both instrument setup and waveform data from your Tektronix DPO/MSO5000, DPO7000C, or DPO/MSO70000C/D/DX/SX Series oscilloscope
- Compatible With Most Common Save/Recall Waveform Files- - Common analysis tools independent of the hardware acquisition, including; Tektronix, LeCroy, or Keysight oscilloscope formats.
-
Analyze
- 50+ Parametric and Cursors Measurements- Test results confidence
- Common measurement library with your Tektronix Oscilloscope so results correlate
- Jitter Decomposition (Advanced Jitter Analysis version required)- Faster Time-to-Answer; Conduct jitter analysis on your PC while traveling, in the lab, or at your customer's site; and get results that correlate with DPOJET
- Plots with zoom support - Interactive plots, including zoom functionality, enables isolation of DUT behavior including spectral content and jitter
- Plots with cursor support- Measure DUT performance, including eye height and eye width using cursors
- Arbitrary Filter Support- De-embed and embed cables, fixtures, or channel models using filters created with SDLA Visualizer
-
Document
- Waveform and plot annotations- Share detailed analysis results; measurements, anomalies and points of interest for future reference, collaboration with suppliers, or communicating with team
- Reports- Easily document measurement results and configuration details with detailed test report
- Custom Display configuration- Group plots in multiple configurations with stacked or overlaid waveform view
Applications
- Compliance and Characterization- parametric measurements and jitter analysis for high speed serial interfaces
- Debug- share waveforms, measurements, and configuration details among distributed team members or suppliers to root cause the source of failures
- Simulation - quickly compare the results of lab measurements and simulations using common measurements and data visualization views
SidebySide

TekScope Anywhere™ overview
As systems become more complex, solutions that are convenient to use outside the lab and that enable collaboration between sites and customers are needed. These needs range from easy ways to share data, the ability to run measurements outside the lab, and methods to correlation lab measurements with simulation results.
Collaborate
TekScope Anywhere™ runs on your PC, Enabling analysis of data captured in your lab. Sessions can easily be saved on your Tektronix Oscilloscope and recalled. In addition, to Tektronix waveforms other file formats are supported including, wfm, .isf, .csv, .h5, .tr0 enabling correlation.
Analyze
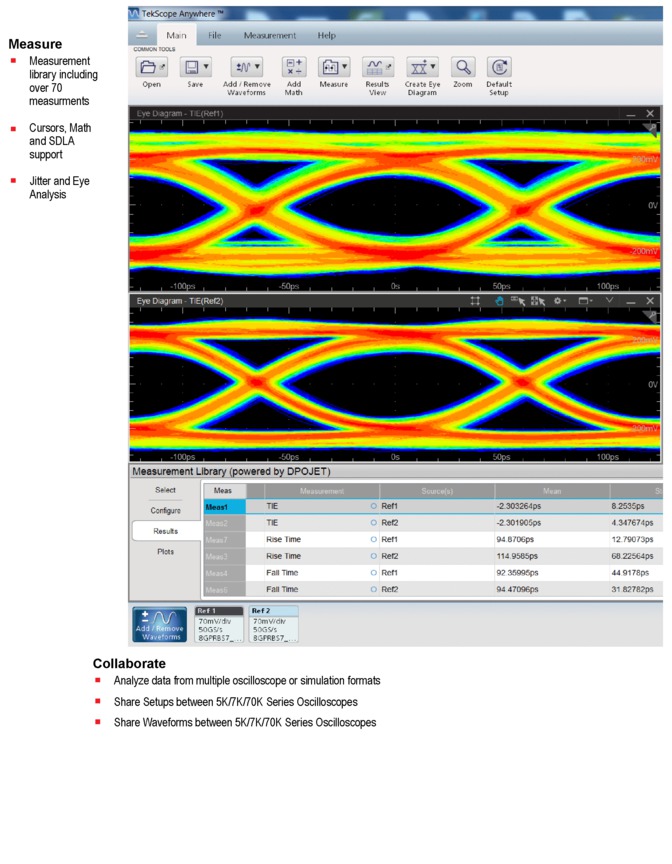
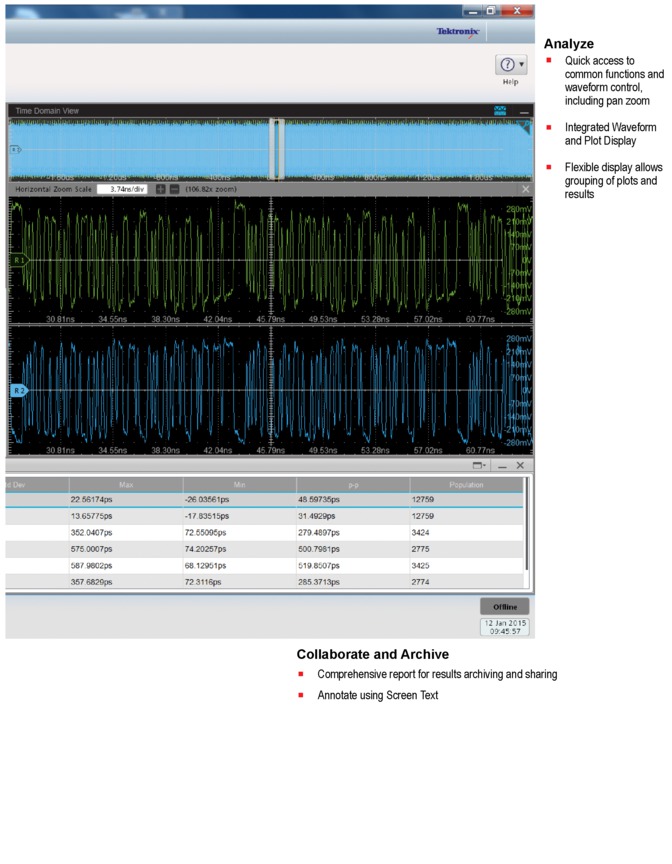
Measurement results use a common measurement library with your Tektronix oscilloscope so results correlate. TekScope Anywhere™ supports a range of measurements Including parametric, jitter and eye measurements. Plots can be customized and are interactive with Zoom and cursor controls allowing custom views to share.
Document
Results and views can be saved as a session file and archived for later use or sent to a colleague or supplier for a debug session. Alternatively, results can be archived and saved in .pdf or .mht format using the report generator. The report can be customized to include the information of interest including: configuration details, measurement results, and plots. Plot and measurement data can also be saved to a .csv format file for archiving or data analysis in external applications.
Collaboration and setup sharing
Sharing data acquired on the oscilloscope for offline analysis is easily supported with the TekScope session export utility and TekScope Anywhere™ offline analysis software. When sharing data for remote debug sessions or for archiving for future use it is often necessary to save the entire oscilloscope configuration including measurement configuration and waveform data. The session export utility on your Tektronix DPO/MSO5000, DPO7000C, or DPO/MSO70000C/D/DX/SX Series oscilloscope creates a single file with all the necessary information to recreate the setup for analysis using TekScope Anywhere™.
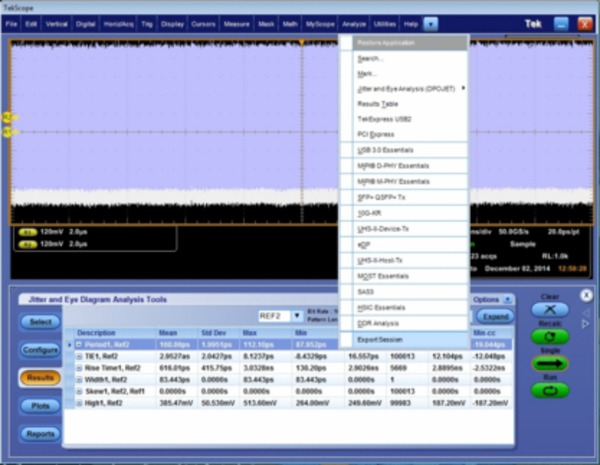
Export Session utility enables saving the instrument state from a Tektronix DPO/MSO5000, DPO7000C, or DPO/MSO70000C/D/DX/SX oscilloscope for use on TekScope Anywhere™

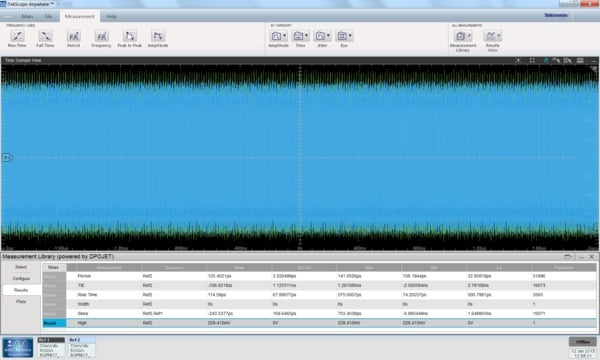
Oscilloscope setup recalled on TekScope Anywhere™
Reports for data archive
After analysis is complete a report can be generated to share or archive. Options, including the ability to include plots or configuration details, allow the user to specify the information that goes in the report. Reports can be archived as an .mht or .pdf file.
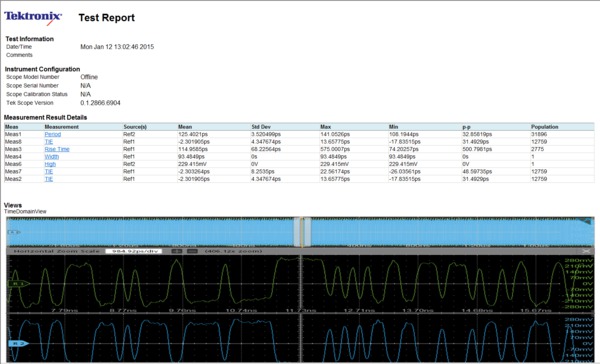
Complete test report includes setup details, measurement configuration and results, and plots
Waveform correlation between lab or simulation results
A common issue that arises when taking lab measurements is correlation between instrumentation and simulation. The source of differences can be related to a difference in measurement algorithms. TekScope Anywhere™ allows the user to import multiple waveform formats from different sources, including .wfm, .csv, .bin, .trc, and .tr0, enabling the use of common analysis tools, eliminating the differences due to differing analysis tools. For example, the user can simultaneously compare the eye opening of a waveform captured in the lab vs. a simulated waveform or waveform captured on a different oscilloscope.
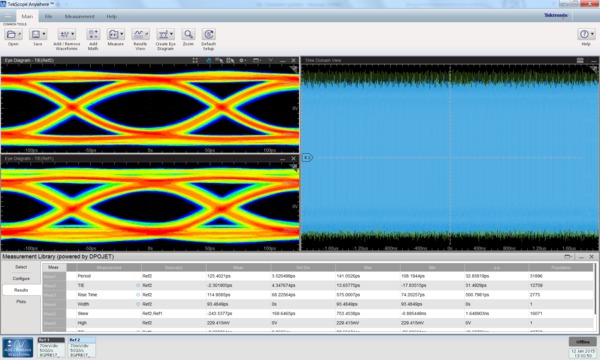
Side by side analysis of lab measurements vs. simulation in a common view
Customizable display
Waveform analysis is no longer constrained to a single oscilloscope display, TekScope Anywhere™ allows the user to be in control of their analysis environment.
Two options are available for waveform viewing, overlay mode as shown in the image on the left or stacked mode as shown in the images below. The user can simply toggle between the two modes based on the required analysis. For example, when looking at edge crossings between two data signals, overlay mode may be preferred. As the number of waveforms grows, stacked mode is typically preferred.
Other scenarios require the evaluation of waveforms and plot data, including eye diagrams, spectrums, bathtub plots, or histograms. Plots can be viewed in the same window as the waveform or in cases where additional screen real estate is needed a group of plots can be created and displayed on a second monitor. Within the group of plots, the user has the flexibility to customize the layout by simply dragging and dropping the plots within the display. For example, as shown below when viewing the jitter spectrum or FFT of a waveform, a stacked view may be preferred. Alternatively, a side by side view is also possible.
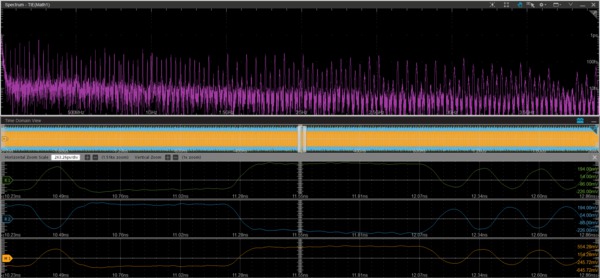
Stacked view of time domain waveform and jitter spectrum
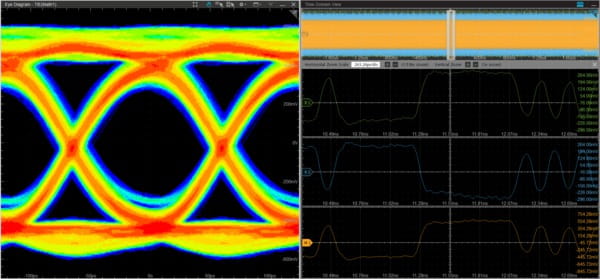
Side-by-side view of eye diagram and waveforms shown in individual views
In the event that a single display is not sufficient to view the necessary plots, they can quickly be grouped and moved to a second monitor. Once grouped, the user has the flexibility to customize the layout and the ability to view the plots in either tabbed or grid mode. Tabbed mode provides a maximized view of an individual plot while allowing the user to click on the other tabs to toggle between the plots. Grid mode provides a single view of all the plots in the group. The following two images contain the same group of plots, however, the top image is in tabbed mode and the bottom image is in grid mode. The user can quickly toggle between the two modes using the icons on the group toolbar.
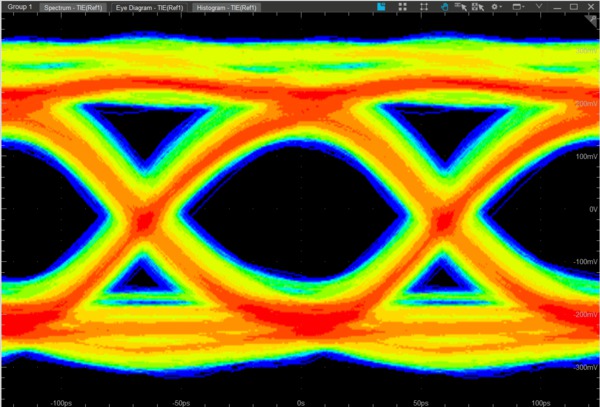
Plot group with Eye Diagram, Spectrum, and Histogram shown in tabbed view
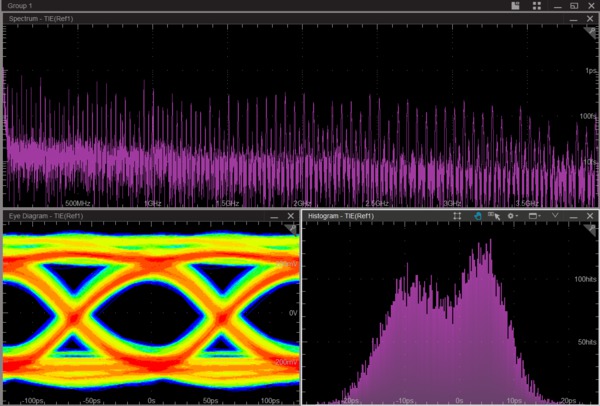
Plot group with Eye Diagram, Spectrum, and Histogram shown in grid view
Waveform zoom and cursors
Interactive plots with zoom and cursors
Plots provide a deep level of understanding of system behavior. It is often desired to zoom in on plot data, some common reasons to zoom on plots include placing cursors to take measurements at precise locations on an eye diagram or to view jitter at a specific frequency. Many of today's high speed serial interfaces use Spread Spectrum Clocking (SSC), resulting in low frequency jitter around 33 kHz. By default a spectral plot will show the entire jitter content of the signal, however, it is often desired to look at a specific range of spectral content. Zooming enables precise viewing of the portion of the plot of interest. While zoomed in the overview window always provides context of the zoomed area in relation to the entire plot.
Cursor support for plots and waveforms can provide additional measurement details. For example, the eye height and eye width of a waveform can be determined using cursors, or the eye opening at a specific BER level can be determined by evaluating the bathtub plot.
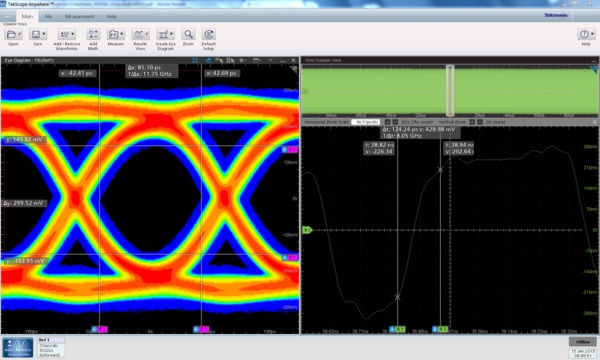
Cursor measurements with prominent readouts provide quick results for both plot and waveform data
De-embed, Embed, and Equalize
With today's high speed serial interfaces, it is often necessary to apply post processing to the acquired waveform before measurements are taken. For measurements at the near end or transmitter output, it is common to de-embed the effects of the measurement circuit. Using SDLA Visualizer on a Tektronix 70K Series Oscilloscope, de-embed filters can be created and then used in TekScope Anywhere™.
Likewise, when doing far end measurements or measurements at the receiver, it is necessary to apply equalization and in some cases embed channel properties. CTLE equalization filters, created by SDLA Visualizer, can open closed eyes in TekScope Anywhere™.
Key capabilities
TekScope Anywhere is available in two versions: Basic and Advanced Jitter. The table below provides a quick summary of each version.
| Capability | Basic version | Advanced Jitter Analysis version |
|---|---|---|
| View and annotate unlimited waveforms and plots | ✓ | ✓ |
| Zoom on waveforms and plots | ✓ | ✓ |
| Share sessions | ✓ | ✓ |
| Generate reports | ✓ | ✓ |
| >50 Amplitude and timing measurements with statistics | ✓ | ✓ |
| Measurement gating | ✓ | ✓ |
| Eye diagrams and clock recovery | ✓ | ✓ |
| Export plot data to .csv | ✓ | ✓ |
| TIE Time Trend and Histogram Plots | ✓ | ✓ |
| RJ/DJ Jitter separaton | ✓ | |
| Jitter spectrum and bathtub plots | ✓ |
TekScope Anywhere with Advanced Jitter Analysis uses the same DPOJET measurement framework available on Tektronix oscilloscopes. Comprehensive jitter and eye-diagram analysis, along with decomposition algorithms, simplify the discovery of signal integrity and jitter problems in today's high-speed serial, digital, and communication system designs.
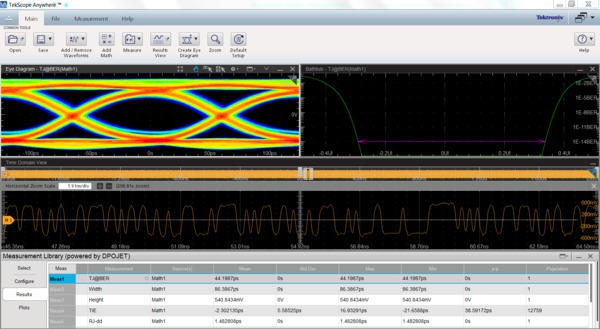
Jitter and Eye analysis of a PCI Express Gen 3 link
Specifications
General
- Time measurements
- Period, Frequency, Rise Time, Fall Time, Rise Slew Rate, Fall Slew Rate, High Time, Low Time, + Width, - Width, Setup, Hold, Skew, N-Period, + Duty Cycle, - Duty Cycle, CC-Period, + CC-Duty, - CC-Duty, SSC Profile, SSC Frequency Deviation, SSC Frequency Deviation Minimum, SSC Frequency Deviation Maximum, SSC Modulation Rate, Time Outside Level
- Amplitude measurements
- Amplitude, Max, Min, High, Low, DC Common Mode, AC Common Mode, Cycle Overshoot, Cycle Undershoot, Peak to Peak, RMS, AC RMS, Cycle RMS, + Overshoot, - Overshoot, Mean, Cycle Mean, Cycle Min, Cycle Max, V-Diff-Xovr, Cycle Pk-Pk, T/nT Ratio, Bit High, Bit Low, Bit Amplitude
- Jitter measurements
- TIE, Phase Noise
- Jitter measurements (Advanced Jitter Analysis Version)
- TIE, RJ, RJdd, TJ@BER, DJ, DJdd, PJ, DDJ, DCD, J2, J9, SRJ, F/N
- Eye measurements (Advanced Jitter Analysis Version)
- Width, Width@BER, Height, Height@BER, Eye High, Eye Low, QFactor
- Plots
-
Histogram, Spectrum*, Eye Diagram, Bathtub*, Time Trend
(plots with * only available in Advanced Jitter Analysis Version)
- Supported math functions
-
+, -, *, /, Integral, Derivative, Arbfilt, FFT Magnitude and Phase
- Advanced math functions
-
^, <, <=, >, >=, ==, !=, Inv, (, ), Time Point Gating ( GATE {y1,y2} expression ), log, ln, Exp, Sqrt, Floor, Ceil, Fabs, Sin, Cos, Tan, Asin, Acos, Atan, Sinh, Cosh, Tanh, Intg, Diff, Min, Max, Avg, - (negate)
- Supported waveform types
-
.wfm, .isf (Tektronix)
.bin (Keysight)
.trc (Lecroy)
.tr0 (Spice)
.h5 (Simulation)
.csv (general purpose)
- Waveform Controls
-
- Zoom
- Horizontal or Horizontal and Vertical
- Cursors
- Waveform or Screen
- Plot controls
-
- Zoom
- Horizontal or Horizontal and Vertical
- Cursors
- Waveform or Screen
- Number of views
-
- Waveform Views
- 1 with the ability to configure in stacked or overlay mode. Up to 12 waveforms can be viewed simultaneously
- Available outputs
-
- Report
- Comprehensive report with measurement results, plots, and system configuration details available in .pdf or .mht formats
- Composite Setup
- Single file for saving waveforms, measurements, and configuration details
- Plot and Measurement Data
- -Export plot and measurement data in .csv formats
Minimum system configuration
- System requirements
-
Intel® Pentium® 4 or AMD Athlon® 64 processor (2 GHz or faster)
64-bit Windows 7 SP1, Windows 8, or Windows 8.1
4 GB of RAM, 8 GB Recommended
5 GB of available hard disk space, 10 GB recommended (exact space is dependent on the number of waveforms and their size)
1366x768 display (1920x1080 recommended)
OpenGL® 2.0, 32-bit color, and 1 GB of VRAM
Ordering information
The TekScope Anywhere ™ software can be downloaded from http://www.tek.com/oscilloscope/tekscope-anywhere-waveform-analysis-software.Software is enabled by a license file. The Basic Version is available with node-locked licenses. The Advanced Jitter Analysis version is available with node-locked and floating licenses. Node-locked licenses are tied to a specific PC. Floating licenses can be shared between multiple PCs.
Basic version
| Product | Description |
|---|---|
| TekScopeNL-BAS | TekScope Anywhere™ Waveform Analysis and Visualization - Node Locked License |
| TekScopeFL-BAS | TekScope Anywhere™ Waveform Analysis and Visualization - Floating License |
Advanced Jitter Analysis version
| Product | Description |
|---|---|
| TekScopeNL-DJA | TekScope Anywhere Waveform Analysis and Visualization with Advanced Jitter Analysis - Node Locked License |
| TekScopeFL-DJA | TekScope Anywhere Waveform Analysis and Visualization with Advanced Jitter Analysis - Floating License |
For users of Tektronix DPO/DSA/MSO70000C/D/DX, DPO7000C, or DPO/MSO5000 Series Oscilloscopes who wish to share their floating licenses between TekScope Anywhere™ and their oscilloscope
| Product | Description |
|---|---|
| DPOFL-DJA | DPOJET Jitter and Eye Analysis floating license for use with TekScope Anywhere™ or DPO/DSA/MSO70000C/D/DX/SX, DPO7000C, or DPO/MSO5000 Oscilloscopes Note: TekScopeNL-BAS is required when the license is used on a PC |


