
Contact us
Live Chat with Tek representatives. Available 6:00 AM - 4:30 PM
Call
Call us at
Available 6:00 AM – 5:00 PM (PST) Business Days
Download
Download Manuals, Datasheets, Software and more:
Feedback
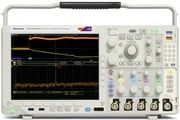
MDO4000B Mixed Domain Oscilloscopes - Datasheet
MDO4000B Datasheet (Replaced by MDO4000C)
The products on this datasheet are no longer being sold by Tektronix.
View Tektronix Encore for reconditioned test equipment.
Check support and warranty status for these products.
MDO4000B Datasheet (Replaced by MDO4000C)
Replaced by MDO4000C.
*
Introducing the world's first oscilloscope that includes a logic analyzer, spectrum analyzer and protocol analyzer - all synchronized for an integrated view. Although you can use the MDO4000B Series simply as a mixed signal oscilloscope or as a spectrum analyzer, the real power comes from the integration of the two. For the first time ever, you can see how your designs perform in both the time and frequency domains on a single instrument. View the RF spectrum at any point in time to see how it changes over time or with device state. Solve the most complicated design issues, quickly and efficiently, with an oscilloscope as integrated as your design.
Winner of 13 industry awards
Key performance specifications
- 4 analog channels
- 1 GHz, 500 MHz, 350 MHz, and 100 MHz bandwidth models
- Up to 20 M record length on all channels
- >340,000 wfm/s maximum waveform capture rate
- 16 digital channels
- MagniVu™ high-speed acquisition provides 60.6 ps fine timing resolution
- 1 spectrum analyzer channel
- 9 kHz to 3 GHz or 9 kHz to 6 GHz frequency range models
- Ultra-wide capture bandwidth ≥1 GHz
- Standard passive voltage probes with 3.9 pF capacitive loading and 500 MHz or 1 GHz analog bandwidth
Key features
- Mixed signal design and analysis
- Automated triggering, decode, and search on serial and parallel buses
- Per-channel threshold settings
- Multichannel setup and hold triggering
- Spectral analysis
- Dedicated front-panel controls for commonly performed tasks
- Automated peak markers identify frequency and amplitude of spectrum peaks
- Manual markers
- Trace types include: Normal, Average, Max Hold, and Min Hold
- Detection types include: +Peak, -Peak, Average, and Sample
- Spectrogram display for insight into slowly changing RF phenomena
- Automated measurements include: Channel Power, Adjacent Channel Power Ratio (ACPR), and Occupied Bandwidth (OBW)
- Trigger on RF power level
- Mixed-domain and analysis
- Time-correlated analog, digital, and RF signal acquisitions in a single instrument
- Wave Inspector® controls provide easy navigation of time-correlated data from both the time and frequency domains
- Amplitude, frequency, and phase vs. time waveforms derived from spectrum analyzer input
- Selectable spectrum time to see how RF spectrum changes over time - even on a stopped acquisition
- Optional serial triggering and analysis - serial protocol trigger, decode, and search for I2C, SPI, USB, Ethernet, CAN, LIN, FlexRay, RS-232/422/485/UART, MIL-STD-1553, and I2S/LJ/RJ/TDM
- 264 mm (10.4 inches) bright XGA color display
- Small footprint and lightweight - Only 147 mm (5.8 inches) deep and 5 kg (11 lb.)
Connectivity
- Two USB 2.0 host ports on the front panel and two on the rear panel for quick and easy data storage and connecting a USB keyboard
- USB 2.0 device port on the rear panel for easy connection to a PC or direct printing to a PictBridge®-compatible printer
- Integrated 10/100/1000BASE-T Ethernet port for network connection and video out port to export the oscilloscope display to a monitor or projector
Optional application support
- Advanced RF triggering
- Power analysis
- Limit and mask testing
- HDTV and custom video analysis
- Vector signal analysis
Need more performance?
| Need more bandwidth or record length? Need jitter analysis? Need to make serial bus compliance measurements? Consider the MSO/DPO5000B Series oscilloscopes, with leading performance and analysis for more advanced design verification. www.tektronix.com/MSO5000  ▪ Up to 2 GHz bandwidth ▪ Up to 250 M record length ▪ Automated jitter measurements standard ▪ Over 20 optional measurement applications available |
Introducing the Mixed Domain Oscilloscope
The MDO4000B Series is the world's first oscilloscope with a built in spectrum analyzer. This integration enables you to continue to use your debug tool of choice, the oscilloscope, to investigate frequency domain issues rather than having to find and re-learn a spectrum analyzer. However, the power of the MDO4000B Series goes well beyond simply observing the frequency domain as you would on a spectrum analyzer. The real power is in its ability to correlate events in the frequency domain with the time domain phenomena that caused them.
When both the spectrum analyzer and any analog or digital channels are on, the oscilloscope display is split into two views. The upper half of the display is a traditional oscilloscope view of the Time Domain. The lower half of the display is a Frequency Domain view of the spectrum analyzer input. Note that the Frequency Domain view is not simply an FFT of the analog or digital channels in the instrument, but is the spectrum acquired from the spectrum analyzer input.
Another key difference is that with traditional oscilloscope FFTs, you can typically either get the desired view of the FFT display, or the desired view of your other time domain signals of interest, but never both at the same time. This is because traditional oscilloscopes only have a single acquisition system with a single set of user settings such as record length, sample rate, and time per division that drive all data views. But with the MDO4000B Series, the spectrum analyzer has its own acquisition system that is independent, but time correlated, to the analog and digital channel acquisition systems. This allows each domain to be configured optimally, providing a complete time correlated system view of all analog, digital, and RF signals of interest.
The spectrum shown in the Frequency Domain view is taken from the period of time indicated by the short orange bar in the time domain view – known as the Spectrum Time. With the MDO4000B Series, Spectrum Time can be moved through the acquisition to investigate how the RF spectrum changes over time. And this can be done while the oscilloscope is live and running or on a stopped acquisition.

The upper half of the MDO4000B Series display shows the Time Domain view of the analog and digital channels, while the lower half shows the Frequency Domain view of the spectrum analyzer channel. The orange bar - Spectrum Time - shows the period of time used to calculate the RF spectrum.
Figures 1 through 4 show a simple everyday application – tuning of a PLL. This application illustrates the powerful connection between the time domain and the frequency domain that the MDO4000B Series provides. With its wide capture bandwidth and ability to move Spectrum Time throughout the acquisition, this single capture includes the same spectral content as approximately 1,500 unique test setups and acquisitions on a traditional spectrum analyzer. For the first time ever, correlating events, observing interactions, or measuring timing latencies between the two domains is exceptionally easy, giving you quick insight to your design’s operation.

Figure 1 - Time and Frequency Domain view showing the turn-on of a PLL. Channel 1 (yellow) is probing a control signal that enables the VCO. Channel 2 (cyan) is probing the VCO tune voltage. The SPI bus which is programming the PLL with the desired frequency is probed with three digital channels and automatically decoded. Notice Spectrum Time is placed after the VCO was enabled and coincident with the command on the SPI bus telling the PLL the desired frequency of 2.400 GHz. Note that the RF is at 2.5564 GHz when the circuit turns on.

Figure 2 - Spectrum Time is moved about 90 μs to the right. At this point, the spectrum shows that the PLL is in the process of tuning to the correct frequency (2.400 GHz). It has made it down to 2.4924 GHz.

Figure 3 - Spectrum Time is moved another 160 μs to the right. At this point the spectrum shows that the PLL has actually overshot the correct frequency and gone all the way down to 2.3888 GHz.

Figure 4 - The PLL eventually settles on the correct 2.400 GHz frequency about 320 μs after the VCO was enabled.
Built on the award-winning MSO4000B Series of Mixed Signal Oscilloscopes
The MDO4000B Series provides you with the same comprehensive set of features available in the MSO4000B Mixed Signal Oscilloscope Series. This robust set of tools will help you speed through every stage of debugging your design - from quickly discovering an anomaly and capturing it, to searching your waveform record for the event and analyzing its characteristics and your device's behavior.
Discover
To debug a design problem, first you must know it exists. Every design engineer spends time looking for problems in their design, a time-consuming and frustrating task without the right debug tools.
The industry’s most complete visualization of signals provides fast insight into the real operation of your device. A fast waveform capture rate – greater than 340,000 waveforms per second with FastAcq™ – enables you to see glitches and other infrequent transients within seconds, revealing the true nature of device faults. A digital phosphor display with color- and intensity-grading shows the history of a signal’s activity by using color or intensity in areas of the signal that occur more frequently, providing a visual display of just how often anomalies occur.

Discover ‒ Digital phosphor technology with FastAcq enables greater than 340,000 wfms/s waveform capture rate and real-time color-intensity grading.
Capture
Discovering a device fault is only the first step. Next, you must capture the event of interest to identify root cause.
Accurately capturing any signal of interest begins with proper probing. Low-capacitance probes are included with the oscilloscope, one for each analog channel. These industry-first high-impedance passive voltage probes have 3.9 pF of capacitive loading to minimize the effect of the probe on your circuit's operation, offering the performance of an active probe with the flexibility of a passive probe.
A complete set of triggers - including runt, timeout, logic, pulse width/glitch, setup/hold violation, serial packet, and parallel data - help you quickly find your event. With up to a 20M point record length, you can capture many events of interest, even thousands of serial packets, in a single acquisition for further analysis while maintaining high resolution to zoom in on fine signal details.
From triggering on specific packet content to automatic decode in multiple data formats, the oscilloscope provides integrated support for the industry's broadest range of serial buses - I2C, SPI, USB, Ethernet, CAN, LIN, FlexRay, RS-232/422/485/UART, MIL-STD-1553, and I2S/LJ/RJ/TDM. The ability to decode up to four serial and/or parallel buses simultaneously means you gain insight into system-level problems quickly.
To further help troubleshoot system-level interactions in complex embedded systems, the oscilloscope offers 16 digital channels in addition to its analog channels. Since the digital channels are fully integrated into the oscilloscope, you can trigger across all input channels, automatically time correlating all analog, digital, serial, and RF signals. The MagniVu™ high-speed acquisition on these channels enables you to acquire fine signal detail (up to 60.6 ps resolution) around the trigger point for precision timing measurements. MagniVu is essential for making accurate timing measurements for setup and hold, clock delay, signal skew, and glitch characterization.

Capture ‒ Triggering on a specific transmit data packet going across a SPI bus. A complete set of triggers, including triggers for specific serial packet content, ensures you quickly capture your event of interest.
Search
Finding your event of interest in a long waveform record can be time consuming without the right search tools. With today’s record lengths pushing beyond a million data points, locating your event can mean scrolling through thousands of screens of signal activity.
The innovative Wave Inspector® controls give you the industry’s most comprehensive search and waveform navigation capability. These controls speed panning and zooming through your record. With a unique force-feedback system, you can move from one end of your record to the other in just seconds. User marks allow you to mark any location that you may want to reference later for further investigation. Or, automatically search your record for criteria you define. Wave Inspector will instantly search your entire record, including analog, digital, serial-bus, and RF-versus-time data. Along the way it will automatically mark every occurrence of your defined event so you can quickly move between events.

Search ‒ RS-232 decode showing results from a Wave Inspector search for data value "n". Wave Inspector controls provide unprecedented efficiency in viewing and navigating waveform data.
Analyze
Verifying that your prototype’s performance matches simulations and meets the project’s design goals requires analyzing its behavior. Tasks can range from simple checks of rise times and pulse widths to sophisticated power loss analysis and investigation of noise sources.
The MDO4000B Series offers a comprehensive set of integrated analysis tools including waveform- and screen-based cursors, automated measurements, advanced waveform math including arbitrary equation editing, spectral math, FFT analysis, and trend plots for visually determining how a measurement is changing over time. Specialized application support for serial bus analysis, power supply design, and video design and development is also available.

Analyze – Waveform histogram of a falling edge showing the distribution of edge position (jitter) over time. Included are numeric measurements made on the waveform histogram data. A comprehensive set of integrated analysis tools speeds verification of your design's performance.
Digital phosphor technology with FastAcq™
Digital phosphor technology with FastAcq provides you with fast insight into the real operation of your device. Its fast waveform capture rate – greater than 340,000 wfms/s – gives you a high probability of quickly seeing the infrequent problems common in digital systems: runt pulses, glitches, timing issues, and more.
To further enhance the visibility of rarely occurring events, intensity grading is used to indicate how often rare transients are occurring relative to normal signal characteristics. There are four waveform palettes available in FastAcq acquisition mode.
- The Temperature palette uses color-grading to indicate frequency of occurrence with hot colors like red/yellow indicating frequently occurring events and colder colors like blue/green indicating rarely occurring events.
- The Spectral palette uses color-grading to indicate frequency of occurrence with colder colors like blue indicating frequently occurring events and hot colors like red indicating rarely occurring events.
- The Normal palette uses the default channel color (like yellow for channel one) along with gray-scale to indicate frequency of occurrence where frequently occurring events are bright.
- The Inverted palette uses the default channel color along with gray- scale to indicate frequency of occurrence where rarely occurring events are bright.
These color palettes quickly highlight the events that over time occur more often or, in the case of infrequent anomalies, occur less often.
Infinite or variable persistence choices determine how long waveforms stay on the display, helping you to determine how often an anomaly is occurring.

Digital phosphor technology enables a greater than 340,000 wfm/s waveform capture rate and real-time intensity grading.
Accurate high-speed probing
The TPP Series probes, included standard with every MDO4000B Series oscilloscope, provide up to 1 GHz of analog bandwidth, and 3.9 pF of capacitive loading. The extremely low capacitive loading minimizes adverse effects on your circuits and is more forgiving of longer ground leads. And, since the probe bandwidth matches or exceeds your oscilloscope bandwidth, you can see the high-frequency components in your signal which is critical for high-speed applications. The TPP Series passive voltage probes offer all the benefits of general-purpose probes like high dynamic range, flexible connection options, and robust mechanical design, while providing the performance of active probes. In addition, a low-attenuation, 2X version of the TPP probes is available for measuring low voltages. Unlike other low-attenuation passive probes, the TPP0502 has high bandwidth (500 MHz) as well as low capacitive loading (12.7 pF).
Mixed signal design and analysis
The MDO4000B provides 16 digital channels which are tightly integrated into the oscilloscope's user interface. This simplifies operation and makes it possible to solve mixed-signal issues easily.

The MDO4000B Series provides 16 integrated digital channels enabling you to view and analyze time-correlated analog and digital signals.
Color-coded digital waveform display
This oscilloscope has redefined the way you view digital waveforms. One common problem shared by both logic analyzers and mixed-signal oscilloscopes is determining if data is a one or a zero when zoomed in far enough that the digital trace stays flat all the way across the display. Color-coded digital traces display ones in green and zeros in blue.
The multiple transition detection hardware shows you a white edge on the display when the system detects multiple transitions. White edges indicate that more information is available by zooming in or acquiring at faster sampling rates. In most cases zooming in will reveal the pulse that was not viewable with the previous settings. If the white edge is still present after zooming in as far as possible, this indicates that increasing the sample rate on the next acquisition will reveal higher frequency information than the previous settings could acquire.
You can group digital waveforms and enter waveform labels by using a USB keyboard. By simply placing digital waveforms next to each other, they form a group.

With color-coded digital waveform display, groups are created by simply placing digital channels together on the screen, allowing digital channels to be moved as a group. You can set threshold values for each channel, enabling support for up to 16 different logic families.
Once a group is formed, you can position all the channels contained in that group collectively. This greatly reduces the normal setup time associated with positioning channels individually.
MagniVu™ high-speed acquisition
The main digital acquisition mode on the MSO4000B Series will capture up to 20M points at 500 MS/s (2 ns resolution). In addition to the main record, the oscilloscope provides an ultra high-resolution record called MagniVu which acquires 10,000 points at up to 16.5 GS/s (60.6 ps resolution). Both main and MagniVu waveforms are acquired on every trigger and can be switched between in the display at any time, running or stopped. MagniVu provides significantly finer timing resolution than comparable MSOs on the market, instilling confidence when making critical timing measurements on digital waveforms.

The MagniVu high-resolution record provides 60.6 ps timing resolution, enabling you to make critical timing measurements on your digital waveforms.
P6616 MSO probe
This unique probe design offers two eight-channel pods. Each channel ends with a probe tip featuring a recessed ground for simplified connection to the device under test. The coax on the first channel of each pod is colored blue making it easy to identify. The common ground uses an automotive-style connector making it easy to create custom grounds for connecting to the device under test. When connecting to square pins, the P6616 has an adapter that attaches to the probe head extending the probe ground flush with the probe tip so you can attach to a header. The P6616 offers outstanding electrical characteristics, having only 3 pF of capacitive loading, a 100 kΩ input resistance, and is capable of acquiring toggle rates >500 MHz and pulses as short as 1 ns in duration.

The P6616 MSO probe offers two eight-channel pods to simplify connecting to your device.
Visualizing changes in your RF signal
The time domain graticule on the MDO4000B Series display provides support for three RF time domain traces that are derived from the underlying I and Q data of the spectrum analyzer input including:
- Amplitude - The instantaneous amplitude of the spectrum analyzer input vs. time
- Frequency - The instantaneous frequency of the spectrum analyzer input, relative to the center frequency vs. time
- Phase - The instantaneous phase of the spectrum analyzer input, relative to the center frequency vs. time
Each of these traces may be turned on and off independently, and all three may be displayed simultaneously. RF time domain traces make it easy to understand what's happening with a time-varying RF signal.

The orange waveform in the Time Domain view is the frequency vs. time trace derived from the spectrum analyzer input signal. Notice that Spectrum Time is positioned during a transition from the highest frequency to the lowest frequency, so the energy is spread across a number of frequencies. With the frequency vs. time trace, you can easily see the different frequency hops, simplifying characterization of how the device switches between frequencies.
Advanced triggering with analog, digital and spectrum analyzer channels
In order to deal with the time-varying nature of modern RF applications, the MDO4000B Series provides a triggered acquisition system that is fully integrated with the analog, digital and spectrum analyzer channels. This means that a single trigger event coordinates acquisition across all channels, allowing you to capture a spectrum at the precise point in time where an interesting time domain event is occurring. A comprehensive set of time domain triggers are available, including Edge, Sequence, Pulse Width, Timeout, Runt, Logic, Setup/Hold Violation, Rise/Fall Time, Video, and a variety of parallel and serial bus packet triggers. In addition, you can trigger on the power level of the spectrum analyzer input. For example, you can trigger on your RF transmitter turning on or off.
The optional MDO4TRIG application module provides advanced RF triggering. This module enables the RF power level on the spectrum analyzer to be used as a source for Sequence, Pulse Width, Timeout, Runt, and Logic trigger types. For example, you can trigger on a RF pulse of a specific length or use the spectrum analyzer channel as an input to a logic trigger, enabling the oscilloscope to trigger only when the RF is on while other signals are active.
Fast and accurate spectral analysis
When using the spectrum analyzer input by itself, the MDO4000B Series display becomes a full-screen Frequency Domain view.
Key spectral parameters such as Center Frequency, Span, Reference Level, and Resolution Bandwidth are all adjusted quickly and easily using the dedicated front-panel menus and keypad.

MDO4000B frequency domain display.

Key spectral parameters are adjusted quickly with the dedicated front-panel menus and keypad.
Intelligent, efficient markers
In a traditional spectrum analyzer, it can be a very tedious task to turn on and place enough markers to identify all your peaks of interest. The MDO4000B Series makes this process far more efficient by automatically placing markers on peaks that indicate both the frequency and the amplitude of each peak. You can adjust the criteria that the oscilloscope uses to automatically find the peaks.
The highest amplitude peak is referred to as the reference marker and is shown in red. Marker readouts can be switched between Absolute and Delta readouts. When Delta is selected, marker readouts show each peak's delta frequency and delta amplitude from the reference marker.
Two manual markers are also available for measuring non-peak portions of the spectrum. When enabled, the reference marker is attached to one of the manual markers, enabling delta measurements from anywhere in the spectrum. In addition to frequency and amplitude, manual marker readouts also include noise density and phase noise readouts depending on whether Absolute or Delta readouts are selected. A "Reference Marker to Center" function instantly moves the frequency indicated by the reference marker to center frequency.

Automated peak markers identify critical information at a glance. As shown here, the five highest amplitude peaks that meet the threshold and excursion criteria are automatically marked along with the peak's frequency and amplitude.
Spectrogram
The MDO4000B Series includes a spectrogram display which is ideal for monitoring slowly changing RF phenomena. The x-axis represents frequency, just like a typical spectrum display. However, the y-axis represents time, and color is used to indicate amplitude.
Spectrogram slices are generated by taking each spectrum and "flipping it up on its edge" so that it's one pixel row tall, and then assigning colors to each pixel based on the amplitude at that frequency. Cold colors (blue, green) are low amplitude and hotter colors (yellow, red) are higher amplitude. Each new acquisition adds another slice at the bottom of the spectrogram and the history moves up one row. When acquisitions are stopped, you can scroll back through the spectrogram to look at any individual spectrum slice.

Spectrogram display illustrates slowly moving RF phenomena. As shown here, a signal that has multiple peaks is being monitored. As the peaks change in both frequency and amplitude over time, the changes are easily seen in the Spectrogram display.
Triggered versus Free Run operation
When both the time and frequency domains are displayed, the spectrum shown is always triggered by the system trigger event and is time correlated with the active time-domain traces. However, when only the frequency domain is displayed, the spectrum analyzer can be set to Free Run. This is useful when the frequency domain data is continuous and unrelated to events occurring in the time domain.
Ultra-wide capture bandwidth
Today's wireless communications vary significantly with time, using sophisticated digital modulation schemes and, often, transmission techniques that involve bursting the output. These modulation schemes can have very wide bandwidth as well. Traditional swept or stepped spectrum analyzers are ill equipped to view these types of signals as they are only able to look at a small portion of the spectrum at any one time.
The amount of spectrum acquired in one acquisition is called the capture bandwidth. Traditional spectrum analyzers sweep or step the capture bandwidth through the desired span to build the requested image. As a result, while the spectrum analyzer is acquiring one portion of the spectrum, the event you care about may be happening in another portion of the spectrum. Most spectrum analyzers on the market today have 10 MHz capture bandwidths, sometimes with expensive options to extend that to 20, 40, or even 160 MHz in some cases.
In order to address the bandwidth requirements of modern RF, the MDO4000B Series provides ≥1 GHz of capture bandwidth. At span settings of 1 GHz and below, there is no requirement to sweep the display. The spectrum is generated from a single acquisition, thus guaranteeing you'll see the events you're looking for in the frequency domain.

Spectral display of a bursted communication both into a device through Zigbee at 900 MHz and out of the device through Bluetooth at 2.4 GHz, captured with a single acquisition.
Spectrum traces
The MDO4000B Series spectrum analyzer offers four different traces or views including Normal, Average, Max Hold, and Min Hold. You can set the detection method used for each trace type independently or you can leave the oscilloscope in the default Auto mode that sets the detection type optimally for the current configuration. Detection types include +Peak, -Peak, Average, and Sample.
Normal, Average, Max Hold, and Min Hold spectrum traces
RF measurements
The MDO4000B Series includes three automated RF measurements - Channel Power, Adjacent Channel Power Ratio, and Occupied Bandwidth. When one of these RF measurements is activated, the oscilloscope automatically turns on the Average spectrum trace and sets the detection method to Average for optimal measurement results.

Automated Channel Power measurement
EMI Troubleshooting
EMC testing is expensive regardless of whether you purchase the equipment to perform in-house testing or you pay an external test facility to certify your product. And that assumes that your product passes the first time. Multiple visits to a test house can add significant cost and delay to your project. The key to minimizing this expense is early identification and debug of EMI issues. Traditionally, spectrum analyzers with near field probe sets have been used to identify the location and amplitude of offending frequencies, but their ability to determine the cause of the issue is very limited. Designers are increasingly using oscilloscopes and logic analyzers as EMI issues become more transient due to the complex interactions of numerous digital circuits in modern designs.
The MDO4000B, with its integrated oscilloscope, logic analyzer, and spectrum analyzer is the ultimate tool for debugging modern EMI issues. Many EMI problems are caused from events rooted in the time domain, such as clocks, power supplies, and serial data links. With its ability to provide time correlated views of analog, digital, and RF signals, the MDO4000B is the only instrument available that can discover the connection between time-domain events and offending spectral emissions.
Advanced RF analysis
When paired with SignalVu-PC and its Live Link option, the MDO4000B Series becomes the industry's widest bandwidth Vector Signal Analyzer with up to 1 GHz capture bandwidth. Whether your design validation needs include Wireless LAN, wideband radar, high data rate satellite links, or frequency-hopping communications, SignalVu-PC vector signal analysis software can speed your time-to-insight by showing you the time-variant behavior of these wideband signals. Available analysis options include Wi-Fi (IEEE 802.11 a/b/g/j/n/p/ac) signal quality analysis, Bluetooth Tx compliance, pulse analysis, audio measurements, AM/FM/PM modulation analysis, general purpose digital modulation and more.

MDO4000B paired with SignalVu-PC to analyze 802.11ac modulation.
RF probing
Signal input methods on spectrum analyzers are typically limited to cabled connections or antennas. But with the optional TPA-N-VPI adapter, any active, 50 Ω TekVPI probe can be used with the spectrum analyzer on the MDO4000B Series. This enables additional flexibility when hunting for noise sources and enables easier spectral analysis by using true signal browsing on an RF input.
In addition, an optional preamplifier accessory assists in the investigation of lower-amplitude signals. The TPA-N-PRE preamplifier provides 12 dB nominal gain across the 9 kHz - 6 GHz frequency range.

The optional TPA-N-VPI adapter enables any active, 50 Ω TekVPI probe to be connected to the spectrum analyzer.

The TPA-N-PRE preamplifier provides 12 dB nominal gain across the 9 kHz - 6 GHz frequency range.
Wave Inspector® navigation and search
With long record lengths, a single acquisition can include thousands of screens of waveform data. Wave Inspector®, the industry’s best tool for navigation and search, enables you to find events of interest in seconds.

Wave Inspector controls provide unprecedented efficiency in viewing, navigating, and analyzing waveform data. Zip through your long record by turning the outer pan control (1). Get details from the beginning to end in seconds. See something of interest and want to see more details? Just turn the inner zoom control (2).
Zoom and pan
A dedicated, two-tier front-panel control provides intuitive control of both zooming and panning. The inner control adjusts the zoom factor (or zoom scale); turning it clockwise activates zoom and goes to progressively higher zoom factors, while turning it counterclockwise results in lower zoom factors and eventually turning zoom off. No longer do you need to navigate through multiple menus to adjust your zoom view. The outer control pans the zoom box across the waveform to quickly get to the portion of waveform you are interested in. The outer control also utilizes force-feedback to determine how fast to pan on the waveform. The farther you turn the outer control, the faster the zoom box moves. Pan direction is changed by simply turning the control the other way.
Play/Pause
A dedicated Play/Pause front-panel button scrolls the waveform across the display automatically while you look for anomalies or an event of interest. Playback speed and direction are controlled using the intuitive pan control. Once again, turning the control further makes the waveform scroll faster and changing direction is as simple as turning the control the other way.
User marks
Press the Set Mark front-panel button to place one or more marks on the waveform. Navigating between marks is as simple as pressing the Previous (←) and Next (→) buttons on the front panel.
Search marks
The Search button allows you to automatically search through your long acquisition looking for user-defined events. All occurrences of the event are highlighted with search marks and are easily navigated to, using the front-panel Previous (←) and Next (→) buttons. Search types include edge, pulse width/glitch, timeout, runt, logic, setup and hold, rise/fall time, parallel bus, and I2C, SPI, USB, Ethernet, CAN, LIN, FlexRay, RS-232/422/485/UART, MIL-STD-1553, and I2S/LJ/RJ/TDM packet content. A search mark table provides a tabular view of the events found during the automated search. Each event is shown with a time stamp, making timing measurements between events easy.

Search step 1: You define what you would like to find.

Search step 2: Wave Inspector automatically searches through the record and marks each event with a hollow white triangle. You can then use the Previous and Next buttons to jump from one event to the next.

Search step 3: The Search Mark table provides a tabular view of each of the events found by the automated search. Each event is shown with a time stamp making timing measurements between events easy.
Serial triggering and analysis (optional)
On a serial bus, a single signal often includes address, control, data, and clock information. This can make isolating events of interest difficult. Automatic trigger, decode, and search on bus events and conditions gives you a robust set of tools for debugging serial buses. The optional serial protocol triggering and analysis functionality is offered free for a 30-day trial period. This free trial period starts automatically when the instrument is powered on for the first time.

Triggering on a specific OUT Token packet on a USB full-speed serial bus. The yellow waveform is the D+ and the blue waveform is the D-. A bus waveform provides decoded packet content including Start, Sync, PID, Address, End Point, CRC, Data values, and Stop.
Serial triggering
Trigger on packet content such as start of packet, specific addresses, specific data content, unique identifiers, etc. on popular serial interfaces such as I2C, SPI, USB, Ethernet, CAN, LIN, FlexRay, RS-232/422/485/UART, MIL-STD-1553, and I2S/LJ/RJ/TDM.
Bus display
Provides a higher-level, combined view of the individual signals (clock, data, chip enable, etc.) that make up your bus, making it easy to identify where packets begin and end and identifying sub-packet components such as address, data, identifier, CRC, etc.
Bus decoding
Tired of having to visually inspect the waveform to count clocks, determine if each bit is a 1 or a 0, combine bits into bytes, and determine the hex value? Let the oscilloscope do it for you! Once you've set up a bus, the MSO/DPO4000B Series will decode each packet on the bus, and display the value in hex, binary, decimal (USB, Ethernet, MIL-STD-1553, LIN, and FlexRay only), signed decimal (I2S/LJ/RJ/TDM only), or ASCII (USB, Ethernet, and RS-232/422/485/UART only) in the bus waveform.
Event table
In addition to seeing decoded packet data on the bus waveform itself, you can view all captured packets in a tabular view much like you would see in a software listing. Packets are time stamped and listed consecutively with columns for each component (Address, Data, etc.). You can save the event table data in .csv format.

Event table showing decoded identifier, DLC, DATA, and CRC for every CAN packet in a long acquisition.
| Technology | Trigger, Decode, Search | Order product | |
|---|---|---|---|
| Embedded | I2C | Yes | DPO4EMBD |
| SPI | Yes | DPO4EMBD | |
| Computer | RS232/422/485, UART | Yes | DPO4COMP |
| USB | USB LS, FS, HS | Yes | DPO4USB |
| Ethernet | 10Base-T, 100Base-TX | Yes | DPO4ENET |
| Automotive | CAN | Yes | DPO4AUTO or DPO4AUTOMAX |
| LIN | Yes | DPO4AUTO or DPO4AUTOMAX | |
| FlexRay | Yes | DPO4AUTOMAX | |
| Military and Aerospace | MIL-STD-1553 | Yes | DPO4AERO |
| Audio | I2S | Yes | DPO4AUDIO |
| LJ, RJ | Yes | DPO4AUDIO | |
| TDM | Yes | DPO4AUDIO | |
Search (serial triggering)
Serial triggering is very useful for isolating the event of interest, but once you’ve captured it and need to analyze the surrounding data, what do you do? In the past, users had to manually scroll through the waveform counting and converting bits and looking for what caused the event. You can have the oscilloscope automatically search through the acquired data for user-defined criteria including serial packet content. Each occurrence is highlighted by a search mark. Rapid navigation between marks is as simple as pressing the Previous (←) and Next (→) buttons on the front panel.
Power analysis (optional)
Ever increasing consumer demand for longer battery-life devices and for green solutions that consume less power require power-supply designers to characterize and minimize switching losses to improve efficiency. In addition, the supply’s power levels, output purity, and harmonic feedback into the power line must be characterized to comply with national and regional power quality standards. Historically, making these and many other power measurements on an oscilloscope has been a long, manual, and tedious process. The optional power analysis tools greatly simplify these tasks, enabling quick and accurate analysis of power quality, switching loss, harmonics, safe operating area (SOA), modulation, ripple, and slew rate (di/dt, dv/dt). Completely integrated into the oscilloscope, the power analysis tools provide automated, repeatable power measurements with a touch of a button; no external PC or complex software setup is required. The optional power analysis functionality is offered free for a 30-day trial period. This free trial period starts automatically when the instrument is powered on for the first time.

Safe operating area measurement. Automated power measurements enable quick and accurate analysis of common power parameters.
Limit/Mask testing (optional)
A common task during the development process is characterizing the behavior of certain signals in a system. One method, called limit testing, is to compare a tested signal to a known good or "golden" version of the same signal with user-defined vertical and horizontal tolerances. Another common method, called mask testing, is to compare a tested signal to a mask, looking for where a signal under test violates the mask. The MDO4000B Series offers both limit and mask testing capability useful for long-term signal monitoring, characterizing signals during design, or testing on a production line. A robust set of telecommunications and computer standards are provided to test for compliance to a standard. Additionally, custom masks can be created and used for characterizing signals. Tailor a test to your specific requirements by defining test duration in number of waveforms or time, a violation threshold that must be met before considering a test a failure, counting hits along with statistical information, and actions upon violations, test failure, and test complete. Whether specifying a mask from a known good signal or from a custom or standard mask, conducting pass/fail tests in search of waveform anomalies such as glitches has never been easier. The optional limit/mask test functionality is offered free for a 30-day trial period. This free trial period starts automatically when the instrument is powered on for the first time.

Limit Test showing a mask created from a golden waveform and compared against a live signal. Results showing statistical information about the test are displayed.
Video design and development
Many video engineers have remained loyal to analog oscilloscopes, believing the intensity gradations on an analog display are the only way to see certain video waveform details. The fast waveform capture rate, coupled with its intensity-graded view of the signal, provides the same information-rich display as an analog oscilloscope, but with much more detail and all the benefits of digital scopes.
Standard features such as IRE and mV graticules, holdoff by fields, video polarity, and an Autoset smart enough to detect video signals, make these the easiest to use oscilloscopes on the market for video applications. And with high bandwidth and four analog inputs, the oscilloscope provides ample performance for analog and digital video use.
The video functionality is further extended with an optional video application module, which provides the industry's most complete suite of HDTV and custom (nonstandard) video triggers, as well as a video picture mode enabling you to see the picture of the video signal you are viewing - for NTSC and PAL signals. The optional video analysis functionality is offered free for a 30- day trial period. This free trial period starts automatically when the instrument is powered on for the first time.

Viewing an NTSC video image. Video picture mode contains automatic contrast and brightness settings as well as manual controls.
Designed to make your work easier

The MDO4000B Series is designed to make your work easier. The large, high-resolution display shows intricate signal details. Dedicated front-panel controls simplify operation. Two USB host ports on the front panel allow you to easily transfer screen shots, instrument settings, and waveform data to a USB mass storage device.
Large, high-resolution display
The MDO4000B Series features a 10.4 in. (264 mm) bright, LED backlit XGA color display for seeing intricate signal details.
Connectivity
The MDO4000B contains a number of ports which can be used to connect the instrument to a network, directly to a PC, or other test equipment.
- Two USB host ports on the front and two USB host ports on the rear enable easy transfer of screen shots, instrument settings, and waveform data to a USB mass storage device. A USB keyboard can also be attached to a USB host port for data entry.
- Rear USB device port is useful for controlling the oscilloscope remotely from a PC or for printing directly to a PictBridge®-compatible printer.
- The standard 10/100/1000BASE-T Ethernet port on the rear of the instrument enables easy connection to networks, provides network and e-mail printing, and provides LXI Class-C compatibility. The instrument can also mount network drives for easy storage of screen images, setup files, or data files.
- A video out port on the rear of the instrument allows the display to be exported to an external monitor or projector.
Compact form factor
With the compact, portable form factor, you can easily move the oscilloscope between labs. And with a depth of just 5.8 inches (147 mm), it saves you valuable space on your test bench.
TekVPI® probe interface
The TekVPI probe interface sets the standard for ease of use in probing. In addition to the secure, reliable connection that the interface provides, TekVPI probes feature status indicators and controls, as well as a probe menu button right on the comp box itself. This button brings up a probe menu on the oscilloscope display with all relevant settings and controls for the probe. The TekVPI interface enables direct attachment of current probes without requiring a separate power supply. TekVPI probes can be controlled remotely through USB, GPIB, or LAN, enabling more versatile solutions in ATE environments. The instrument provides up to 50 W of power to the front panel TekVPI connectors from the internal power supply, giving you the confidence that it can meet any demanding probing requirements you have.

TekVPI probe interface simplifies connecting your probes to the oscilloscope.
Remote connectivity and instrument control
Exporting data and measurements is as simple as connecting a USB cable from the oscilloscope to your PC. Key software applications – OpenChoice® Desktop, and Microsoft Excel and Word toolbars – are included standard with each oscilloscope to enable fast and easy direct communication with your Windows PC.
The included OpenChoice Desktop enables fast and easy communication between the oscilloscope and your PC through USB or LAN for transferring settings, waveforms, and screen images.

OpenChoice Desktop software enables seamless connection between the oscilloscope and your PC.
The embedded e*Scope® capability enables fast control of the oscilloscope over a network connection through a standard web browser. Simply enter the IP address or network name of the oscilloscope and a web page will be served to the browser. Transfer and save settings, waveforms, measurements, and screen images or make live control changes to settings on the oscilloscope directly from the web browser.
The MDO4000B Series can also be connected to your network using the LAN port. The included LXI web interface provides information about the current configuration of your MDO4000B Series oscilloscope, including network configuration. You can make changes to the network configuration, control instrument settings, save screen images and instrument data, and save/load instrument setups of your oscilloscope directly from the web interface through a password-protected web page.
Specifications
All specifications apply to all models unless noted otherwise.
Model overview
| MDO4014B-3 | MDO4034B-3 | MDO4054B-3 | MDO4054B-6 | MDO4104B-3 | MDO4104B-6 | |
|---|---|---|---|---|---|---|
| Analog channels | 4 | 4 | 4 | 4 | 4 | 4 |
| Analog channel bandwidth | 100 MHz | 350 MHz | 500 MHz | 500 MHz | 1 GHz | 1 GHz |
| Rise time | 3.5 ns | 1 ns | 700 ps | 700 ps | 350 ps | 350 ps |
| Sample rate (1 ch) | 2.5 GS/s | 2.5 GS/s | 2.5 GS/s | 2.5 GS/s | 5 GS/s | 5 GS/s |
| Sample rate (2 ch) | 2.5 GS/s | 2.5 GS/s | 2.5 GS/s | 2.5 GS/s | 5 GS/s | 5 GS/s |
| Sample rate (4 ch) | 2.5 GS/s | 2.5 GS/s | 2.5 GS/s | 2.5 GS/s | 2.5 GS/s | 2.5 GS/s |
| Record length (1 ch) | 20M | 20M | 20M | 20M | 20M | 20M |
| Record length (2 ch) | 20M | 20M | 20M | 20M | 20M | 20M |
| Record length (4 ch) | 20M | 20M | 20M | 20M | 20M | 20M |
| Digital channels | 16 | 16 | 16 | 16 | 16 | 16 |
| Spectrum analyzer channels | 1 | 1 | 1 | 1 | 1 | 1 |
| Spectrum analyzer frequency range | 9 kHz - 3 GHz | 9 kHz - 3 GHz | 9 kHz - 3 GHz | 9 kHz - 6 GHz | 9 kHz - 3 GHz | 9 kHz - 6 GHz |
Vertical system analog channels
- Hardware bandwidth limits
-
- ≥350 MHz models
- 20 MHz or 250 MHz
- 100 MHz models
- 20 MHz
- Input coupling
- AC, DC
- Input impedance
- 1 MΩ ±1%, 50 Ω ±1%
- Input sensitivity range
-
- 1 MΩ
- 1 mV/div to 10 V/div
- 50 Ω
- 1 mV/div to 1 V/div
- Vertical resolution
- 8 bits (11 bits with Hi Res)
- Maximum input voltage
-
- 1 MΩ
- 300 VRMS CAT II with peaks ≤ ±425 V
- 50 Ω
- 5 VRMS with peaks ≤ ±20 V (DF ≤ 6.25%)
- DC gain accuracy
- ±1.5%, derated at 0.10%/°C above 30 °C
- Channel-to-channel isolation
- Any two channels at equal vertical scale
- Offset range
-
Volts/div setting Offset range 1 MΩ input 50 Ω 1 mV/div to 50 mV/div ±1 V ±1 V 50.5 mV/div to 99.5 mV/div ±0.5 V ±0.5 V 100 mV/div to 500 mV/div ±10 V ±10 V 505 mV/div to 995 mV/div ±5 V ±5 V 1 V/div to 5 V/div ±100 V ±5 V 5.05 V/div to 10 V/div ±50 V NA
Vertical system digital channels
- Input channels
- 16 digital (D15 to D0)
- Thresholds
- Per-channel thresholds
- Threshold selections
- TTL, CMOS, ECL, PECL, User-defined
- User-defined threshold range
- ±40 V
- Threshold accuracy
- ±[100 mV + 3% of threshold setting]
- Maximum input voltage
- ±42 Vpeak
- Input dynamic range
-
30 Vp-p ≤200 MHz
10 Vp-p >200 MHz
- Minimum voltage swing
- 400 mV
- Probe loading
- 100 kΩ in parallel with 3 pF
- Vertical resolution
- 1 bit
Horizontal system analog channels
- Time base range
-
- 1 GHz models
- 400 ps to 1000 s
- ≤ 500 MHz models
- 1 ns to 1000 s
- Maximum duration at highest sample rate (all/half channels)
-
- 1 GHz models
- 8/4 ms
- ≤ 500 MHz models
- 8/8 ms
- Time-base delay time range
- -10 divisions to 5000 s
- Channel-to-channel deskew range
- ±125 ns
- Time base accuracy
- ±5 ppm over any ≥1 ms interval
Horizontal system digital channels
- Maximum sample rate (Main)
- 500 MS/s (2 ns resolution)
- Maximum record length (Main)
- 20M points
- Maximum sample rate (MagniVu)
- 16.5 GS/s (60.6 ps resolution)
- Maximum record length (MagniVu)
- 10k points centered around the trigger
- Minimum detectable pulse width (typical)
- 1 ns
- Channel-to-channel skew (typical)
- 200 ps
- Maximum input toggle rate
-
500 MHz (Maximum frequency sine wave that can accurately be reproduced as a logic square wave. Requires the use of a short ground extender on each channel. This is the maximum frequency at the minimum swing amplitude. Higher toggle rates can be achieved with higher amplitudes.)
Spectrum analyzer input
- Span
-
1 kHz - 3 GHz (MDO4XX4B-3 models) or 1 kHz - 6 GHz (MDO4XX4B-6 models)
- Resolution bandwidth range
-
The resolution bandwidth range for windowing functions is as follows:
- RBW shape factor (Kaiser)
- 60 dB / 3 dB shape factor: ≥ 4:1
- Reference level
-
Setting range: -140 dBm to +30 dBm in steps of 1 dB
- Input vertical range
-
Vertical measurement range: +30 dBm to DANL
- Vertical position
- -100 divs to +100 divs
- Vertical units
- dBm, dBmV, dBµV, dBµW, dBmA, dBµA
- Displayed average noise level (DANL)
-
Frequency range DANL 9 kHz - 50 kHz < -116 dBm/Hz (< -120 dBm/Hz, typical) 50 kHz - 5 MHz < -130 dBm/Hz (< -134 dBm/Hz, typical) 5 MHz - 400 MHz < -146 dBm/Hz (< -148 dBm/Hz, typical) 400 MHz - 3 GHz < -147 dBm/Hz (< -149 dBm/Hz, typical) 3 GHz - 4 GHz (MDO4XX4B-6 models only) < -148 dBm/Hz (< -152 dBm/Hz, typical) 4 GHz - 6 GHz (MDO4XX4B-6 models only) < -140 dBm/Hz (< -144 dBm/Hz, typical)
- DANL with TPA-N-PRE preamp attached
-
Preamp set to "Auto", and Reference Level set to -40 dBm.
The DANL of the MDO4000B with the preamp in the Bypass state is ≤3 dB higher than the DANL of the MDO4000B without the preamp.
Frequency range DANL 9 kHz - 50 kHz < -119 dBm/Hz (< -123 dBm/Hz, typical) 50 kHz - 5 MHz < -140 dBm/Hz (< -144 dBm/Hz, typical) 5 MHz - 400 MHz < -156 dBm/Hz (< -158 dBm/Hz, typical) 400 MHz - 3 GHz < -157 dBm/Hz (< -159 dBm/Hz, typical) 3 GHz - 4 GHz (MDO4XXB-6 models only) < -158 dBm/Hz (< -162 dBm/Hz, typical) 4 GHz - 6 GHz (MDO4XXB-6 models only) < -150 dBm/Hz (< -154 dBm/Hz, typical)
- Spurious response
-
- 2nd and 3rd harmonic distortion (>100 MHz)
-
< -60 dBc (< -65 dBc, typical), with auto settings on and signals 10 dB below reference level
- 2nd and 3rd harmonic distortion (9 kHz to 100 MHz)
-
< -60 dBc (< -65 dBc, typical), with auto settings on, signals 10 dB below reference level, and reference level ≤ -15 dBm
- 2nd order intermodulation distortion (>100 MHz)
-
< -60 dBc (< -65 dBc, typical), with auto settings on and signals 10 dB below reference level
- 2nd order intermodulation distortion (9 kHz to 100 MHz)
-
< -60 dBc (< -65 dBc, typical), with auto settings on, signals 10 dB below reference level, and reference level ≤ -15 dBm
- 3rd order intermodulation distortion: > 15 MHz
-
< -62 dBc, (<-65 dBc, typical), with auto settings on and signals 10 dB below reference level
- 3rd order intermodulation distortion: 9 kHz to 15 MHz
-
< -62 dBc (<-65 dBc, typical), with auto settings on and signals 10 dB below reference level, and reference levels < -15 dBm
- A/D spurs
-
< -60 dBc (< -65 dBc, typical), with auto settings on and signals 5 dB below reference level. Excludes A/D aliasing spurs
- A/D aliasing spurs
-
At (5 GHz - Fin) and (8 GHz - Fin): <-55 dBc (<-60 dBc, typical), with auto settings on and signals 5 dB below reference level
- Specifications that only apply to MDO4XX4-6 models
-
IF Rejection: (All Input Frequencies except: 1.00 GHz to 1.25 GHz and 2 GHz to 2.4 GHz): < -55 dBc, typical
- Residual response
- < -85 dBm (< -78 dBm at 2.5 GHz, 3.75 GHz, 4.0 GHz, and 5.0 GHz) with ≤ -25 dBm reference level and input terminated with 50 Ω
- Absolute amplitude accuracy
-
Accuracy of power level measurements at the center frequency. At frequencies away from center frequency, add Channel Response to the Absolute Amplitude Accuracy. Applies to signal to noise ratios > 40 dB.
- Channel response, typical
-
Valid over 18 - 28 °C temperature range
Specification applies to signal-to-noise ratios > 40 dB
Measurement center frequency range Span Amplitude flatness, pk-pk, typical Amplitude flatness, RMS, typical Phase linearity, RMS, typical 15 MHz - 6 GHz 10 MHz 0.3 dB 0.15 dB 1.5 ° 60 MHz - 6 GHz ≤ 100 MHz 0.75 dB 0.27 dB 1.5 ° 170 MHz - 6 GHz ≤ 320 MHz 0.85 dB 0.27 dB 2.5 ° 510 MHz - 6 GHz ≤ 1,000 MHz 1.0 dB 0.3 dB 3.0 ° Any, (for start frequency > 10 MHz) > 1,000 MHz 1.2 dB N/A N/A
- Absolute amplitude accuracy (AAA) and channel response (CR), with TPA-N-PRE preamp attached
-
AAA: ≤ ±1.5 dB (typical), 18 ⁰C - 28 ⁰C temperature range, either preamp state.
AAA: ≤ ±2.3 dB (typical), over full operating range, either preamp state.
CR: 0.0 dB
- Crosstalk to spectrum analyzer from oscilloscope channels
-
- ≤1 GHz input frequencies
- < -68 dB from reference level
- >1 GHz - 2 GHz input frequencies
- < -48 dB from reference level
- Phase noise at 1 GHz CW
-
- 1 kHz
- < -104 dBc/Hz (typical)
- 10 kHz
- < -108 dBc/Hz, < -111 dBc/Hz (typical)
- 100 kHz
- < -110 dBc/Hz, < -113 dBc/Hz (typical)
- 1 MHz
- < -120 dBc/Hz, < -123 dBc/Hz (typical)
- Reference frequency error (cumulative)
-
Cumulative error: 1.6 x 10⁻⁶
- Marker frequency measurement accuracy
-
±((1.6 x 10⁻⁶ x Marker-Frequency) + (0.001 x span + 2)) Hz
- Frequency measurement resolution
- 1 Hz
- Maximum operating input level
-
- Average continuous power
-
+30 dBm (1 W) for reference levels ≥ -20 dBm
- DC maximum before damage
-
±40 VDC
- Maximum power before damage (CW)
-
+32 dBm (1.6 W) for reference levels ≥ -20 dBm
- Maximum power before damage (pulse)
-
Peak Pulse Power: +45 dBm (32 W)
- Maximum operating input level with TPA-N-PRE preamp attached
-
- Average continuous power
- +30 dBm (1 W)
- DC maximum before damage
- ±20 VDC
- Maximum power before damage (CW)
- +30 dBm (1 W)
- Maximum power before damage (pulse)
- +45 dBm (32 W) (<10 μs pulse width, <1% duty cycle, and reference level of ≥ +10 dBm)
- RF power level trigger
-
- Frequency range
-
MDO4XX4B-3: 1 MHz to 3 GHz
- Amplitude operating level
-
0 dB to -30 dB from Reference Level
- Amplitude range
-
+10 dB to -40 dB from Reference Level and within the range of -65 dBm to +30 dBm
- Spectrum analyzer to analog channel skew
- <5 ns
- RF acquisition length
-
Span Maximum RF acquisition time >2 GHz 5 ms >1 GHz - 2 GHz 10 ms >800 MHz - 1 GHz 20 ms >500 MHz - 800 MHz 25 ms >400 MHz - 500 MHz 40 ms >250 MHz - 400 MHz 50 ms >200 MHz - 250 MHz 80 ms >160 MHz - 200 MHz 100 ms >125 MHz - 160 MHz 125 ms <125 MHz 158 ms
- FFT window types, factors and RBW accuracy
-
FFT window Factor RBW Accuracy Kaiser 2.23 0.90% Rectangular 0.89 2.25% Hamming 1.30 1.54% Hanning 1.44 1.39% Blackman-Harris 1.90 1.05% Flat-Top 3.77 0.53%
Trigger system
- Trigger modes
- Auto, Normal, and Single
- Trigger coupling
- DC, AC, HF reject (attenuates >50 kHz), LF reject (attenuates <50 kHz), noise reject (reduces sensitivity)
- Trigger holdoff range
- 20 ns to 8 s
- Trigger sensitivity
-
- Internal DC coupled
-
Trigger source Sensitivity 1 MΩ path (all models) For 1 mV/div to 4.98 mV/div; 0.75 div from DC to 50 MHz, increasing to 1.3 div at rated bandwidth 50 Ω path (≤500 MHz models) For ≥5 mV/div; 0.4 div from DC to 50 MHz, increasing to 1 div at rated bandwidth 50 Ω path (1 GHz models) 0.4 div from DC to 50 MHz, increasing to 1 div at rated bandwidth
- Trigger level ranges
-
- Any input channel
- ±8 divisions from center of screen, ±8 divisions from 0 V when vertical LF reject trigger coupling is selected
- Line
- The line trigger level is fixed at about 50% of the line voltage.
- Trigger frequency readout
- Provides 6-digit frequency readout of triggerable events.
- Trigger types
-
- Edge
- Positive, negative, or either slope on any channel. Coupling includes DC, AC, HF reject, LF reject, and noise reject.
- Sequence (B-trigger)
- Trigger Delay by Time: 4 ns to 8 s. Or Trigger Delay by Events: 1 to 4,000,000 events.
- Pulse Width
- Trigger on width of positive or negative pulses that are >, <, =, ≠, or inside/outside a specified period of time.
- Timeout
- Trigger on an event which remains high, low, or either, for a specified time period (4 ns to 8 s).
- Runt
- Trigger on a pulse that crosses one threshold but fails to cross a second threshold before crossing the first again.
- Logic
- Trigger when any logical pattern of channels goes false or stays true for specified period of time. Any input can be used as a clock to look for the pattern on a clock edge. Pattern (AND, OR, NAND, NOR) specified for all input channels defined as High, Low, or Don’t Care.
- Setup and Hold
- Trigger on violations of both setup time and hold time between clock and data present on any of the analog and digital input channels.
- Rise/Fall Time
- Trigger on pulse edge rates that are faster or slower than specified. Slope may be positive, negative, or either.
- Video
- Trigger on all lines, odd, even, or all fields on NTSC, PAL, and SECAM video signals.
- Extended Video (optional)
- Trigger on 480p/60, 576p/50, 720p/30, 720p/50, 720p/60, 875i/60, 1080i/50, 1080i/60, 1080p/24, 1080p/24sF, 1080p/25, 1080p/30, 1080p/50, 1080p/60, and custom bi-level and tri-level sync video standards.
- I2C (optional)
- Trigger on Start, Repeated Start, Stop, Missing ACK, Address (7 or 10 bit), Data, or Address and Data on I2C buses up to 10 Mb/s.
- SPI (optional)
- Trigger on SS active, Start of Frame, MOSI, MISO, or MOSI and MISO on SPI buses up to 50.0 Mb/s.
- RS-232/422/485/UART (optional)
- Trigger on Tx Start Bit, Rx Start Bit, Tx End of Packet, Rx End of Packet, Tx Data, Rx Data, Tx Parity Error, and Rx Parity Error up to 10 Mb/s.
- USB: Low speed (optional)
-
Trigger on Sync Active, Start of Frame, Reset, Suspend, Resume, End of Packet, Token (Address) Packet, Data Packet, Handshake Packet, Special Packet, Error.
Token packet trigger - Any token type, SOF, OUT, IN, SETUP; Address can be specified for Any Token, OUT, IN, and SETUP token types. Address can be further specified to trigger on ≤, <, =, >, ≥, ≠ a particular value, or inside or outside of a range. Frame number can be specified for SOF token using binary, hex, unsigned decimal and don't care digits.
Data packet trigger - Any data type, DATA0, DATA1; Data can be further specified to trigger on ≤, <, =, >, ≥, ≠ a particular data value, or inside or outside of a range.
Handshake packet trigger - Any handshake type, ACK, NAK, STALL.
Special packet trigger - Any special type, Reserved
Error trigger - PID Check, CRC5 or CRC16, Bit Stuffing.
- USB: Full speed (optional)
-
Trigger on Sync, Reset, Suspend, Resume, End of Packet, Token (Address) Packet, Data Packet, Handshake Packet, Special Packet, Error.
Token packet trigger - Any token type, SOF, OUT, IN, SETUP; Address can be specified for Any Token, OUT, IN, and SETUP token types. Address can be further specified to trigger on ≤, <, =, >, ≥, ≠ a particular value, or inside or outside of a range. Frame number can be specified for SOF token using binary, hex, unsigned decimal and don't care digits.
Data packet trigger - Any data type, DATA0, DATA1; Data can be further specified to trigger on ≤, <, =, >, ≥, ≠ a particular data value, or inside or outside of a range.
Handshake packet trigger - Any handshake type, ACK, NAK, STALL.
Special packet trigger - Any special type, PRE, Reserved.
Error trigger - PID Check, CRC5 or CRC16, Bit Stuffing.
- USB: High speed (optional) 1
-
Trigger on Sync, Reset, Suspend, Resume, End of Packet, Token (Address) Packet, Data Packet, Handshake Packet, Special Packet, Error.
Token packet trigger - Any token type, SOF, OUT, IN, SETUP; Address can be specified for Any Token, OUT, IN, and SETUP token types. Address can be further specified to trigger on ≤, <, =, >, ≥, ≠ a particular value, or inside or outside of a range. Frame number can be specified for SOF token using binary, hex, unsigned decimal and don't care digits.
Data packet trigger - Any data type, DATA0, DATA1, DATA2, MDATA; Data can be further specified to trigger on ≤, <, =, >, ≥, ≠ a particular data value, or inside or outside of a range.
Handshake packet trigger - Any handshake type, ACK, NAK, STALL, NYET.
Special packet trigger - Any special type, ERR, SPLIT, PING, Reserved. SPLIT packet components that can be specified include:
▪ Hub Address
▪ Start/Complete - Don't Care, Start (SSPLIT), Complete (CSPLIT)
▪ Port Address
▪ Start and End bits - Don't Care, Control/Bulk/Interrupt (Full-speed Device, Low-speed Device), Isochronous (Data is Middle, Data is End, Data is Start, Data is All)
▪ Endpoint Type - Don't Care, Control, Isochronous, Bulk, Interrupt
Error trigger - PID Check, CRC5 or CRC16.
- Ethernet (optional) 2
-
10BASE-T and 100BASE-TX: Trigger on Start Frame Delimiter, MAC Addresses, MAC Q-Tag Control Information, MAC Length/Type, IP Header, TCP Header, TCP/IPv4/MAC Client Data, End of Packet, and FCS (CRC) Error.
100BASE-TX: Idle.
MAC Addresses - Trigger on Source and Destination 48-bit address values.
MAC Q-Tag Control Information - Trigger on Q-Tag 32-bit value.
MAC Length/Type - Trigger on ≤, <, =, >, ≥, ≠ a particular 16-bit value, or inside or outside of a range.
IP Header - Trigger on IP Protocol 8-bit value, Source Address, Destination Address.
TCP Header - Trigger on Source Port, Destination Port, Sequence Number, and Ack Number.
TCP/IPv4/MAC Client Data - Trigger on ≤, <, =, >, ≥, ≠ a particular data value, or inside or outside of a range. Selectable number of bytes to trigger on from 1-16. Byte offset options of Don't Care, 0-1499.
- CAN (optional)
- Trigger on Start of Frame, Frame Type (data, remote, error, overload), Identifier (standard or extended), Data, Identifier and Data, End of Frame, Missing ACK, or Bit Stuffing Error on CAN signals up to 1 Mb/s. Data can be further specified to trigger on ≤, <, =, >, ≥, or ≠ a specific data value. User-adjustable sample point is set to 50% by default.
- LIN (optional)
- Trigger on Sync, Identifier, Data, Identifier and Data, Wakeup Frame, Sleep Frame, Errors such as Sync, Parity, or Checksum Errors up to 100 kb/s (by LIN definition, 20 kb/s).
- FlexRay (optional)
- Trigger on Start of Frame, Type of Frame (Normal, Payload, Null, Sync, Startup), Identifier, Cycle Count, Complete Header Field, Data, Identifier and Data, End of Frame or Errors such as Header CRC, Trailer CRC, Null Frame, Sync Frame, or Startup Frame Errors up to 100 Mb/s.
- MIL-STD-1553 (optional)
- Trigger on Sync, Word Type 3 (Command, Status, Data), Command Word (set RT Address, T/R, Sub-address/Mode, Data Word Count/Mode Code, and Parity individually), Status Word (set RT Address, Message Error, Instrumentation, Service Request Bit, Broadcast Command Received, Busy, Subsystem Flag, Dynamic Bus Control Acceptance (DBCA), Terminal Flag, and Parity individually), Data Word (user-specified 16-bit data value), Error (Sync, Parity, Manchester, Non-contiguous data), Idle Time (minimum time selectable from 2 µs to 100 µs; maximum time selectable from 2 µs to 100 µs; trigger on < minimum, > maximum, inside range, outside range). RT Address can be further specified to trigger on =, ≠, <, >, ≤, ≥ a particular value, or inside or outside of a range.
- I2S/LJ/RJ/TDM (optional)
- Trigger on Word Select, Frame Sync, or Data. Data can be further specified to trigger on ≤, <, =, >, ≥, ≠ a specific data value, or inside or outside of a range.
- Parallel
- Trigger on a parallel bus data value. Parallel bus can be from 1 to 20 bits (from the digital and analog channels) in size. Binary and Hex radices are supported.
1 High-speed support only available on models with 1 GHz analog channel bandwidth.
2 ≥350 MHz bandwidth models are recommended for 100BASE-TX
3 Trigger selection of Command Word will trigger on Command and ambiguous Command/Status words. Trigger selection of Status Word will trigger on Status and ambiguous Command/Status words.
Acquisition system
- Acquisition Modes
-
- Sample
- Acquire sampled values.
- Peak Detect
- Captures glitches as narrow as 800 ps (1 GHz models) or 1.6 ns (≤500 MHz models) at all sweep speeds
- Averaging
- From 2 to 512 waveforms included in average.
- Envelope
- Min-max envelope reflecting Peak Detect data over multiple acquisitions.
- Hi Res
- Real-time boxcar averaging reduces random noise and increases vertical resolution.
- Roll
- Scrolls waveforms right to left across the screen at sweep speeds slower than or equal to 40 ms/div.
- FastAcq™
- FastAcq optimizes the instrument for analysis of dynamic signals and capture of infrequent events, capturing >340,000 wfms/s on 1 GHz models and >270,000 wfms/s on 100 MHz - 500 MHz models.
Waveform measurements
- Cursors
- Waveform and Screen.
- Automatic measurements (time domain)
- 30, of which up to eight can be displayed on-screen at any one time. Measurements include: Period, Frequency, Delay, Rise Time, Fall Time, Positive Duty Cycle, Negative Duty Cycle, Positive Pulse Width, Negative Pulse Width, Burst Width, Phase, Positive Overshoot, Negative Overshoot, Total Overshoot, Peak to Peak, Amplitude, High, Low, Max, Min, Mean, Cycle Mean, RMS, Cycle RMS, Positive Pulse Count, Negative Pulse Count, Rising Edge Count, Falling Edge Count, Area and Cycle Area.
- Automatic measurements (frequency domain)
- 3, of which one can be displayed on-screen at any one time. Measurements include Channel Power, Adjacent Channel Power Ratio (ACPR), and Occupied Bandwidth (OBW)
- Measurement statistics
- Mean, Min, Max, Standard Deviation.
- Reference levels
- User-definable reference levels for automatic measurements can be specified in either percent or units.
- Gating
- Isolate the specific occurrence within an acquisition to take measurements on, using either the screen, or waveform cursors.
- Waveform histogram
-
A waveform histogram provides an array of data values representing the total number of hits inside of a user-defined region of the display. A waveform histogram is both a visual graph of the hit distribution as well as a numeric array of values that can be measured.
Sources - Channel 1, Channel 2, Channel 3, Channel 4, Ref 1, Ref 2, Ref 3, Ref 4, Math
Types - Vertical, Horizontal
- Waveform histogram measurements
- Waveform Count, Hits in Box, Peak Hits, Median, Max, Min, Peak-to-Peak, Mean, Standard Deviation, Sigma 1, Sigma 2, Sigma 3
Waveform math
- Arithmetic
- Add, subtract, multiply, and divide waveforms.
- Math functions
- Integrate, Differentiate, FFT.
- FFT
- Spectral magnitude. Set FFT Vertical Scale to Linear RMS or dBV RMS, and FFT Window to Rectangular, Hamming, Hanning, or Blackman-Harris.
- Spectrum math
- Add or subtract frequency-domain traces.
- Advanced math
- Define extensive algebraic expressions including waveforms, reference waveforms, math functions (FFT, Intg, Diff, Log, Exp, Sqrt, Abs, Sine, Cosine, Tangent, Rad, Deg), scalars, up to two user-adjustable variables and results of parametric measurements (Period, Freq, Delay, Rise, Fall, PosWidth, NegWidth, BurstWidth, Phase, PosDutyCycle, NegDutyCycle, PosOverShoot, NegOverShoot, PeakPeak, Amplitude, RMS, CycleRMS, High, Low, Max, Min, Mean, CycleMean, Area, CycleArea, and trend plots), e.g.,(Intg(Ch1 - Mean(Ch1)) × 1.414 × VAR1).
Act on Event
- Events
- None, when a trigger occurs, or when a defined number of acquisitions complete (1 to 1,000,000)
- Actions
- Stop acquisition, save waveform to file, save screen image, print, AUX OUT Pulse, remote interface SRQ, e-mail notification, and visual notification.
- Repeat
- Repeat the act on event process (1 to 1,000,000 and infinity)
Video Picture Mode (optional)
- Sources
- Channel 1, Channel 2, Channel 3, Channel 4
- Video standards
- NTSC, PAL
- Contrast and brightness
- Manual and automatic
- Field selection
- Odd, Even, Interlaced
- Picture location on screen
- Selectable X and Y location, width and height adjustment, start line and pixel and line-to-line offset control.
Power measurements (optional)
- Power Quality Measurements
- VRMS, VCrest Factor, Frequency, IRMS, ICrest Factor, True Power, Apparent Power, Reactive Power, Power Factor, Phase Angle.
- Switching loss measurements
-
- Power loss
- Ton, Toff, Conduction, Total.
- Energy loss
- Ton, Toff, Conduction, Total.
- Harmonics
- THD-F, THD-R, RMS measurements. Graphical and table displays of harmonics. Test to IEC61000-3-2 Class A and MIL-STD-1399, Section 300A.
- Ripple measurements
- VRipple and IRipple.
- Modulation Analysis
- Graphical display of +Pulse Width, –Pulse Width, Period, Frequency, +Duty Cycle, and –Duty Cycle modulation types.
- Safe operating area
- Graphical display and mask testing of switching device safe operating area measurements.
- dV/dt and dI/dt measurements
- Cursor measurements of slew rate.
Limit/Mask testing (optional)
- Included standard masks 1
- ITU-T, ANSI T1.102, USB
1 ≥350 MHz bandwidth models are recommended for mask testing on telecomm standards >55 Mb/s. 1 GHz bandwidth models are recommended for mask testing on high-speed (HS) USB.
- Test source
-
Limit test: Any Ch1 - Ch4 or any R1 - R4
Mask test: Any Ch1 - Ch4
- Mask creation
-
Limit test vertical tolerance from 0 to 1 division in 1 m division increments; Limit test horizontal tolerance from 0 to 500 m division in 1 m division increments
Load standard mask from internal memory
Load custom mask from text file with up to 8 segments
- Mask scaling
-
Lock to Source ON (mask automatically re-scales with source-channel settings changes)
Lock to Source OFF (mask does not re-scale with source-channel settings changes)
- Test criteria run until
-
Minimum number of waveforms (from 1 to 1,000,000; Infinity)
Minimum elapsed time (from 1 second to 48 hours; Infinity)
- Violation threshold
- From 1 to 1,000,000
- Actions on test failure
- Stop acquisition, save screen image to file, save waveform to file, print screen image, trigger out pulse, set remote interface SRQ
- Actions on test complete
- Trigger out pulse, set remote interface SRQ
- Results display
- Test status, total waveforms, number of violations, violation rate, total tests, failed tests, test failure rate, elapsed time, total hits for each mask segment
Software
- OpenChoice® Desktop
- Enables fast and easy communication between a Windows PC and your oscilloscope using USB or LAN. Transfer and save settings, waveforms, measurements, and screen images. Included Word and Excel toolbars automate the transfer of acquisition data and screen images from the oscilloscope into Word and Excel for quick reporting or further analysis.
- IVI driver
- Provides a standard instrument programming interface for common applications such as LabVIEW, LabWindows/CVI, Microsoft .NET, and MATLAB.
- e*Scope® Web-based remote control
- Enables control of the oscilloscope over a network connection through a standard web browser. Simply enter the IP address or network name of the oscilloscope and a web page will be served to the browser. Transfer and save settings, waveforms, measurements, and screen images or make live control changes to settings on the oscilloscope directly from the web browser.
- LXI Class C Web interface
- Connect to the oscilloscope through a standard Web browser by simply entering the oscilloscope's IP address or network name in the address bar of the browser. The Web interface enables viewing of instrument status and configuration, status and modification of network settings, and instrument control through the e*Scope Web-based remote control. All Web interaction conforms to LXI Class C specification, version 1.3.
Display system
- Display type
- 10.4 in. (264 mm) liquid-crystal TFT color display
- Display resolution
- 1,024 horizontal × 768 vertical pixels (XGA)
- Interpolation
- Sin(x)/x
- Waveform styles
- Vectors, Dots, Variable Persistence, Infinite Persistence.
- Graticules
- Full, Grid, Cross Hair, Frame, IRE and mV.
- Format
- YT and simultaneous XY/YT
- Maximum waveform capture rate
-
>340,000 wfms/s in FastAcq acquisition mode on 1 GHz models
>270,000 wfms/s in FastAcq acquisition mode on 100 MHz - 500 MHz models
>50,000 wfms/s in DPO acquisition mode on all models.
Input/output ports
- USB 2.0 high-speed host port
- Supports USB mass storage devices and keyboard. Two ports on front and two ports on rear of instrument.
- USB 2.0 device port
- Rear-panel connector allows for communication/control of oscilloscope through USBTMC or GPIB (with a TEK-USB-488), and direct printing to all PictBridge-compatible printers.
- Printing
- Print to network printer, PictBridge printer, or to a printer that supports e-mail printing. Note: This product includes software developed by the OpenSSL Project for use in the OpenSSL Toolkit. (http://www.openssl.org/)
- LAN port
- RJ-45 connector, supports 10/100/1000 Mb/s
- Video out port
- DB-15 female connector, connect to show the oscilloscope display on an external monitor or projector. XGA resolution.
- Probe compensator output voltage and frequency
- Front-panel pins
- Amplitude
- 0 to 2.5 V
- Frequency
- 1 kHz
- Auxiliary out
-
Rear-panel BNC connector
VOUT (Hi): ≥2.5 V open circuit, ≥1.0 V 50 Ω to ground
VOUT (Lo): ≤0.7 V into a load of ≤4 mA; ≤0.25 V 50 Ω to ground
Output can be configured to provide a pulse out signal when the oscilloscope triggers, the internal oscilloscope reference clock out, or an event out for limit/mask testing.
- External reference input
- Time-base system can phase lock to an external 10 MHz reference (10 MHz ±1%)
- Kensington-style lock
- Rear-panel security slot connects to standard Kensington-style lock.
- VESA mount
- Standard (MIS-D 100) 100 mm VESA mounting points on rear of instrument.
LAN eXtensions for Instrumentation (LXI)
- Class
- LXI Class C
- Version
- V1.3
Power source
- Power source voltage
- 100 to 240 V ±10%
- Power source frequency
-
50 to 60 Hz ±10% at 100 to 240 V ±10%
400 Hz ±10% at 115 V ±13%
- Power consumption
- 250 W maximum
Physical characteristics
- Dimensions
-
mm in. Height 229 9.0 Width 439 17.3 Depth 147 5.8
- Weight
-
kg lb. Net 5 11 Shipping 10.7 23.6
- Rackmount configuration
- 5U
- Cooling clearance
- 2 in. (51 mm) required on left side and rear of instrument
EMC, environment, and safety
- Temperature
-
- Operating
- 0 ºC to +50 ºC (+32 ºF to 122 ºF)
- Nonoperating
- -20 ºC to +60 ºC (-4 ºF to 140 ºF)
- Humidity
-
- Operating
- High: 40 ºC to 50 ºC, 10% to 60% relative humidity,
- Nonoperating
- High: 40 ºC to 60 ºC, 5%to 60% relative humidity,
- Altitude
-
- Operating
- 3,000 meters (9,843 feet)
- Nonoperating
- 9,144 meters (30,000 feet)
- Regulatory
-
- Electromagnetic compatibility
- EC Council Directive 2004/108/EC
- Safety
- UL61010-1:2004, CAN/CSA-C22.2 No. 61010.1: 2004, Low Voltage Directive 2006/95/EC and EN61010-1:2001, IEC 61010-1:2001, ANSI 61010-1-2004, ISA 82.02.01
Ordering information
MDO4000B family
- MDO4014B-3
- Mixed Domain Oscilloscope with (4) 100 MHz analog channels, (16) digital channels, and (1) 3 GHz spectrum analyzer input
- MDO4034B-3
- Mixed Domain Oscilloscope with (4) 350 MHz analog channels, (16) digital channels, and (1) 3 GHz spectrum analyzer input
- MDO4054B-3
- Mixed Domain Oscilloscope with (4) 500 MHz analog channels, (16) digital channels, and (1) 3 GHz spectrum analyzer input
- MDO4054B-6
- Mixed Domain Oscilloscope with (4) 500 MHz analog channels, (16) digital channels, and (1) 6 GHz spectrum analyzer input
- MDO4104B-3
- Mixed Domain Oscilloscope with (4) 1 GHz analog channels, (16) digital channels, and (1) 3 GHz spectrum analyzer input
- MDO4104B-6
- Mixed Domain Oscilloscope with (4) 1 GHz analog channels, (16) digital channels, and (1) 6 GHz spectrum analyzer input
Standard accessories
Probes
- ≤ 500 MHz models
- TPP0500B, 500 MHz bandwidth, 10X, 3.9 pF. One passive voltage probe per analog channel.
- 1 GHz models
- TPP1000, 1 GHz bandwidth, 10X, 3.9 pF. One passive voltage probe per analog channel.
- All models
- One P6616 16-channel logic probe and a logic probe accessory kit (020-2662-xx).
Accessories
- 200-5130-xx
- Front cover
- 103-0045-00
- N-to-BNC adapter
- 063-4367-xx
- Documentation CD
- 016-2030-xx
- Accessory bag
- —
- User manual
- —
- Power cord
- —
-
OpenChoice® Desktop Software
- —
- Calibration certificate documenting traceability to National Metrology Institute(s) and ISO9001 quality system registration
Warranty
Three-year warranty covering all parts and labor on the MDO4000B instrument. One-year warranty covering parts and labor on included probes.
Application Modules
Application modules have licenses which can be transferred between an application module and an oscilloscope. The license may be contained in the module; allowing the module to be moved from one instrument to another. Or, the license can be contained in the oscilloscope; allowing the module to be removed and stored for safekeeping. Transferring the license to an oscilloscope and removing the module permits the use of more than 4 applications simultaneously.
- DPO4BND
- Application bundle module that enables all of the functionality of the DPO4AERO, DPO4AUDIO, DPO4AUTO, DPO4COMP, DPO4EMBD, DPO4ENET, DPO4LMT, DPO4PWR, DPO4USB and DPO4VID application modules in a single module. Save money when multiple serial bus debug and analysis application modules are required and easily move the entire set of functionality from one instrument to another.
- DPO4AERO
-
Aerospace Serial Triggering and Analysis Module. Enables triggering on packet-level information on MIL-STD-1553 buses as well as analytical tools such as digital views of the signal, bus views, packet decoding, search tools, and packet decode tables with time-stamp information.
Signal Inputs - Any Ch1 - Ch4, Math, Ref1 - Ref4
Recommended Probing - Differential or single ended (only one single-ended signal required)
- DPO4AUDIO
-
Audio Serial Triggering and Analysis Module. Enables triggering on packet-level information on I2S, LJ, RJ, and TDM audio buses as well as analytical tools such as digital views of the signal, bus views, packet decoding, search tools, and packet decode tables with time-stamp information.
Signal Inputs - Any Ch1 - Ch4, any D0 - D15
Recommended Probing - Single ended
- DPO4AUTO
-
Automotive Serial Triggering and Analysis Module. Enables triggering on packet-level information on CAN and LIN buses as well as analytical tools such as digital views of the signal, bus views, packet decoding, search tools, and packet decode tables with time-stamp information.
Signal Inputs - LIN: Any Ch1 - Ch4, any D0 - D15; CAN: Any Ch1 - Ch4, any D0 - D15
Recommended Probing - LIN: Single ended; CAN: Single ended or differential
- DPO4AUTOMAX
-
Extended Automotive Serial Triggering and Analysis Module. Enables triggering on packet-level information on CAN, LIN, and FlexRay buses as well as analytical tools such as digital views of the signal, bus views, packet decoding, search tools, packet decode tables with time-stamp information, and eye diagram analysis software.
Signal Inputs - LIN: Any Ch1 - Ch4, any D0 - D15; CAN: Any Ch1 - Ch4, any D0 - D15; FlexRay: Any Ch1 - Ch4, any D0 - D15
Recommended Probing - LIN: Single ended; CAN, FlexRay: Single ended or differential
- DPO4COMP
-
Computer Serial Triggering and Analysis Module. Enables triggering on packet-level information on RS-232/422/485/UART buses as well as analytical tools such as digital views of the signal, bus views, packet decoding, search tools, and packet decode tables with time-stamp information.
Signal Inputs - Any Ch1 - Ch4, any D0 - D15
Recommended Probing - RS-232/UART: Single ended; RS-422/485: Differential
- DPO4EMBD
-
Embedded Serial Triggering and Analysis Module. Enables triggering on packet-level information on I2C and SPI buses as well as analytical tools such as digital views of the signal, bus views, packet decoding, search tools, and packet decode tables with time-stamp information.
Signal Inputs - I2C: Any Ch1 - Ch4, any D0 - D15; SPI: Any Ch1 - Ch4, any D0 - D15
Recommended Probing - Single ended
- DPO4ENET
-
Ethernet Serial Triggering and Analysis Module. Enables triggering on packet-level information on 10BASE-T and 100BASE-TX 1 buses as well as analytical tools such as digital views of the signal, bus views, packet decoding, search tools, and packet decode tables with time-stamp information.
Signal Inputs - Any Ch1 - Ch4, Math, Ref1 - Ref4
Recommended Probing - 10BASE-T: Single ended or differential; 100BASE-TX: Differential
- DPO4USB
-
USB Serial Triggering and Analysis Module. Enables triggering on packet-level content for low-speed, full-speed, and high-speed USB serial buses. Also enables analytical tools such as digital views of the signal, bus views, packet decoding, search tools, and packet decode tables with time-stamp information for low-speed, full-speed, and high-speed USB serial buses. 2
Signal Inputs - Low-speed and Full-speed: Any Ch1 - Ch4, any D0 - D15; Low-speed, Full-speed, and High-speed: Any Ch1 - Ch4, Math, Ref1 - Ref4
Recommended Probing - Low-speed and Full-speed: Single ended or differential; High-speed: Differential
- DPO4PWR
- Power Analysis Application Module. Enables quick and accurate analysis of power quality, switching loss, harmonics, safe operating area (SOA), modulation, ripple, and slew rate (dI/dt, dV/dt).
- DPO4LMT
-
Limit and Mask Testing Application Module. Enables testing against limit templates generated from "golden" waveforms and mask testing using custom or standard telecommunications or computer masks. 3
- DPO4VID
- HDTV and Custom (nonstandard) Video Triggering and Video Picture Module.
- MDO4TRIG
- Advanced RF Power Level Triggering Module. Enables the power level on the spectrum analyzer input to be used as a source in the following trigger types: Pulse Width, Runt, Timeout, Logic, and Sequence.
1 ≥350 MHz bandwidth models are recommended for 100BASE-TX
2 USB high-speed supported only on models with 1 GHz analog channel bandwidth.
3 ≥350 MHz bandwidth models are recommended for mask testing on telecomm standards >55 Mb/s. 1 GHz bandwidth models are recommended for mask testing on high-speed (HS) USB.
Instrument options
Power cord and plug options
- Opt. A0
- North America power plug (115 V, 60 Hz)
- Opt. A1
- Universal Euro power plug (220 V, 50 Hz)
- Opt. A2
- United Kingdom power plug (240 V, 50 Hz)
- Opt. A3
- Australia power plug (240 V, 50 Hz)
- Opt. A5
- Switzerland power plug (220 V, 50 Hz)
- Opt. A6
- Japan power plug (100 V, 50/60 Hz)
- Opt. A10
- China power plug (50 Hz)
- Opt. A11
- India power plug (50 Hz)
- Opt. A12
- Brazil power plug (60 Hz)
- Opt. A99
- No power cord
Language options
- Opt. L0
- English manual
- Opt. L1
- French manual
- Opt. L2
- Italian manual
- Opt. L3
- German manual
- Opt. L4
- Spanish manual
- Opt. L5
- Japanese manual
- Opt. L6
- Portuguese manual
- Opt. L7
- Simplified Chinese manual
- Opt. L8
- Traditional Chinese manual
- Opt. L9
- Korean manual
- Opt. L10
- Russian manual
- Opt. L99
- No manual
Language options include translated front-panel overlay for the selected language(s).
Service options
- Opt. C3
- Calibration Service 3 Years
- Opt. C5
- Calibration Service 5 Years
- Opt. D1
- Calibration Data Report
- Opt. D3
- Calibration Data Report 3 Years (with Opt. C3)
- Opt. D5
- Calibration Data Report 5 Years (with Opt. C5)
- Opt. G3
- Complete Care 3 Years (includes loaner, scheduled calibration, and more)
- Opt. G5
- Complete Care 5 Years (includes loaner, scheduled calibration, and more)
- Opt. R5
- Repair Service 5 Years (including warranty)
- Opt. SILV900
- Standard warranty extended to 5 years
Probes and accessories are not covered by the oscilloscope warranty and service offerings. Refer to the datasheet of each probe and accessory model for its unique warranty and calibration terms.
Recommended accessories
Probes
Tektronix offers over 100 different probes to meet your application needs. For a comprehensive listing of available probes, please visit www.tektronix.com/probes.
- TPP0500B
- 500 MHz, 10X TekVPI® passive voltage probe with 3.9 pF input capacitance
- TPP0502
- 500 MHz, 2X TekVPI® passive voltage probe with 12.7 pF input capacitance
- TPP0850
- 2.5 kV, 800 MHz, 50X TekVPI® passive high-voltage probe
- TPP1000
- 1 GHz, 10X TekVPI® passive voltage probe with 3.9 pF input capacitance
- TAP1500
- 1.5 GHz TekVPI® active single-ended voltage probe
- TAP2500
- 2.5 GHz TekVPI® active single-ended voltage probe
- TAP3500
- 3.5 GHz TekVPI® active single-ended voltage probe
- TCP0030
- 120 MHz TekVPI® 30 Ampere AC/DC current probe
- TCP0150
- 20 MHz TekVPI® 150 Ampere AC/DC current probe
- TDP0500
- 500 MHz TekVPI® differential voltage probe with ±42 V differential input voltage
- TDP1000
- 1 GHz TekVPI® differential voltage probe with ±42 V differential input voltage
- TDP1500
- 1.5 GHz TekVPI® differential voltage probe with ±8.5 V differential input voltage
- TDP3500
- 3.5 GHz TekVPI® differential voltage probe with ±2 V differential input voltage
- THDP0200
- ±1.5 kV, 200 MHz TekVPI® high-voltage differential probe
- THDP0100
- ±6 kV, 100 MHz TekVPI® high-voltage differential probe
- TMDP0200
- ±750 V, 200 MHz TekVPI® high-voltage differential probe
- P5100A
- 2.5 kV, 500 MHz, 100X high-voltage passive probe
- P5200A
- 1.3 kV, 50 MHz high-voltage differential probe
Accessories
- TPA-N-PRE
-
Preamplifier, 12 dB nominal Gain, 9 kHz - 6 GHz
- 119-4146-00
- Near field probe set, 100 kHz - 1 GHz
- 119-6609-00
- Flexible monopole antenna
- TPA-N-VPI
- N-to-TekVPI adapter
- 077-0585-xx
- Service manual (English only)
- TPA-BNC
- TekVPI® to TekProbe™ BNC adapter
- TEK-DPG
- TekVPI Deskew pulse generator signal source
- 067-1686-xx
- Power measurement deskew and calibration fixture
- SignalVu-PC-SVE
- Vector Signal Analysis Software
- TEK-USB-488
- GPIB-to-USB adapter
- ACD4000B
- Soft transit case
- HCTEK54
- Hard transit case (requires ACD4000B)
- RMD5000
- Rackmount kit
Other RF probes
- Contact Beehive Electronics to order:
- http://beehive-electronics.com/probes.html
- 101A
- EMC probe set
- 150A
- EMC probe amplifier
- 110A
- Probe cable
- 0309-0001
- SMA probe adapter
- 0309-0006
- BNC probe adapter
48W-26875-11

Tektronix is registered to ISO 9001 and ISO 14001 by SRI Quality System Registrar. Product(s) complies with IEEE Standard 488.1-1987, RS-232-C, and with Tektronix Standard Codes and Formats.


