Measuring the harmonic and spurious spectral content of low duty cycle RADAR signals presents challenges to any spectrum analyzer. Measurements with traditional swept analyzers are typically done by taking hundreds or thousands of sweeps with a ‘max-hold’ trace enabled, until the all of the spectral components of the RADAR are captured. Many sweeps are required to ensure that the analyzer is “looking at” or sweeping through each spectral component of the signal during the very instant when the very short pulse is occurring. In other words, the swept spectrum measurement has a very low probability of intercept of the RADAR pulses, thus many sweeps are required to ensure capture of all of the spectral content.
The resolution bandwidth (RBW) has to be carefully chosen to ensure that the pulse fully charges the filter and the full amplitude of the tone is recorded. If the RBW is too wide, then the noise floor will be excessive, possibly covering up low level spurs and components. If the RBW is too narrow, then the pulsed RF signal won’t reach full amplitude filter, and the results will be inaccurate.
Today’s Real-Time Spectrum/Signal Analyzers provide the ability to quickly and accurately measure the harmonic and spurious spectral content of these low duty cycle. This is done by setting up a segmented sweep, where each segment within the desired frequency span is triggered to be synchronous with the low duty cycle RADAR pulse. This ensures that each segment of the spectrum is measured at the same relative location in time within the narrow pulses, thus eliminating the traditional problem of very poor probability of intercept. Furthermore, the analyzer graphically shows you the effect of the RBW setting with respect to the RF pulse width, so that the proper RBW can be chosen. With this method, each segment has 100% probability of intercept of the RF pulse, so the measurement is completed in a single sweep! This is often orders of magnitude faster than the traditional swept methods. And, it ensures that the measurement only shows spectral content occurring during the RF pulses, not the spectral content between the pulses. This note shows how to setup these measurements on the analyzer.
The RADAR signal in this example operates at 2.7GHz with a 75us pulse width and 0.1% duty cycle. An electrical trigger pulse that is coincident, or synchronous, with the pulses is provided by the signal source. The exact timing relationship between the trigger pulse and the RF signal isn’t important (before, during, after, etc.), as long as the timing relationship is consistent from trigger to trigger.
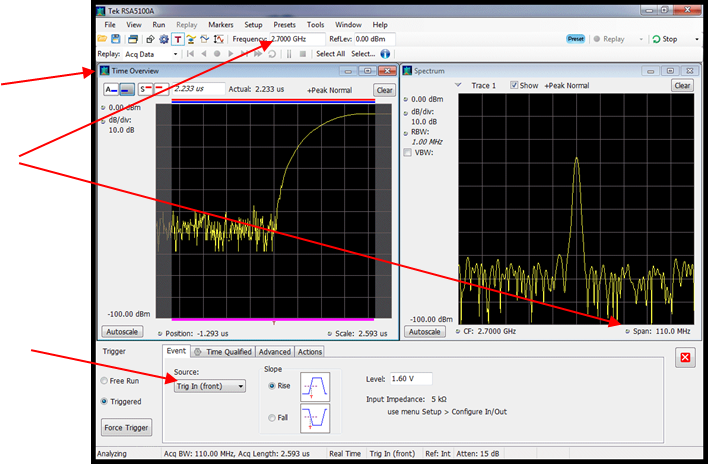
1. The first step is to setup the basic frequency and timing parameters in the analyzer. Start with the Spectrum and Time Overview displays. Set the Center Frequency to 2.7GHz and the Span to something less than or equal to the real-time bandwidth of the analyzer. Set the Reference Level as required for the signal level. Set the Trigger to use the external Trig In source, and adjust the level if necessary. Now, the leading edge of the RF pulse will be visible in the Time Overview display.

2. Under the Trigger > Advanced tab, set the Trigger Position to 10%, and check the “Trigger each segment of Swept acquisitions” checkbox.

3. In the Time Overview display, adjust the Analysis Length to 80us so that the entire RF pulse is shown in the display. The small red line in the Time Overview display illustrates where the spectrum measurement is being performed. The horizontal position of the measurement (offset) is set by the user, and the length of the spectrum measurement is typically determined by the RBW of the Spectrum display. Here we can see the spectrum measurement is “straddling” the rising edge of the pulse.

Adjust the Spectrum Offset so that the spectrum measurement starts after the RF pulse has reached its full amplitude, in this case, about 1.5us.

4. Adjust the RBW on the Spectrum display while watching the Spectrum Length in the Time Overview display. As the RBW is decreased, the spectrum length increases. Adjust the RBW until the spectrum length occupies the full pulse width (but does not exceed it). In this case, an RBW of 30kHz results in a spectrum length of 74.3us, which “fits” within the RF pulse. This is the narrowest RBW that can be used for this pulse width.

5. Under the Spectrum display Settings > Prefs tab, adjust the number of Trace points as desired.

6. Now the timing relationship of the spectrum measurements and the RF pulses are properly aligned, and the wideband spectrum measurements can be made. Close the Time Overview display, and set the Start and Stop (or Center and Span) frequencies as desired on the Spectrum analyzer. This 18GHz sweep was completed in less than 15 seconds, and all of the spurious and harmonic emissions of the pulses are captured in a single sweep.
