In new designs, the level of integration among processors, sensors, and communications has increased, blurring the traditional lines between analog, digital, RF and power system design. Wireless technology is transforming the way engineers need to innovate, design, debug and troubleshoot. Prior to the invention of the mixed domain oscilloscope there was no single instrument optimized for these types of measurements.
This technology brief explains how a mixed domain oscilloscope (MDO) combines the technology of a stateof-the-art mixed signal oscilloscope with spectrum analyzer hardware and software to provide a complete set of capabilities for measuring your highlyintegrated designs.
What is an MDO?
Before describing the technology inside, it helps to understand what makes an MDO an MDO. Traditionally, three different instruments were needed to make analog, digital and RF measurements:
- The oscilloscope, for making time-correlated measurements on analog signals in the time domain
- The logic analyzer, for making time-correlated measurements on digital signals in the time domain.A mixed signal oscilloscope (MSO) is an oscilloscope with additional digital channels
- The spectrum analyzer, for making measurements on RF signals in the frequency domain
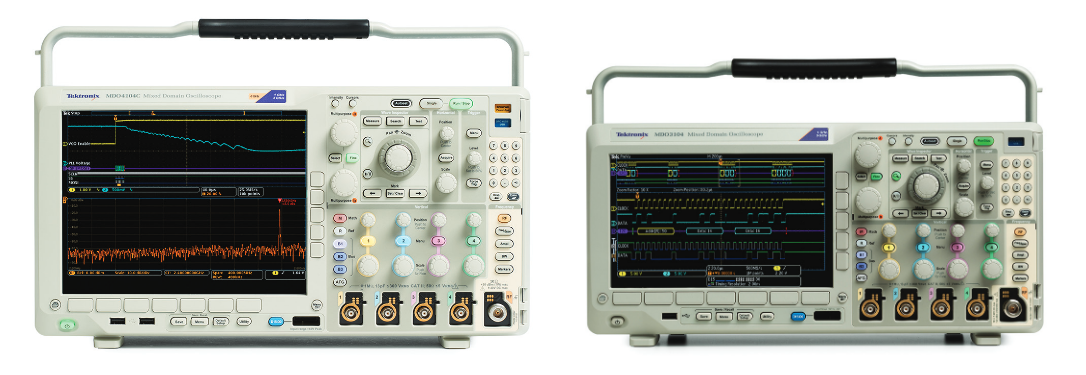
The mixed domain oscilloscope (MDO) is the first tool to integrate a mixed signal oscilloscope (which includes logic and protocol analysis capabilities) and a modern spectrum analyzer. Shown in Figure 1, they are optimized for making measurements on analog, digital, and RF signals with a full complement of input channels:
- 2 or 4 analog time-domain channels with 100 MHz, 200 MHz, 350 MHz, 500 MHz or 1 GHz of bandwidth, with serial bus decode and triggering capability
- 16 digital time-domain channels with timing resolution down to 60.6 ps, with serial bus decode and triggering capability
- 1 spectrum analyzer channel with up to a 6 GHz input frequency range
What an MDO is Not – It's Not Simply an Oscilloscope with FFT
Most oscilloscopes have the capability of calculating and displaying a Fast Fourier Transform (FFT) of the acquired time domain signal. However, an MDO has major advantages when compared against a typical oscilloscope with FFT capability:
- Superior capability and fidelity for frequency domain measurements
- Independent acquisition systems enable optimal views in both the time and frequency domains
- Spectrum measurement capabilities
Superior Capability and Fidelity for Frequency Domain Measurements
The integrated spectrum analyzer in an MDO delivers superior fidelity relative to a scope with FFT. Some key specifications are compared in Table 1 and the technology used to get these results is described in the section below, "How an MDO Achieves its RF Performance".
Large input frequency range. While oscilloscopes are available with bandwidths that can measure signals higher than 2 GHz, they are generally expensive and are not optimized for the sensitivity of RF analysis. The integrated spectrum analyzer in the MDO provides the performance required for typical RF signals without requiring the other analog channels to equal that performance. In addition, the spectrum analyzer input is specified differently from an oscilloscope input channel. While an oscilloscope's analog input rolls off to -3 dB at its bandwidth rating, the spectrum analyzer input on the MDO has a flat response to its rated frequency of 3 or 6 GHz.
Superior fidelity. Spurious Free Dynamic Range (SFDR) indicates the ability for a spectrum analyzer to detect and measure small signals in the presence of large signals. The spurious response is a result of interactions between the user's signal and the measuring instrument. They are difficult to "work around," since their frequency and amplitude change with the changing input signal. Residual spurs are caused by signals generated within the measurement instrument leaking into the signal path. They are easier to identify, since they are generally static, but can be mistaken for spurs in the user's signal. Because of their general purpose nature, oscilloscopes typically exhibit poorer SFDR than a spectrum analyzer.
Low noise performance is important for measuring low level signals, and out-of-band emissions for transmitters.
Independent Hardware and User Interface Optimized for Frequency Domain Measurements
When using an FFT on a typical oscilloscope for making frequency domain measurements, the user interface is often the same one used for time domain measurements, or layered in menus under the FFT function. This makes it difficult to make typical spectrum analyzer adjustments, such as center frequency, span, and RBW. Furthermore, With a regular scope FFT, a single acquisition system is driven by a single set of acquisition parameters (time/div, record length, and sample rate) to acquire all data shown in all views. What this means is that the vast majority of the time you can optimize the acquisition system to show the desired time domain view or the desired frequency domain view but virtually never both at the same time.
By contrast, the MDO features two acquisition systems; one for the analog and digital channels and another for the spectrum analyzer. These independent acquisition systems enable the user to obtain optimal views in both domains.
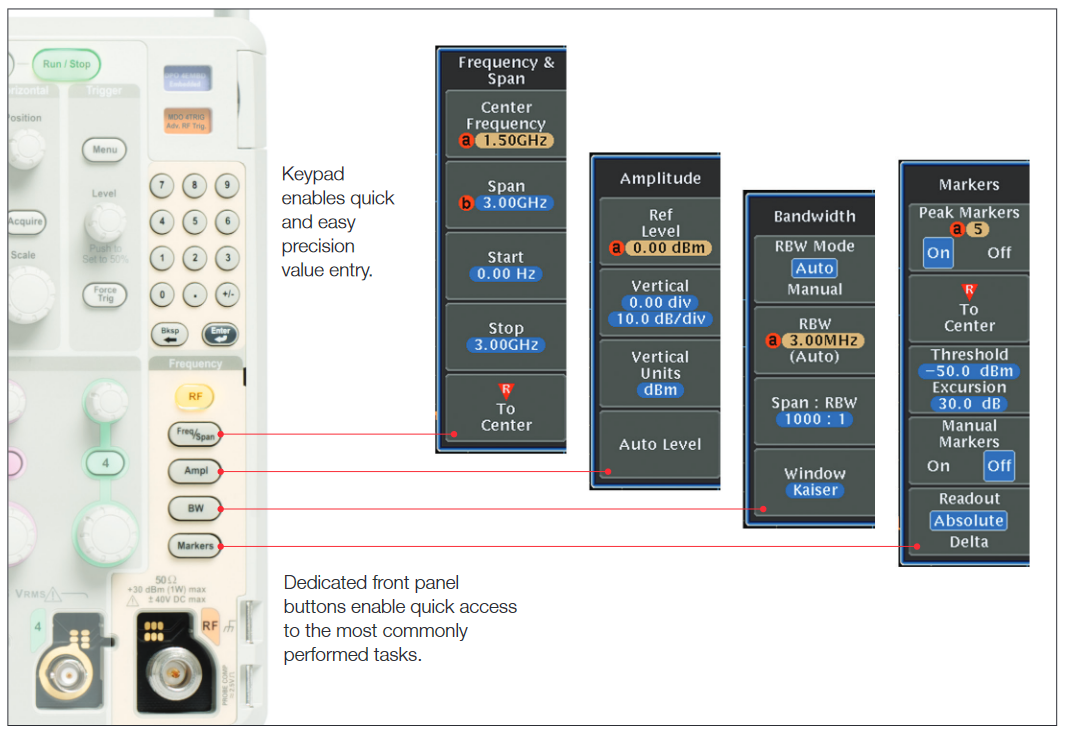
The MDO provides dedicated front panel buttons (Figure 2) for the most commonly performed spectrum analysis functions rather than the traditional FFT controls that are buried multiple layers deep in a menu structure. The numeric keypad allows easy entry of precise values.
The MDO spectrum analyzer display (Figure 3) will look familiar and intuitive to spectrum analyzer users, with labeling of amplitude grid lines as well as start and stop frequencies, peak markers, and readouts of critical frequency domain parameters, including reference level, vertical scale, center frequency, span, and resolution bandwidth (RBW).
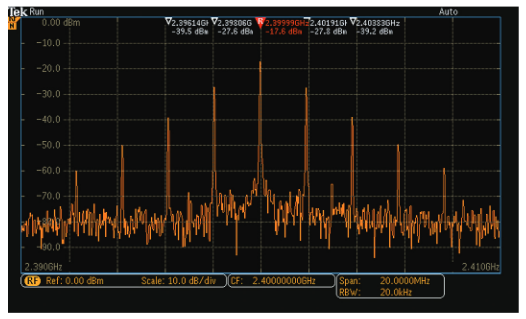
Key Spectrum Measurement Facilities
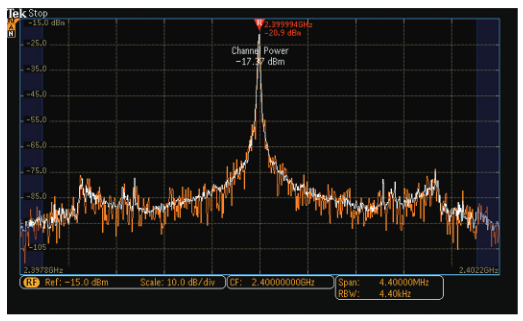
Many of the measurement features available on a stand-alone spectrum analyzer are also available on the spectrum analyzer in an MDO. As noted above and shown in Figure 3, automatic markers can continuously track up to 11 frequencies with the highest amplitude. A number of automatic RF measurements are available including channel power, adjacent channel power ratio (ACPR), and Occupied Bandwidth measurements. Figure 4 shows an example of a channel power measurement.
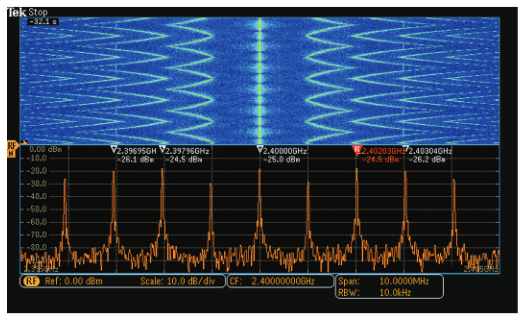
The MDO features a spectrogram function that provides valuable insight into RF signals that are changing in frequency. The spectrogram display is illustrated in Figure 5. Notice how clearly the frequency hopping nature of the signal is communicated, even though no single spectrum trace shows all of the hop frequencies.
MDO4000 Series Enables Synchronization of Analog, Digital and RF
With option SA3 or SA6, the MDO4000C Series includes additional hardware, not included in the MDO3000, that provides system-level insight not available on any other instrument:
- The ability to simultaneously see timecorrelated time domain waveforms and frequency spectrums
- The ability to see RF amplitude, phase or frequency versus time, synchronized with time domain waveforms
The analog, digital and spectrum analyzer input channels on an MDO4000 Series are all time-correlated. This allows the MDO4000 Series to show the timing relationships between, say, the serial data command to an RF transmitter and the resultant RF burst. A power supply voltage dip during a device state change can be analyzed and correlated to the impact on the RF signal.
Figure 6 shows an example of an MDO4000C multi-domain screen and how time-correlated information is presented for analysis.
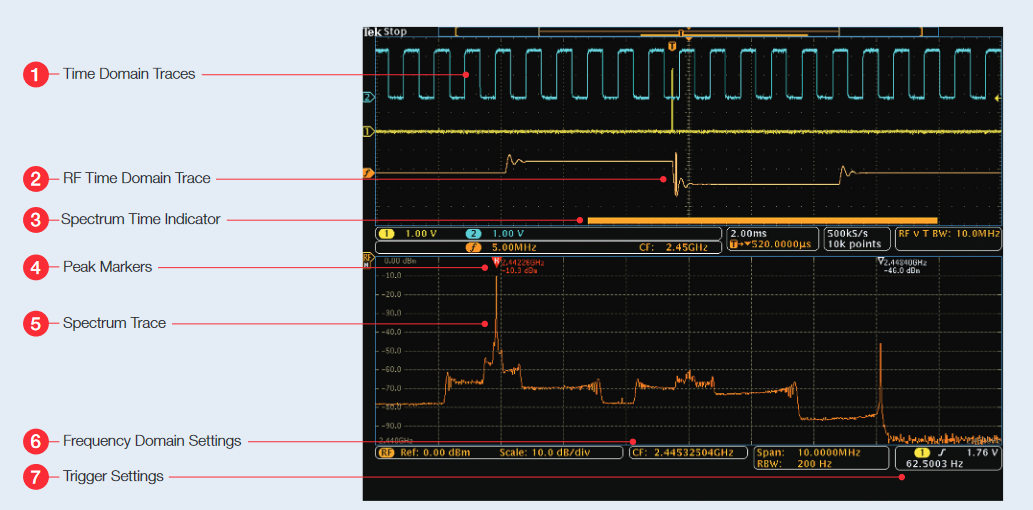
- Time Domain Traces: "Regular" analog oscilloscope traces.
- RF Time Domain Trace: A specialized time domain trace, derived from the spectrum analyzer input, which allows the user to view the amplitude, phase, or frequency of the RF signal as a function of time. They are time correlated with the other analog and digital channels and represent a continuous time domain data stream. The orange trace "f" shows the Frequency versus Time of the RF signal, quickly revealing its frequency hopping nature.
- Spectrum Time Indicator: An indication of the location, in time, of the data that is being used to generate the spectrum display. It is represented by the orange bar, seen at the bottom of the time domain window. The spectrum trace is derived from a time sampled acquisition correlated with the other analog and digital channels. The Wave Inspector® knobs control the position of Spectrum Time.
- Peak Markers: Automatic frequency and amplitude readouts for peaks.
- Spectrum Trace: The spectrum analyzer trace.
- Frequency Domain Settings: Readouts of critical frequency domain parameters, including Reference Level, Center Frequency, Span, and RBW settings.
- Trigger Settings: Readouts of trigger parameters. Because of the integration of the spectrum analyzer into the time domain-based acquisition system in the MDO4000 Series, the acquisition process can be triggered. The MDO4000 Series is able to edge trigger on the overall power level on the spectrum analyzer input. With the MDO4TRIG option, the spectrum analyzer input can be used as a trigger source for trigger types such as pulse width and runt.
How an MDO Works
In order to provide the capabilities and especially the RF measurement performance described above, an MDO has a unique architecture that may be unfamiliar to users of traditional spectrum analyzers or oscilloscopes.
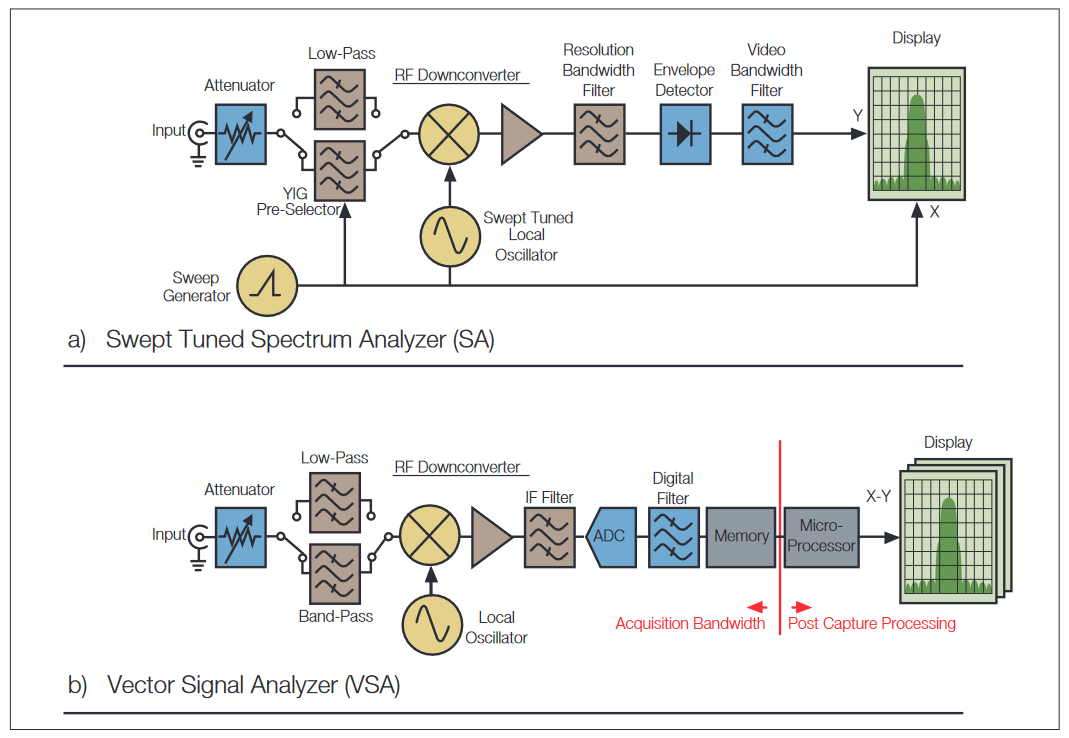
A simplified block diagram of a traditional swept spectrum analyzer is shown in Figure 7(a). The swept tuned, superheterodyne spectrum analyzer (SA) is the traditional architecture that enabled engineers to make frequency domain measurements several decades ago. Current generation SAs include digital elements such as ADCs, DSPs, and microprocessors. However, the basic swept approach remains largely the same. The SA makes power vs. frequency measurements by downconverting the signal of interest and sweeping it through the passband of a resolution bandwidth (RBW) filter. The RBW filter is followed by a detector that calculates the amplitude at each frequency point in the selected span. While this method can provide high dynamic range, its disadvantage is that it can only calculate the amplitude data for one frequency point at a time. Consequently, measurements are only valid for relatively stable, narrowband, unchanging input signals.
A Vector Signal Analyzer, VSA, architecture is shown in Figure 7(b). The VSA represents a more modern spectrum analyzer architecture in which the local oscillator is stepped, rather than swept. The resultant signal is filtered and then digitized. This results in a band-limited time domain signal that can be converted from the time domain to the frequency domain through the use of a DFT (Discrete Fourier Transform).
The resultant frequency domain information is then used to draw a small portion of the spectrum on the display around the frequency of the local oscillator. Then the local oscillator is stepped to the next higher frequency and the process repeats until the full spectrum has been drawn. Stepped analyzers are better than swept analyzers for working with time varying RF, but only when the span of interest is within the step width, which is usually quite narrow (10 MHz to 25 MHz).
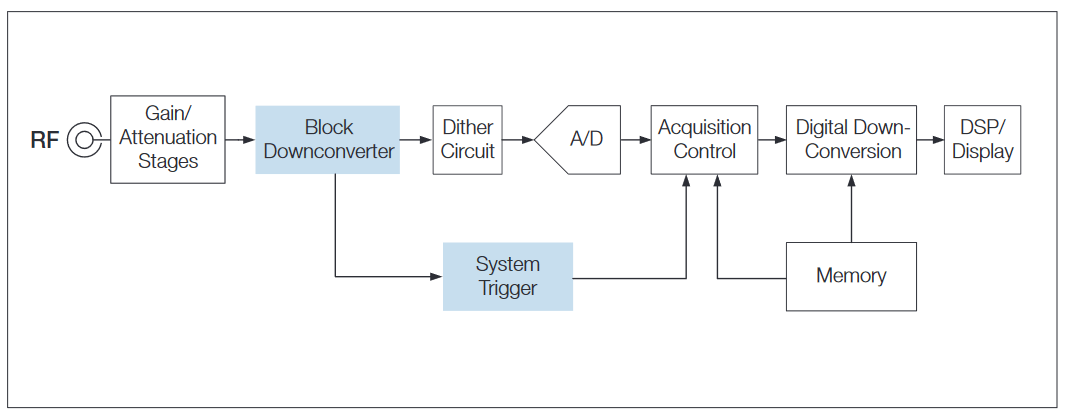
The simplified block diagram of an MDO is shown in Figure 8. The highlighted blocks are only included in the MDO4000 Series and the other blocks are common to both the MDO4000 and the MDO3000 Series. This is essentially the same architecture used by modern vector signal analyzers. The main differences between an MDO and typical VSA are, the MDO has:
- A much higher ADC sample rate which leads to exceptionally wide capture bandwidths
- A small number of fixed downconversion ranges
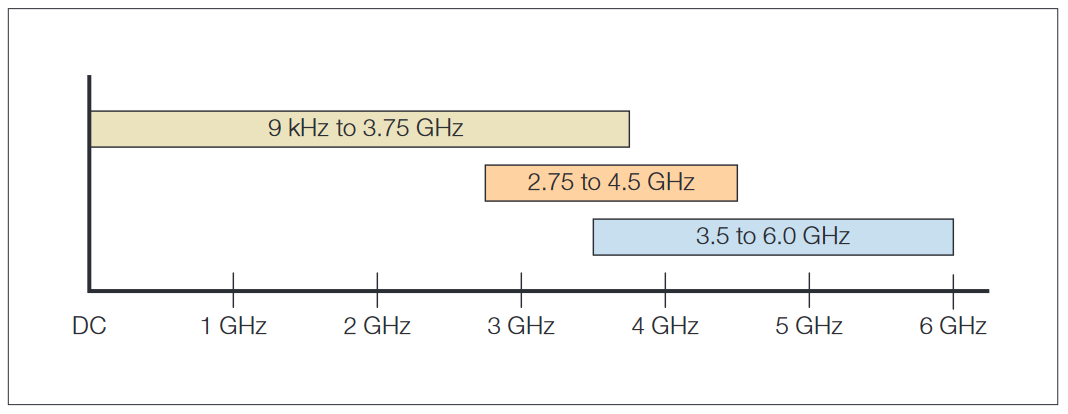
At the core of the MDO is the same Tektronix-proprietary A/D converter used in most Tektronix oscilloscopes. This 8-bit A/D converter samples at 10 GS/s and has an input bandwidth in excess of 5 GHz. On the MDO4000C, in order to extend the input frequency response in the 6 GHz MDO models, a downconverter is used before the A/D. Figure 9 shows the ranges of the MDO4000C downconverter.
In all MDOs, dither is added to the signal to improve SFDR. After data is acquired to memory, a combination of hardware and software techniques are used to perform a digital downconversion (DDC) to greatly enhance signal fidelity. This process achieves three things:
- The data record is converted to a complex I (in-phase) and Q (quadrature) data format
- The center frequency is moved to DC, to allow the IQ sample rate to be reduced to half rate
- The data is filtered and decimated to a sample rate sufficient to cover the span
The digital signal processors in the MDO perform an FFT to convert the RF time domain data to frequency domain data, in the form of a spectrum. The entire spectrum is multiplied by calibration factors to adjust the flatness and phase.
User selectable detection methods are used to determine how to decimate the 1000-2,000,000 point FFT output to a 1,000 pixel wide display. Positive peak, negative peak, average, and sample detectors are available.
Finally, the resulting spectrum is then log-scaled for display.
How an MDO Achieves its RF Performance
A Dedicated, Integrated Spectrum Analyzer Provides Better Fidelity
Because the spectrum analyzer is dedicated to RF measurements, the design of the signal path is optimized for improved spectral fidelity.
- The BNC is replaced by a higher fidelity N connector and better interconnect to the circuit board.
- Unlike a typical oscilloscope input, the spectrum analyzer input does not need to pass DC signals, nor does it need to provide offset capabilities. This allows the use of attenuator and amplifier components that are optimized for use in spectral applications.
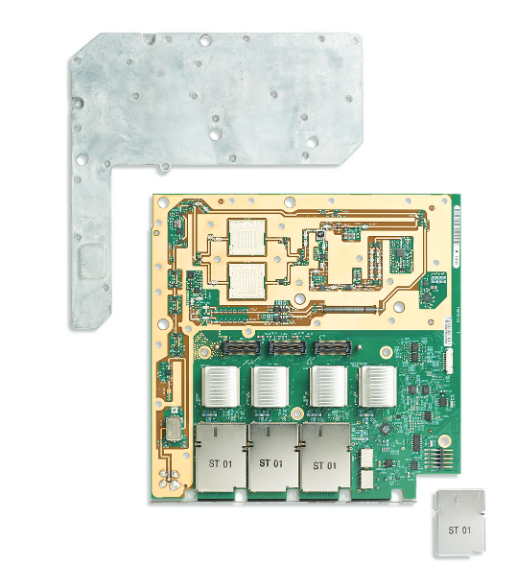
- Significantly improved shielding is provided, as shown in Figure 10.
Processing Gain Provides Improved Sensitivity
There might appear to be an inconsistency between the use of an 8-bit A/D converter and the desire to view signal details that can be more than 100 dB below full scale. This inconsistency stems from the formula that relates A/D resolution to Signal to Noise Ratio (SNR):
SNR = 6.02N + 1.76dB
Where N is the number of bits of resolution. For an 8-bit A/D converter, the noise floor is, at best, about 50 dB below full scale. This would seem to eliminate any possibility of viewing signals below this level.
However, it is important to note that the noise predicted by this equation is broadband and typically spread uniformly across the bandwidth of the A/D converter. By using a combination of DDC and DFT to reduce the bandwidth of the data that is actually processed and displayed, the noise floor is lowered, allowing visibility of small signals. This effect is called Process Gain, and it improves the signal to noise ratio as follows:
Process Gain = 10log10
Where fs is the sample rate and RBW is the resolution bandwidth of the DFT. As an example, for a 10 MHz span and an RBW of 10 kHz, given the MDO4000 Series sample rate on the spectrum analyzer channel of 10 GS/s, process gain improves the SNR by roughly 57 dB, to about 107 dB.
It is interesting to note that with an A/D sampling at 20 MS/s, which is typical for an entry level spectrum analyzer, it would require at least 12.5 bits of resolution to achieve this same SNR performance. The high sampling rate of the MDO is a critical factor in achieving its sensitivity.
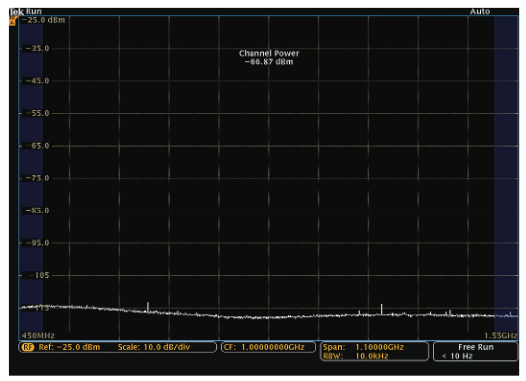
One should also note the role of RBW in the process gain equation. Recall that the Displayed Average Noise Level (DANL) specification for a spectrum analyzer is given in units of dBm/Hz. This is because the system noise is broadband and the level of noise seen at a particular setting is determined by the RBW setting. This phenomenon is demonstrated on a typical spectrum analyzer when the noise floor is reduced by 10 dB for every 10X reduction in the RBW.
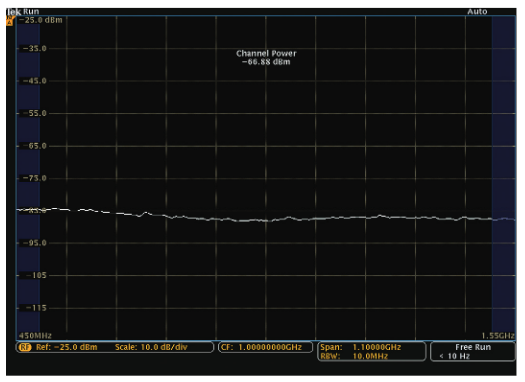
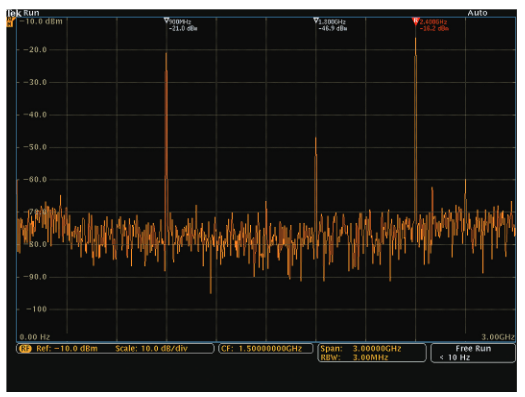
As an example, the noise floor across the 1 GHz span in Figure 11 at a 10 MHz RBW is approximately -85 dBm. In Figure 12, we now reduce the RBW in the same span 3 orders of magnitude to 10 kHz RBW. While the noise power across the span remains constant (now -65.37 dBm), the noise floor across the 1 GHz span is now down at -115 dBm for a 30 dB improvement to the noise floor.
Another important point in understanding noise performance is that, in a typical spectrum analyzer (using a 14 or 16-bit A/D), the downconverter noise output is well above the A/D noise floor. In an MDO, the noise level of the downconverter is below the noise level of the A/D. The net result is that processing gain allows the DANL specification for an MDO to be very similar to a typical spectrum analyzer.
Dither Provides Improved SFDR
There also appears to be an inconsistency between the use of an 8-bit A/D and the desire for high Spurious Free Dynamic Range (SFDR) needed for spectral measurements. In an A/D converter, Differential Nonlinearity (DNL) errors show up as spurs in the frequency domain. Lower resolution A/D converters generally have higher DNL errors, resulting in a correspondingly lower SFDR.
In a typical A/D converter, the DNL errors are not uniformly distributed but, rather, affect only a subset of the A/D codes. Because of this, dither can be used to significantly reduce DNL errors and improve SFDR. Dither is a random signal that is added to the input signal to smear its energy across multiple A/D codes, effectively averaging the individual DNL errors across all the codes. The result of adding dither is that the spurs, caused by DNL errors, are pushed closer to the noise floor.
In the MDO, dither is added above the cutoff of the 3.75 GHz IF filter, but below the 5 GHz Nyquist frequency for the A/D. The added dither signal is outside the span of interest and is filtered out during the downconversion process.
On a typical oscilloscope, adding dither would be unacceptable. Although it improves performance in the frequency domain, it would show up as noise in the time domain.
Exceptionally Wide Capture Bandwidth
The spectrum analyzer was first developed in an era when frequency domain analysis was done on RF signals that were stable over time and had simple narrowband modulation schemes, like AM or FM. Signals used in today’s digital communications, however, vary significantly with time, using sophisticated digital modulation schemes and, often, transmission techniques that involve bursts of RF. These modulation schemes can be very wide bandwidth as well.
The MDO is unique is in its extremely wide acquisition bandwidth. Typical stepped spectrum analyzers have capture bandwidths of around 10 MHz. Thanks to their architecture MDOs provide a minimum of 1 GHz of capture bandwidth. At span settings of 1 GHz and below, there is no requirement to "sweep" the display. The MDO has a minimum capture bandwidth of 1 GHz at all center frequencies and as much as 3.75 GHz in some cases. Rather than sweeping or stepping across the frequency range of interest, the RF signal path feeds the high sample rate A/D. The resultant time domain record is stored in memory and the spectrum is generated from a single acquisition whose timespan is defined by the RBW setting. This not only provides wide capture bandwidth, but also saves time compared to a traditional swept analyzer or narrow-band FFT analyzer, which can take a significant amount of time (the sweep time) to capture the range of frequencies associated with a wide span.
RF Domain Triggering on the MDO4000 Series
The oscilloscope-based acquisition system in the MDO4000 Series also provides an inherently triggered acquisition system. Data is acquired in a single contiguous time-domain record. This record is then digitally downconverted to the desired span and then run through a DFT to convert it to the frequency domain. As a result, the entire set of frequency domain data displayed for a single acquisition is time consistent - it comes from the same triggered data record.
Generating RF Time Domain Data in the MDO4000 Series
Generating RF Time Domain Data in the MDO4000 Series
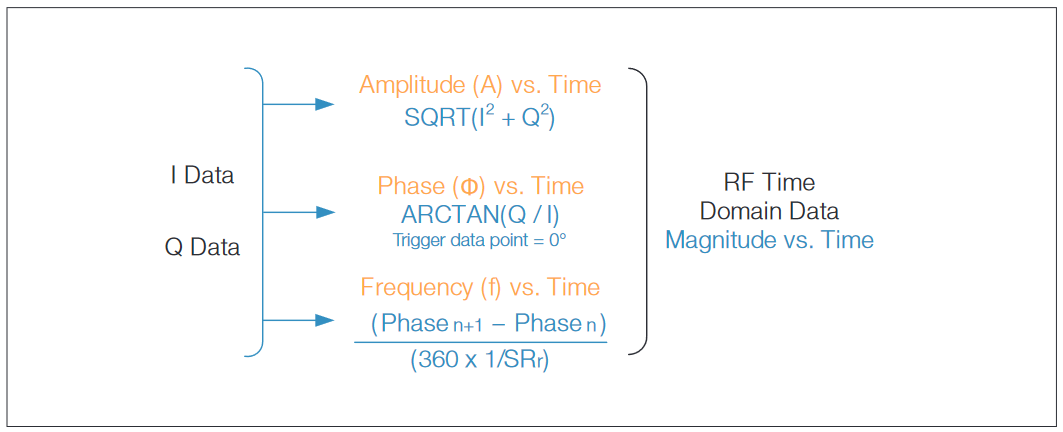
On the MDO4000 Series, the I and Q data from digital downconversion are also used to generate RF Time Domain traces. After digital downconversion, the IQ data is a Cartesian representation of the RF signal. As such, the IQ data can be transformed into amplitude, phase, and frequency information as shown in Figure 14.
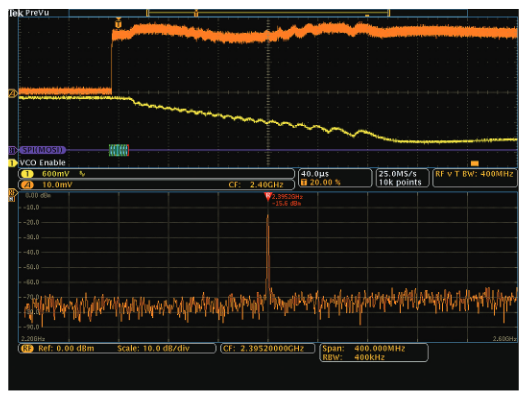
The resulting RF time domain data can be plotted, along with other time domain traces, in the time domain graticule, as shown in Figure 15. All time domain data, including the RF traces, analog, digital, and spectrum analyzer channels are time aligned in the graticule, allowing the user to evaluate timing relationships between these various channels.
Conclusion
Both the MDO3000 and MDO4000 Series provide the convenience of having multiple instruments in one integrated platform. The MDO4000 Series with its ability to show both the time and frequency domains in a synchronized view, is great for EMI troubleshooting and integrating wireless transceivers.
While using oscilloscope technology to build a high-fidelity spectrum analyzer is a significant break from tradition, there are techniques that allow it to be done effectively. These techniques include:
- The use of a dedicated spectrum analyzer input to improve fidelity
- The use of digital downconversion and DFT techniques to leverage process gain for improved sensitivity
- The use of dither to improve SFDR
- Improved shielding
By using these techniques, MDOs achieve the fidelity needed to make spectral measurements, while reaping the benefits that an integrated oscilloscope provides. These benefits include:
- Wide capture bandwidth of at least 1 GHz at any center frequency and up to 3.75 GHz in specific instances.
- Cost and space benefits of sharing a single chassis, display, interfaces, power supplies, etc
- Convenience of a single, integrated instrument
- On the MDO4000 Series
- Time correlation with analog and digital channels
- The ability to view RF time domain data beyond the typical zero span provided by a spectrum analyzer
Find more valuable resources at TEK.COM
Copyright © Tektronix. All rights reserved. Tektronix products are covered by U.S. and foreign patents, issued and pending. Information in this publication supersedes that in all previously published material. Specification and price change privileges reserved. TEKTRONIX and TEK are registered trademarks of Tektronix, Inc. All other trade names referenced are the service marks, trademarks or registered trademarks of their respective companies.
05.16 48W-60187-2