Achieving Better Energy Efficiency in AI Data Centers With Power Integrity Testing
Introduction
Deployment of AI-based technology is happening in the Data Center. The processor-intensive servers are driving up energy demands. The table below illustrates the magnitude of the impact. The International Energy Agency (IEA) predicts that data centers will account for up to seven percent of global electricity consumption by 2030; a number equivalent to the entire country of India’s electricity consumption.
| CPU/GPU Technology | Current | Impedance | Watts (Cabinet Avg) |
|---|---|---|---|
|
Today’s non-AI Server CPU |
400 A |
100 µΩ |
25 kW |
|
Early AI GPU’s |
800 A |
50 µΩ |
75 kW |
|
Latest AI GPU |
1,400 A |
28 µΩ |
110 kW |
|
Next Gen GPU |
2,000 A |
20 µΩ |
500 kW-1MW |
Figure 1: Power Consumption of CPU & GPU technology in Data Center.
With this growing demand for power, the emphasis on energy efficiency is critical. Partnering with Steve Sandler, a highly-recognized power integrity expert; Tektronix has developed good measurement techniques to improve Operations/Watt of next generation AI Data Centers.
Improving Power Delivery Network (PDN) Energy-Efficiency
PDNs must provide many low-noise DC power rails for sensitive loads driving the GPU’s in these server racks. The quest for more speed and higher density means faster edge rates, higher frequencies and more rails, but at lower voltage levels and higher currents as illustrated above. This puts emphasis on good power integrity.
The goal of making power integrity measurements is to validate that the voltage and current reaching the Point of Load (POL) meet the load’s power rail specifications under all expected operating conditions. Special attention is required to accurately measure millivolts of power rail noise at GHz frequencies.
Let’s take a look at how to assess PDN performance with a high-level view of a power distribution network on a server-based system.
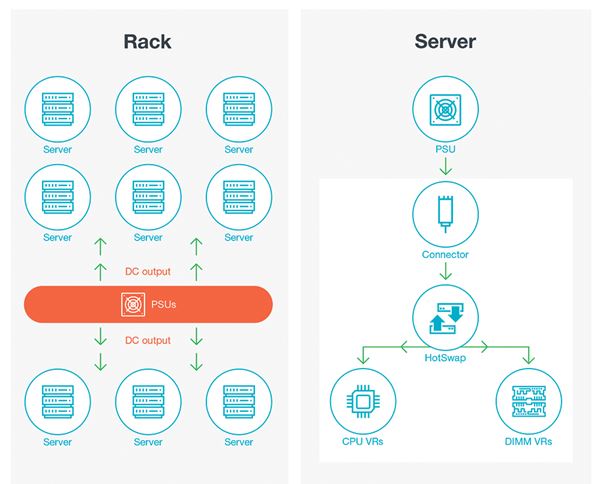
Figure 2: High Level Power Distribution Network in the Data Center.
As shown here, typical data centers supply power to their AI-based servers via a 12, 24, or 48 V DC supply that then gets converted down to other supply voltages on the motherboard. Being able to look at every link in the chain from supply output to FPGAs, processors and other complex IC’s, engineers must manage power rail impedance at a very low level in order to deliver the high current found in the AI-centric servers being driven by GPU technology. What complicates impedance management is the network is made up of many impedances including the voltage regulator, decoupling capacitors, and PCB traces. High-speed switching and hot-swappable server cards brings unexpected variations in impedance, which can result in excessive transients or noise.
Ensuring a stable, energy-efficient design starts by minimizing noise in the PDN. Noise specifications on power rails can go up into MHz or GHz frequency ranges with amplitudes in millivolts.
Assessing for energy-efficiency starts with making power quality measurements on the AC line inputs and outputs to ensure line voltage and line current. Measurement values to assess quality are shown below:
- Frequency
- RMS voltage and current
- Impedance
- Crest Factor (voltage and current)
- True, reactive, and apparent power
- Power factor and phase
To ensure these measurements are made accurately; oscilloscope probe selection is important; using a differential probe to measure the line voltage of the system and a current probe to measure the line current of the system.
Another critical measurement is to perform Frequency Response Analysis of the PDN’s control loop response. This will provide valuable information about the speed of the control loop and stability of the power supply. A Bode plot is used to view the analysis, and here is an example setup in Figure 3.
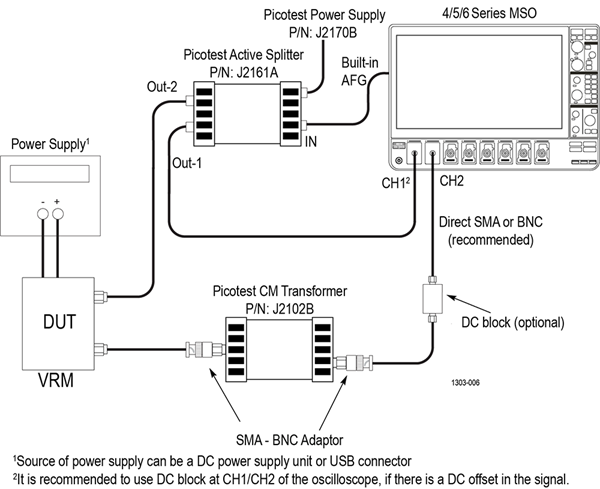
Figure 3: Measurement setup for Impedance in a Power Distribution Network.
Power Integrity Probing Systems Deserve Attention
The high-impedance 10X passive probes that come with today’s oscilloscopes may have enough bandwidth, but they attenuate the very noise signal you’re trying to measure. 1X probes pass the noise signal without attenuation, but they are limited to several MHz bandwidth. Transmission line probes or cables with 50 Ω input impedance offer great high-frequency performance but cause significant loading at DC, unless a DC Block is added. Attenuating transmission line probes offer less loading while maintaining low noise and high bandwidth.
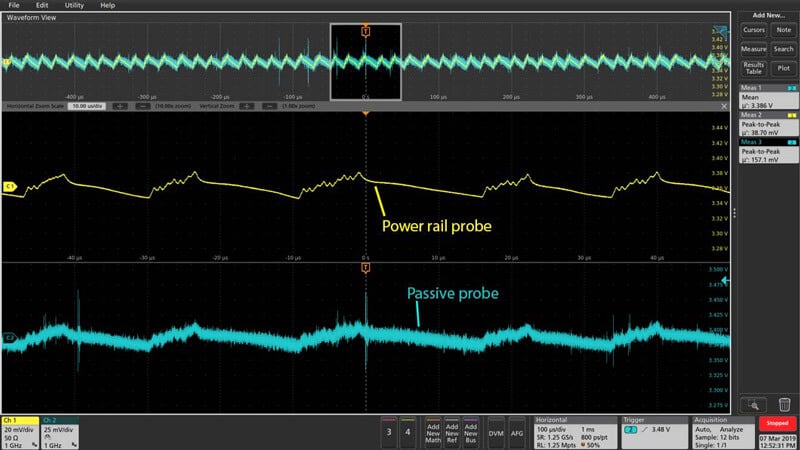
Power Rail Probes are another category of probes that provide low noise and high offset range at up to 4 GHz with DC offset ranging from -60 to +60 Vdc. This is seen as a more accurate alternative to traditional Passive Probes in identifying sources of noise; as shown below in Figure 4. Depending on the voltage of the power rail, a DC block might be required. If this is the case, be sure it offers inrush protection for the oscilloscope and that isn’t DC or AC bias sensitive. Power rail probes, while very low noise, are also single ended. To assist, look for coaxial isolators that further minimize measurement ground loop errors. Picotest offers a selection of DC Blocks and Coaxial Isolators to support these needs. Learn more about the Ultimate Power Rail Noise Measurement.
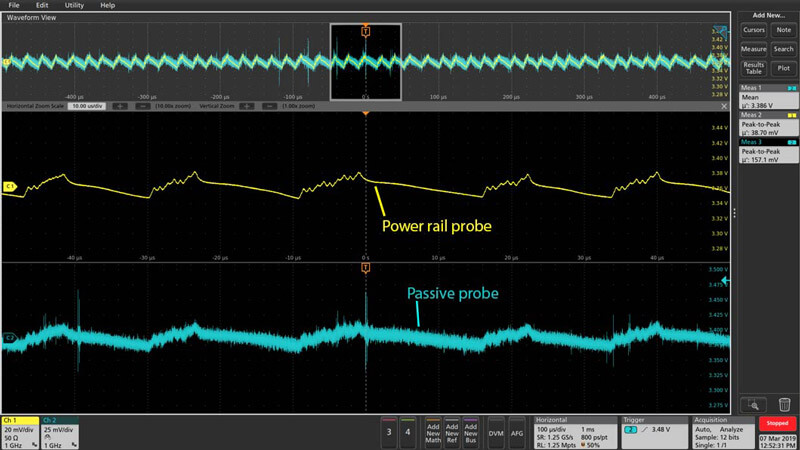
Figure 4: A comparison of power supply line measurements of ripple with a passive probe (below trace) and power rail probe (above trace). See the difference?
Fast, low-noise acquisitions combined with ultra-fast-edge loads emulate AI-level processor workloads; allowing for an accurate assessment of power rail noise voltage and power-rail to power rail crosstalk on PDN designs. Combined with either a Tektronix 5 Series B MSO or 6 Series B MSO oscilloscopes; Picotest offers a complete line of loads up to 2,000 amps, 1ns edge loads supporting a sample rate of up to 65MS/s for accurate emulation efforts. (see Figure 5)
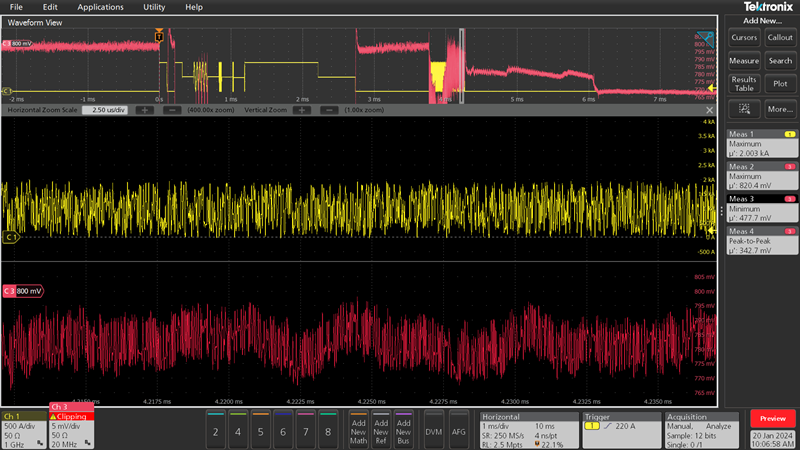
Figure 5. A characterization showing a pseudorandom step of a high-amplitude load for AI-level processor. Accuracy in this characterization is enabled using Picotest loads and measured by a Tektronix 6 Series B MSO oscilloscope, ideal for low-noise and high-resolution signal capture.
Oscilloscope Measurement Analysis Saves Time, Reduces Errors
Identification and analysis of trouble spots in a PDN can take time. Looking for ripple, overshoot, under-shoot, turn-on, turn-off, time-trend, settling time, and jitter in a power delivery network is a complex undertaking. Thankfully, most of today’s modern oscilloscopes provide built-in analysis software to setup the instrument & automate the signal acquisition and display. Below is an example showing an automated measurement of ripple. Having this built-in to the instrument and capable of being automated from a remote PC simplifies large team efforts to evaluate AI-enabled performance over time and temperature variants to stress the efficiency and durability of the server.
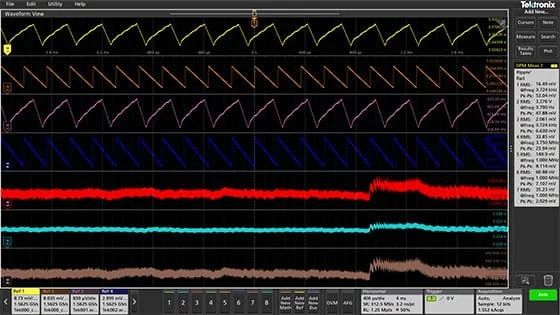
Figure 6: Automated Ripple Measurement with annotation results in right side of a 5 Series B MSO Oscilloscope display.
Summary
With artificial intelligence (AI) driving up the energy demand on next-generation data centers; it is becoming more critical than ever to assess the performance and efficiency of the power delivery network.
Having a good test and measurement strategy for PDN evaluation will lead to an optimally functioning, AI-ready data center in terms of performance, reliability and energy efficiency.


