연락처
텍트로닉스 담당자와 실시간 상담 6:00am-4:30pm PST에 이용 가능
전화 문의
9:00am-6:00PM KST에 이용 가능
다운로드
매뉴얼, 데이터 시트, 소프트웨어 등을 다운로드할 수 있습니다.
피드백
5 Series B Mixed Signal Oscilloscopes Quick Start
Install and set up your 5 Series B Mixed Signal Oscilloscopes. This manual introduces the user interface and basic oscilloscope operations.
이 매뉴얼은 다음에 적용됩니다.:
MSO54B, MSO56B, MSO58B
By downloading, you agree to the terms and conditions of the Manuals Download Agreement.
Manuals Download Agreement
ATTENTION: please read the following terms and conditions carefully before downloading any documents from this website. By downloading manuals from Tektronix' website, you agree to the following terms and conditions:
Manuals for Products That Are Currently Supported:
Tektronix hereby grants permission and license to owners of Tektronix instruments to download and reproduce the manuals on this website for their own internal or personal use. Manuals for currently supported products may not be reproduced for distribution to others unless specifically authorized in writing by Tektronix, Inc.
A Tektronix manual may have been revised to reflect changes made to the product during its manufacturing life. Thus, different versions of a manual may exist for any given product. Care should be taken to ensure that one obtains the proper manual version for a specific product serial number.
Manuals for Products That Are No Longer Supported:
Tektronix cannot provide manuals for measurement products that are no longer eligible for long term support. Tektronix hereby grants permission and license for others to reproduce and distribute copies of any Tektronix measurement product manual, including user manuals, operator's manuals, service manuals, and the like, that (a) have a Tektronix Part Number and (b) are for a measurement product that is no longer supported by Tektronix.
A Tektronix manual may be revised to reflect changes made to the product during its manufacturing life. Thus, different versions of a manual may exist for any given product. Care should be taken to ensure that one obtains the proper manual version for a specific product serial number.
This permission and license does not apply to any manual or other publication that is still available from Tektronix, or to any manual or other publication for a video production product or a color printer product.
Disclaimer:
Tektronix does not warrant the accuracy or completeness of the information, text, graphics, schematics, parts lists, or other material contained within any measurement product manual or other publication that is not supplied by Tektronix or that is produced or distributed in accordance with the permission and license set forth above.
Tektronix may make changes to the content of this website or to its products at any time without notice.
Limitation of Liability:
TEKTRONIX SHALL NOT BE LIABLE FOR ANY DAMAGES WHATSOEVER (INCLUDING, WITHOUT LIMITATION, ANY CONSEQUENTIAL OR INCIDENTAL DAMAGES, DAMAGES FOR LOSS OF PROFITS, BUSINESS INTERRUPTION, OR FOR INFRINGEMENT OF INTELLECTUAL PROPERTY) ARISING OUT OF THE USE OF ANY MEASUREMENT PRODUCT MANUAL OR OTHER PUBLICATION PRODUCED OR DISTRIBUTED IN ACCORDANCE WITH THE PERMISSION AND LICENSE SET FORTH ABOVE.
Read Online
OPERATING BASICS
- Add a channel waveform to the display
- Configure channel or waveform settings
- Autoset to quickly display a waveform
- How to trigger on a signal
- Set the acquisition mode
- Set Horizontal parameters
- Add a math, reference, or bus waveform
- Add a measurement
- Configure a measurement
- Add a plot of a measurement
- Add a Search
- Delete a Measurement or Search badge
- Change waveform view settings
- Display and configure cursors
- Remote access from a Web browser
- Connect the oscilloscope to a PC using a USB cable
Documentation
Review the following user documents before installing and using your instrument. These documents provide important operating information.
Product documentation
The following table lists the primary product specific documentation available for your product. These and other user documents are available for download from tek.com. Other information, such as demonstration guides, technical briefs, and application notes, can also be found at tek.com.
| Document | Content |
|---|---|
| Help | In-depth operating information for the product. Available from the Help button in the product UI and as a PDF on tek.com. |
| Quick Start User Manual | Introduction to product hardware and software, installation instructions, turn on, and basic operating information. |
| Specifications and Performance Verification Technical Reference | Instrument specifications and performance verification instructions for testing instrument performance. |
| Programmer Manual | Commands for remotely controlling the instrument. |
| Declassification and Security Instructions | Information about the location of memory in the instrument. Instructions for declassifying and sanitizing the instrument. |
| Service Manual | Replaceable parts list, theory of operations, and repair and replace procedures for servicing an instrument. |
| Upgrade Instructions | Product upgrade installation information. |
| Rackmount Kit Instructions | Installation information for assembling and mounting an instrument using a specific rackmount. |
How to find your product documentation
- Go to tek.com.
- Click Download in the green sidebar on the right side of the screen.
- Select Manuals as the Download Type, enter your product model, and click Search.
- View and download your product manuals. You can also click the Product Support Center and Learning Center links on the page for more documentation.
Important safety information
This manual contains information and warnings that must be followed by the user for safe operation and to keep the product in a safe condition.
To safely perform service on this product, see the Service safety summary that follows the General safety summary.
General safety summary
Use the product only as specified. Review the following safety precautions to avoid injury and prevent damage to this product or any products connected to it. Carefully read all instructions. Retain these instructions for future reference.
This product shall be used in accordance with local and national codes.
For correct and safe operation of the product, it is essential that you follow generally accepted safety procedures in addition to the safety precautions specified in this manual.
The product is designed to be used by trained personnel only.
Only qualified personnel who are aware of the hazards involved should remove the cover for repair, maintenance, or adjustment.
Before use, always check the product with a known source to be sure it is operating correctly.
This product is not intended for detection of hazardous voltages.
Use personal protective equipment to prevent shock and arc blast injury where hazardous live conductors are exposed.
While using this product, you may need to access other parts of a larger system. Read the safety sections of the other component manuals for warnings and cautions related to operating the system.
When incorporating this equipment into a system, the safety of that system is the responsibility of the assembler of the system.
To avoid fire or personal injury
Use proper power cord
Use only the power cord specified for this product and certified for the country of use.
Ground the product
This product is grounded through the grounding conductor of the power cord. To avoid electric shock, the grounding conductor must be connected to earth ground. Before making connections to the input or output terminals of the product, ensure that the product is properly grounded. Do not disable the power cord grounding connection.
Power disconnect
The power cord disconnects the product from the power source. See instructions for the location. Do not position the equipment so that it is difficult to operate the power cord; it must remain accessible to the user at all times to allow for quick disconnection if needed.
Connect and disconnect properly
Do not connect or disconnect probes or test leads while they are connected to a voltage source.
Use only insulated voltage probes, test leads, and adapters supplied with the product, or indicated by Tektronix to be suitable for the product.
Observe all terminal ratings
To avoid fire or shock hazard, observe all rating and markings on the product. Consult the product manual for further ratings information before making connections to the product.
Do not exceed the Measurement Category (CAT) rating and voltage or current rating of the lowest rated individual component of a product, probe, or accessory. Use caution when using 1:1 test leads because the probe tip voltage is directly transmitted to the product.
Do not apply a potential to any terminal, including the common terminal, that exceeds the maximum rating of that terminal.
Do not float the common terminal above the rated voltage for that terminal.
The measuring terminals on this product are not rated for connection to Category III or IV circuits.
Do not operate without covers
Do not operate this product with covers or panels removed, or with the case open. Hazardous voltage exposure is possible.
Avoid exposed circuitry
Do not touch exposed connections and components when power is present.
Do not operate with suspected failures
If you suspect that there is damage to this product, have it inspected by qualified service personnel.
Disable the product if it is damaged. Do not use the product if it is damaged or operates incorrectly. If in doubt about safety of the product, turn it off and disconnect the power cord. Clearly mark the product to prevent its further operation.
Before use, inspect voltage probes, test leads, and accessories for mechanical damage and replace when damaged. Do not use probes or test leads if they are damaged, if there is exposed metal, or if a wear indicator shows.
Examine the exterior of the product before you use it. Look for cracks or missing pieces.
Use only specified replacement parts.
Do not operate in wet/damp conditions
Be aware that condensation may occur if a unit is moved from a cold to a warm environment.
Do not operate in an explosive atmosphere
Keep product surfaces clean and dry
Remove the input signals before you clean the product.
Provide proper ventilation
Refer to the installation instructions in the manual for details on installing the product so it has proper ventilation.
Slots and openings are provided for ventilation and should never be covered or otherwise obstructed. Do not push objects into any of the openings.
Provide a safe working environment
Always place the product in a location convenient for viewing the display and indicators.
Avoid improper or prolonged use of keyboards, pointers, and button pads. Improper or prolonged keyboard or pointer use may result in serious injury.
Be sure your work area meets applicable ergonomic standards. Consult with an ergonomics professional to avoid stress injuries.
Use care when lifting and carrying the product. This product is provided with a handle or handles for lifting and carrying.
Use only the Tektronix rackmount hardware specified for this product.
Probes and test leads
Before connecting probes or test leads, connect the power cord from the power connector to a properly grounded power outlet.
Keep fingers behind the protective barrier, protective finger guard, or tactile indicator on the probes. Remove all probes, test leads and accessories that are not in use.
Use only correct Measurement Category (CAT), voltage, temperature, altitude, and amperage rated probes, test leads, and adapters for any measurement.
Beware of high voltages
Understand the voltage ratings for the probe you are using and do not exceed those ratings. Two ratings are important to know and understand:
- The maximum measurement voltage from the probe tip to the probe reference lead.
- The maximum floating voltage from the probe reference lead to earth ground.
These two voltage ratings depend on the probe and your application. Refer to the Specifications section of the manual for more information.
 | WARNING:To prevent electrical shock, do not exceed the maximum measurement or maximum floating voltage for the oscilloscope input BNC connector, probe tip, or probe reference lead. |
Connect and disconnect properly.
Connect the probe output to the measurement product before connecting the probe to the circuit under test. Connect the probe reference lead to the circuit under test before connecting the probe input. Disconnect the probe input and the probe reference lead from the circuit under test before disconnecting the probe from the measurement product.
De-energize the circuit under test before connecting or disconnecting the current probe.
Connect the probe reference lead to earth ground only.
Do not connect a current probe to any wire that carries voltages or frequencies above the current probe voltage rating.
Inspect the probe and accessories
Before each use, inspect probe and accessories for damage (cuts, tears, or defects in the probe body, accessories, or cable jacket). Do not use if damaged.
Ground-referenced oscilloscope use
Do not float the reference lead of this probe when using with ground-referenced oscilloscopes. The reference lead must be connected to earth potential (0 V).
Floating measurement use
Do not float the reference lead of this probe above the rated float voltage.
Service safety summary
The Service safety summary section contains additional information required to safely perform service on the product. Only qualified personnel should perform service procedures. Read this Service safety summary and the General safety summary before performing any service procedures.
To avoid electric shock
Do not touch exposed connections.
Do not service alone
Do not perform internal service or adjustments of this product unless another person capable of rendering first aid and resuscitation is present.
Disconnect power
To avoid electric shock, switch off the product power and disconnect the power cord from the mains power before removing any covers or panels, or opening the case for servicing.
Use care when servicing with power on
Dangerous voltages or currents may exist in this product. Disconnect power, remove battery (if applicable), and disconnect test leads before removing protective panels, soldering, or replacing components.
Verify safety after repair
Always recheck ground continuity and mains dielectric strength after performing a repair.
Terms in this manual
These terms may appear in this manual:
| WARNING:Warning statements identify conditions or practices that could result in injury or loss of life. |
| CAUTION:Caution statements identify conditions or practices that could result in damage to this product or other property. |
Terms on the product
These terms may appear on the product:
- DANGER indicates an injury hazard immediately accessible as you read the marking.
- WARNING indicates an injury hazard not immediately accessible as you read the marking.
- CAUTION indicates a hazard to property including the product.
Symbols on the product
 | When this symbol is marked on the product, be sure to consult the manual to find out the nature of the potential hazards and any actions which have to be taken to avoid them. (This symbol may also be used to refer the user to ratings in the manual.) |
The following symbols(s) may appear on the product.
 CAUTION: Refer to Manual |  Protective Ground (Earth) Terminal |  Standby |  Chassis Ground |  Functional Earth Terminal |
Compliance information
This section lists the EMC, safety, and environmental standards with which the instrument complies. This product is intended for use by professionals and trained personnel only; it is not designed for use in households or by children.
| Questions about compliance information may be directed to the following address: |
| Tektronix, Inc. |
| PO Box 500, MS 19-045 |
| Beaverton, OR 97077, USA |
| tek.com |
EMC compliance
These products are Class A instruments and are not intended to be used in a residential environment.
Safety compliance
This section lists the safety compliance information.
Equipment type
Test and measuring equipment.
Safety class
Class 1 – grounded product.
Safety certification of plug-in or VXI modules
The safety certification is valid only when installed in an appropriately approved (by a USA NRTL or a Canada Certified Organization) mainframe.
Pollution degree description
A measure of the contaminants that could occur in the environment around and within a product. Typically the internal environment inside a product is considered to be the same as the external. Products should be used only in the environment for which they are rated.
- Pollution Degree 1. No pollution or only dry, nonconductive pollution occurs. Products in this category are generally encapsulated, hermetically sealed, or located in clean rooms.
- Pollution Degree 2. Normally only dry, nonconductive pollution occurs. Occasionally a temporary conductivity that is caused by condensation must be expected. This location is a typical office/home environment. Temporary condensation occurs only when the product is out of service.
- Pollution Degree 3. Conductive pollution, or dry, nonconductive pollution that becomes conductive due to condensation. These are sheltered locations where neither temperature nor humidity is controlled. The area is protected from direct sunshine, rain, or direct wind.
- Pollution Degree 4. Pollution that generates persistent conductivity through conductive dust, rain, or snow. Typical outdoor locations.
Pollution degree rating
Pollution Degree 2 (as defined in IEC 61010-1). Note: Rated for indoor, dry location use only.
IP rating
IP20 (as defined in IEC 60529).
Measurement and overvoltage category descriptions
Measurement terminals on this product may be rated for measuring mains voltages from one or more of the following categories (see specific ratings marked on the product and in the manual).
- Overvoltage Category I. For equipment intended to be connected to a mains supply in which means have been taken to substantially and reliably reduce transient overvoltages to a level where they cannot cause a hazard.
- Measurement Category II. For measurements performed on circuits directly connected to the low-voltage installation.
- Measurement Category III. For measurements performed in the building installation.
- Measurement Category IV. For measurements performed at the source of low-voltage installation.
| Note:Only mains power supply circuits have an overvoltage category rating. Only
measurement circuits have a measurement category rating. Other circuits within the
product do not have either rating. |
Mains overvoltage category rating
Overvoltage Category II (as defined in IEC 61010-1)
Environmental compliance
This section provides information about the environmental impact of the product.
Product end-of-life handling
Observe the following guidelines when recycling an instrument or component:
- Equipment recycling
- Production of this equipment required the extraction and use of natural resources. The equipment may contain substances that could be harmful to the environment or human health if improperly handled at the product’s end of life. To avoid release of such substances into the environment and to reduce the use of natural resources, we encourage you to recycle this product in an appropriate system that will ensure that most of the materials are reused or recycled appropriately.
 |
This symbol indicates that this product complies with the applicable European Union requirements according to Directives 2012/19/EU and 2006/66/EC on waste electrical and electronic equipment (WEEE) and batteries. For information about recycling options, check the Tektronix Web site (http://www.tek.com/productrecycling). |
- Battery recycling
- This product contains a small installed lithium metal button cell. Please properly dispose of or recycle the cell at its end of life according to local government regulations.
- Perchlorate materials
- This product contains one or more type CR lithium batteries. According to the state of California, CR lithium batteries are classified as perchlorate materials and require special handling. See www.dtsc.ca.gov/hazardouswaste/perchlorate for additional information.
Transporting batteries
The small lithium primary cell contained in this equipment does not exceed 1 gram of lithium metal content per cell.
The cell type has been shown by the manufacturer to comply with the applicable requirements of the UN Manual of Tests and Criteria Part III, Sub-section 38.3. Consult your carrier to determine which lithium battery transportation requirements are applicable to your configuration, including to its re-packaging and re-labeling, prior to reshipment of the product by any mode of transport.
Preface
This manual provides product safety and compliance information, describes how to connect and power on the oscilloscope, and introduces the instrument features, controls and basic operations. See the product Help document for more detailed information. Go to tek.com/warranty-status-search for warranty information.
Key features
Welcome to the 5 Series B Mixed Signal Oscilloscope. The 5 Series B MSO includes FlexChannel® inputs, enabling you to efficiently and cost-effectively perform mixed signal debugging on virtually any design.
- Bandwidths from 350 MHz to 2 GHz
- 4, 6, or 8 channels with FlexChannel® inputs
- Each FlexChannel input is dual-purpose, letting you connect either an analog probe (TekVPI® or BNC) or an eight-channel digital probe (the TLP058 FlexChannel Logic Probe)
- Each FlexChannel can display 8 digital channels (with TLP058), an analog waveform, a spectrum view, or both an analog and spectral view of the same channel at the same time with independent controls for each view
- FlexChannel inputs are compatible with TekVPI® probes
- Large 15.6” HD (1920 x 1080 pixel) capacitive touch-screen display
- User interface designed to optimize touch screen use and quickly access key settings
- Stacked mode places each channel or waveform in its own horizontal 'slice' on the screen, allowing for cleaner signal viewing and measuring
- Maximum 6.25 GS/s sample rate
- 62.5 M points record length on all channels (optional 125 M, 250 M, and 500 M record lengths available)
- >500,000 waveforms/second maximum waveform capture rate
- Cursors analysis: Waveform, V Bars, H Bars, V&H Bars, Multi source cursor (readouts)
- Spectrum View enables simple, intuitive frequency domain analysis, independent of time domain controls, to show a spectral trace for each channel
- No set limit on the number of math, reference, and bus waveforms you can display (the number of waveforms depends on available system memory)
- Integrated optional features include a 100 MHz arbitrary function generator (AFG), and a DVM and trigger frequency counter
- Optional serial triggering features enable you to isolate protocol-level events of interest in common aerospace, audio, automotive, computer, and embedded serial buses. See the Serial bus and trigger options topic in the instrument Help, or the Serial Triggering and Analysis Applications Datasheet (Tektronix part number 48W-61353-X) for more information.
- Power, DPM, Spectrum measurements, IMDA, and Jitter options provide additional measurement and analysis functions. See the Advanced Power Analysis, DPM Analysis, and Advanced Jitter Analysis Help topics. IMDA application is available on MSO56B and MSO58B only.
Installing your instrument
Check shipped accessories
Make sure that you received everything you ordered. If anything is missing, contact Tektronix Customer Support. In North America, call 1-800-833-9200. Worldwide, visit www.tek.com to find contacts in your area.
Check the packing list that came with your instrument to verify that you have received all standard accessories and ordered items. If you purchased factory installed options such as a Serial Bus and Triggering option, or the Power measurements option, tap Help > About to confirm that the options are listed in the Installed Options table.
| Item | Quantity | Tektronix part number |
|---|---|---|
| 5 Series B MSO Installation and Safety Manual | 1 | 071-3773-xx |
| TPP0500B Passive Voltage Probe (500 MHz bandwidth). Shipped with 350 MHz and 500 MHz models. | One per channel | TPP0500B |
| TPP1000 Passive Voltage Probe (1 GHz bandwidth). Shipped with 1 GHz and 2 GHz models. | One per channel | TPP1000 |
| Front cover | 1 | 200-5406-xx |
| Accessory pouch (attached to front cover) | 1 | 016-2106-xx |
| Power cord | 1 | Depends on region |
| Calibration certificate | 1 | N/A |
| Report of factory installed licenses | 1 | N/A |
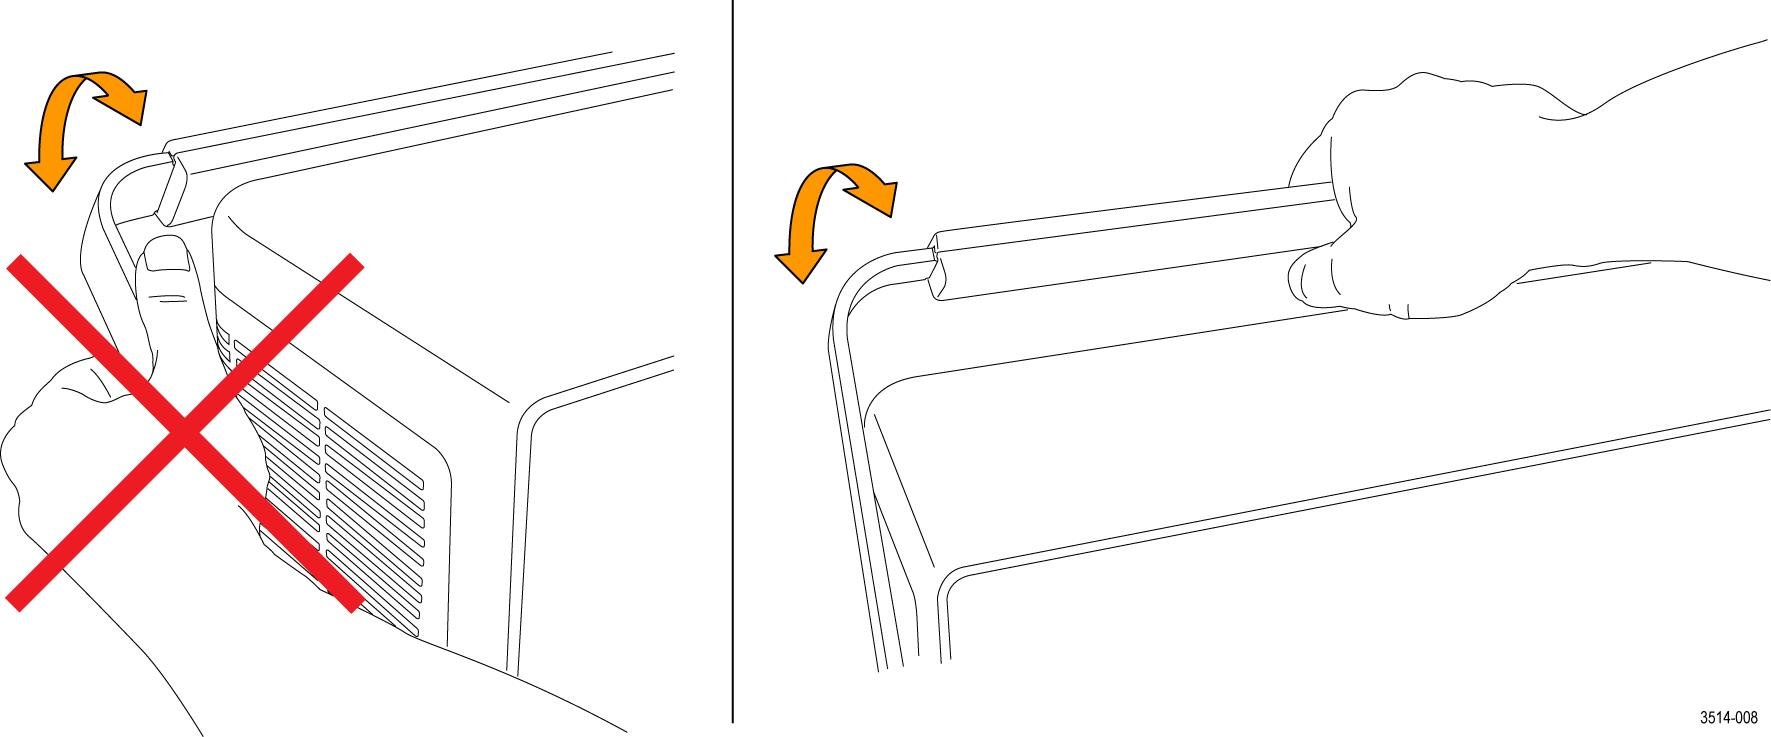
Safely rotate the handle
Use the correct process to eliminate the chance of pinching your thumb or rear-panel-connected cables while rotating the handle.
| WARNING:Hold the top of the handle to rotate the handle on the instrument. Do not hold the handle from the sides and rotate, as this can pinch the base of your thumb between the handle and the case. |
| CAUTION:If you have routed any cables between the handle and the case, be careful when rotating the handle so that you do not pinch the cables. |
Operating requirements
Use the instrument within the required operating temperature, power, altitude, and signal input voltage ranges to provide the most accurate measurements and safe instrument operation.
| Characteristic | Description |
|---|---|
| Operating temperature | 0 °C to +50 °C (+32 °F to +122 °F) |
| For proper cooling, keep the sides and rear of the instrument clear of obstructions for 2 inches (51 mm). | |
| Operating humidity | 5% to 90% relative humidity (% RH) up to +40 °C (+104 °F), non-condensing. |
| 5% to 55% RH above +40 °C up to +50 °C (+104 °F to +122 °F), non-condensing. | |
| 5% to 90% RH at temperatures up to +60°C (+140°F), non-condensing, and as limited by a maximum wet-bulb temperature of +39°C (+102°F). | |
| Operating altitude | Up to 3000 meters (9842 feet) |
| Characteristic | Description |
|---|---|
| Power source voltage | 100 V - 240 VAC RMS, ±10%, single phase |
| Power source frequency | 50/60 Hz, 100-240 V |
| 400 Hz, 115 V | |
| Power consumption | 400 W maximum |
Input signal requirements
Keep the input signals within allowed limits to ensure the most accurate measurements and prevent damage to the analog and digital probes or instrument.
Make sure that input signals connected to the instrument are within the following requirements.
| Input | Description |
|---|---|
| Analog input channels, 1 MΩ setting, maximum input voltage at BNC | 300 VRMS |
| Measurement Category II | |
| Analog input channels, 50 Ω setting, maximum input voltage at BNC | 5 VRMS, at 100 mV/div, with peaks ≤ ±20 V (Pulse Width ≤200 us) |
| Measurement Category II | |
| Digital input channels, maximum input voltage range at digital inputs | Observe probe ratings |
| TLP058; ±42 VP | |
| Ref In maximum input voltage at BNC (rear panel) | 7 VPP |
| Aux In trigger input | ±5 VRMS |
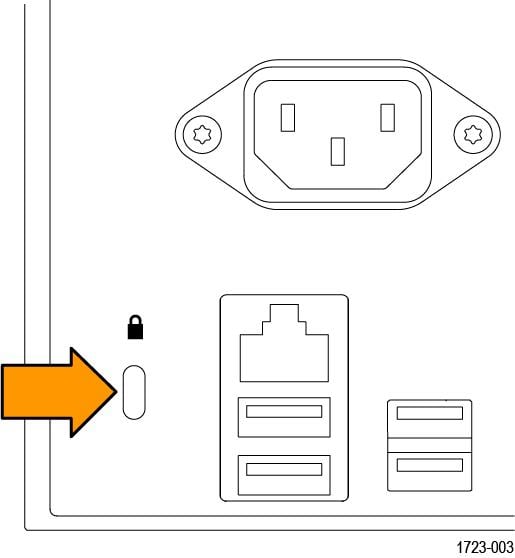
Secure (lock) the instrument
Lock an instrument to a test bench or equipment rack to prevent property loss.
Powering the instrument
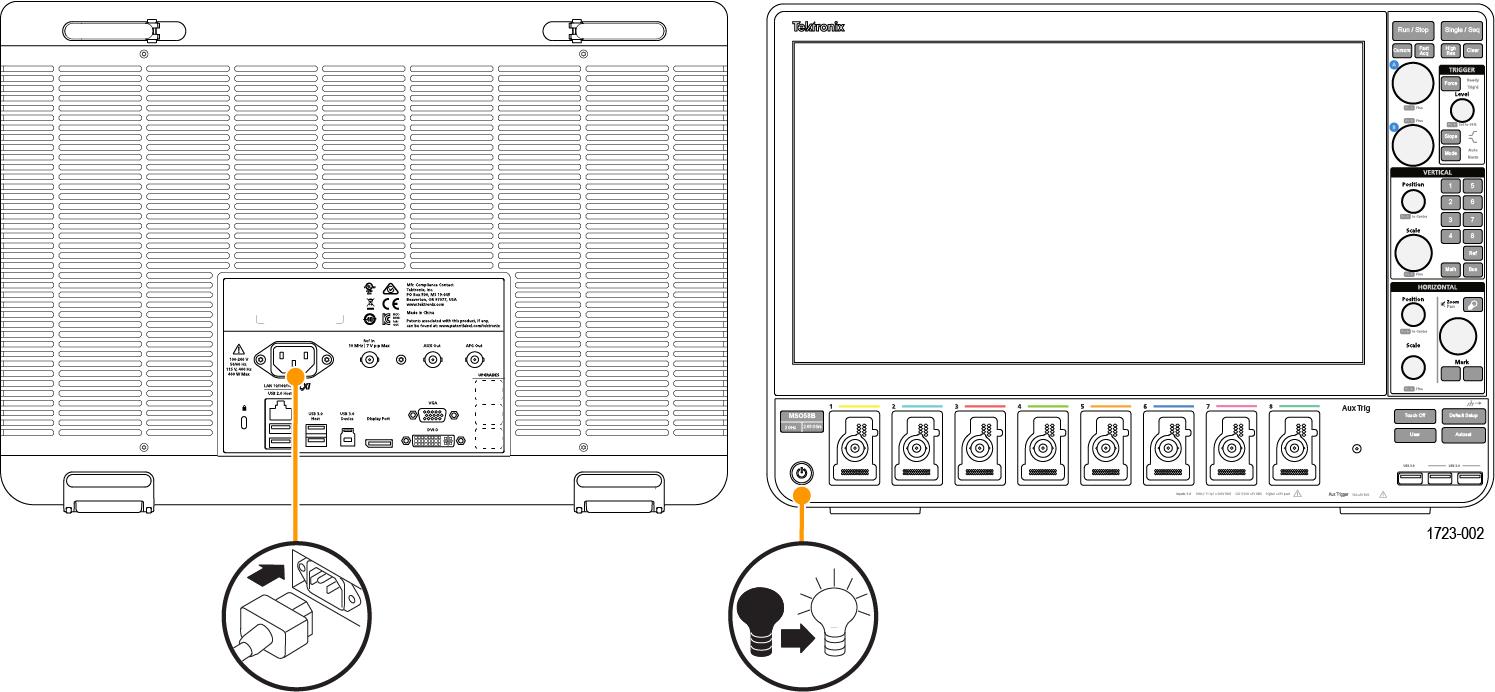
Use this procedure to connect the instrument to line power and power on and off the instrument. Always connect the instrument to AC power using the power cord that shipped with the instrument.
Prerequisite: Use the AC power cord that shipped with your instrument.
- Connect the supplied power cord to the instrument power connector on the back of the instrument.
Figure 1. Power cord connector and power standby switch 
- Connect the power cord to an appropriate AC mains source.
Power is supplied to the power supply and some other boards whenever the AC power cord is connected to a live mains circuit, putting the instrument in standby mode.
- Push the front panel power button to power the instrument on and off.The power button color indicates instrument power states:
- Unlit – no AC power applied
- Yellow – standby mode
- Blue – powered on
- To completely remove power from the instrument, disconnect the power cord.
- To transport the instrument with its power cord, flip out the power cord supports on the upper edge of the rear panel and wrap the power cord around the supports.
Check that the instrument passes power-on self tests
Power-on self tests verify that all instrument modules are working correctly after power up.
Procedure
- Power on the instrument and wait until the instrument screen appears.
- Select Utility > Self Test from the top-edge Menu bar to open the Self Test configuration menu.
- Check that the status of all power-on self tests are Passed.
- Power cycle the instrument.
- Select Utility > Self Test. If one or more power-on self tests still shows Failed, contact Tektronix Customer Support.
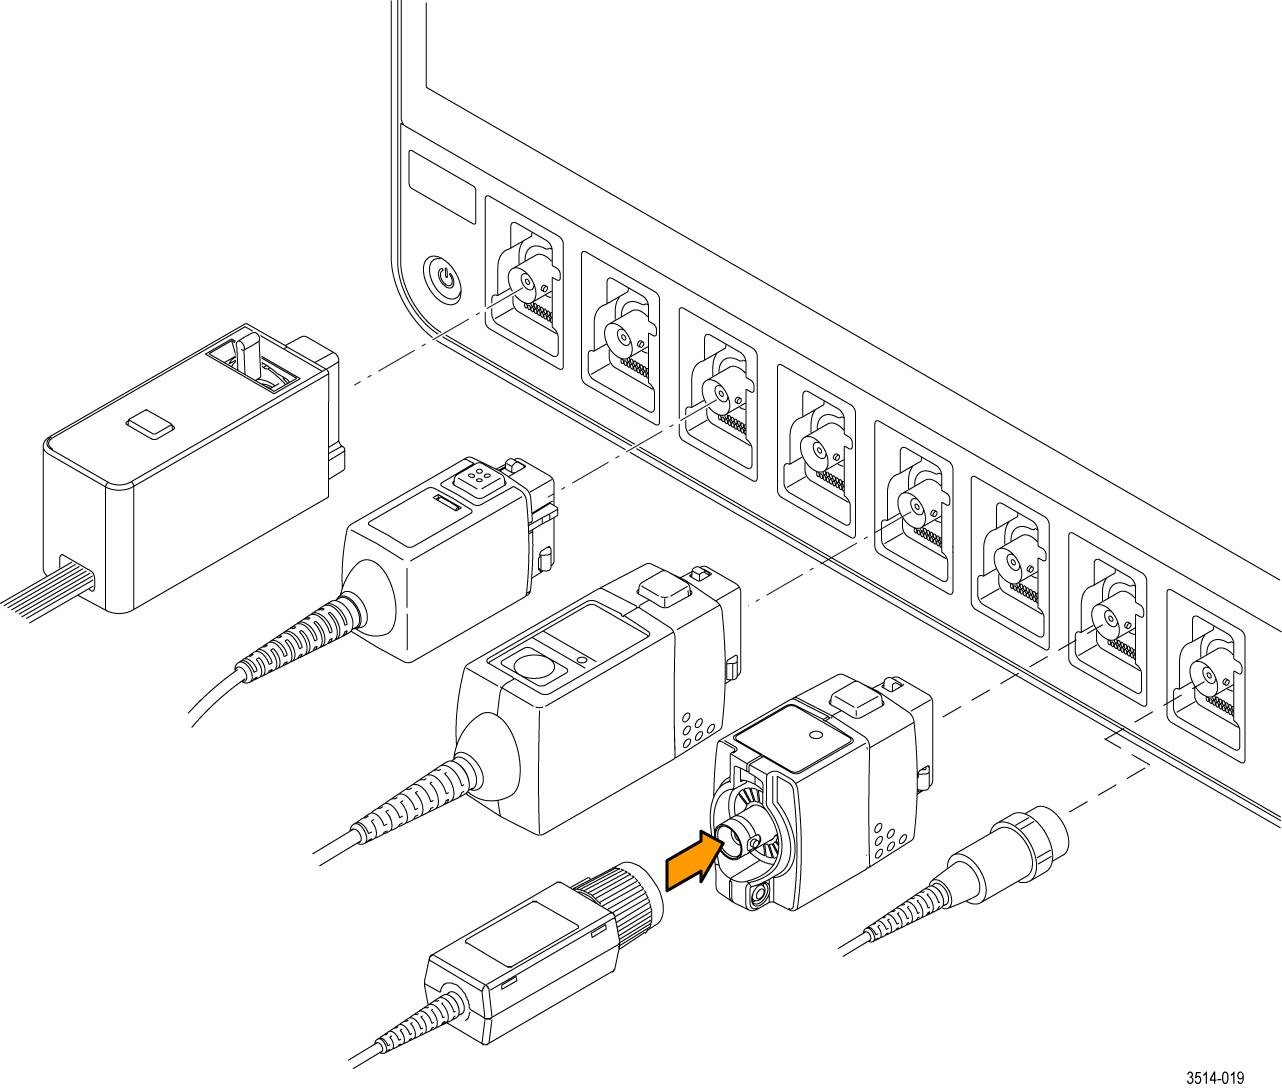
Connecting probes to the instrument
Probes connect the instrument to your device under test (DUT). Use a probe that best matches your signal measurement needs.
Connect TPP Series, TekVPI+, TekVPI, or other supported Tektronix analog probes by pushing them into a FlexChannel connector. The probe base latch locks with a 'click' when the probe is fully seated.
TekVPI probes automatically set the channel input parameters for that probe (bandwidth, attenuation, termination, and so on). If a probe has a Menu button, push that button to open an on-screen configuration menu. Follow instructions provided with active probes to set their parameters (auto zero, degauss, and so on).
To connect a TLP058 FlexChannel Logic Probe:
- Move the locking lever to the unlocked position, then let go to reset locking lever to the center position.
- Insert the probe into a FlexChannel connector until fully seated and the lock mechanism clicks.
- Move the locking lever to the locked position. The status light should be a solid green.
- To disconnect the TLP058 probe, move and hold the locking lever at the unlocked position and pull out the probe. Do not pull on the ribbon cable while removing the probe.
Connect a BNC probe or cable by pushing it onto a channel BNC bayonet connector and turn the lock mechanism clockwise until it locks.
| Note:Connecting a probe does not automatically enable that channel (make it active). Use the instrument controls or programmatic interface to turn on a channel and open its configuration menu to verify or change probe or cable settings (bandwidth, attenuation, termination and so on). |
Rackmount option information
An optional rackmount kit lets you install the oscilloscope in standard equipment racks.
Please refer to the product datasheet at tek.com for information on rackmount options.
Getting acquainted with your instrument
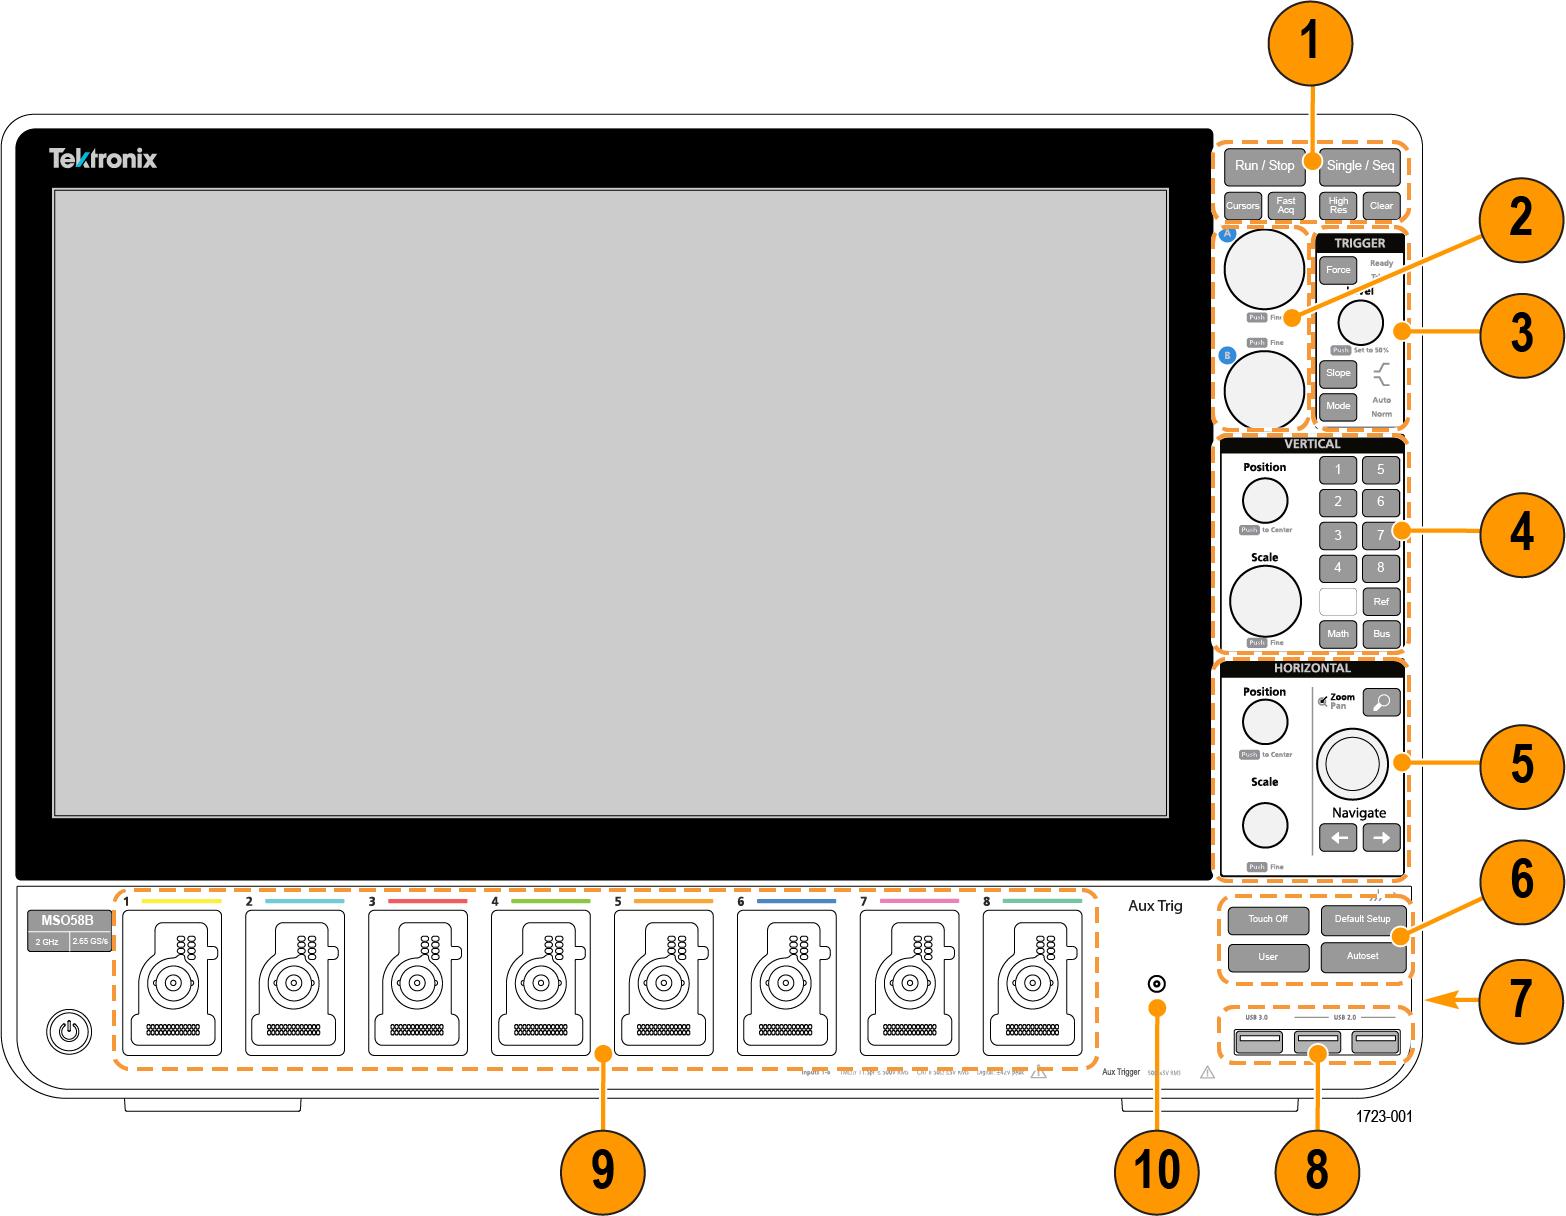
Front panel controls and connectors
The front panel controls provide direct access to key instrument settings such as vertical, horizontal, trigger, cursors, and zoom. The connectors are where you input signals with probes or cables, or insert USB devices.
| Note:Refer to the instrument help for detailed information on using the controls to display waveforms and take measurements. |
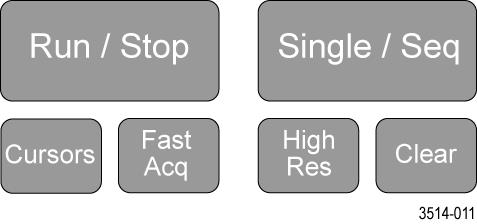
-
Acquisition and Cursors controls:
- Run/Stop starts and stops waveform acquisition. The button color indicates the acquisition status (green = running and acquiring; red = stopped). When stopped, the oscilloscope shows waveforms from the last completed acquisition. The Run/Stop button on the screen also shows the acquisition status.
- Cursors button turns screen cursors on or off. Use the Multipurpose knobs to move the cursors. Double-tap the cursor readouts, or on a cursor bar (line), to open the configuration menu to set cursor types and functionality.
- Fast Acq™ enables or disables the fast acquisition mode. FastAcq provides high-speed waveform capture that reduces the dead time between waveform acquisitions, enabling the capture and display of transient events such as glitches and runt pulses. It is helpful in finding elusive signal anomalies. Fast acquisition mode can also display waveform phenomena at an intensity that reflects their rate of occurrence.
- Single/Seq enables making a single waveform acquisition, or a specified number of acquisitions (as set in the Acquisition configuration menu). Pushing Single/Seq turns off Run/Stop mode and takes a single acquisition. The button color indicates the acquisition status (quick green flash = single acquisition acquired; solid green = waiting for trigger event). Pushing Single/Seq again takes another single acquisition.
-
High Res applies unique finite impulse response (FIR) filters based on the current sample rate. This FIR filter maintains the maximum bandwidth possible for that sample rate while rejecting aliasing. The filter removes noise from the oscilloscope amplifiers and ADC above the usable bandwidth for the selected sample rate. Implementation of the filter in hardware, ahead of the trigger and storage, reduces trigger jitter and enables using Fast Acq mode while in High Res mode.
High Res mode also guarantees at least 12 bits of vertical resolution. The number of bits of resolution is displayed in the Acquisition badge at the bottom of the screen. The Horizontal badge also updates to show the sample rate and record length settings while in High Res mode.
- Clear deletes the current acquisitions and measurement values from memory.
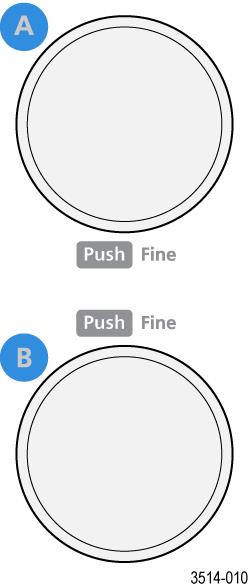
-
Multipurpose knobs: The Multipurpose knobs A and B move cursors and set parameter values in configuration menu input fields. Selecting an menu field that can use a Multipurpose knob assigns the indicated knob to change the value in that input field. The ring around each knob lights when you can use that knob to do an action. Push a Multipurpose knob to enable the Fine mode for making smaller increment changes. Push the knob again to exit Fine mode.
-
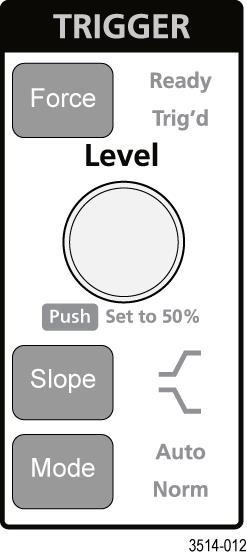
Trigger controls:
- Force forces a trigger event at a random point in the waveform and captures the acquisition.
- Level sets the amplitude level that the signal must pass through to be considered a valid transition. The color of the Level knob LED indicates the trigger source except for dual-level triggers.
The Level knob is disabled when the trigger type requires two level settings or other trigger qualifiers (set from the Trigger configuration menu). Push the knob to set the threshold level to 50% of the peak-to-peak amplitude range of the signal.
- Slope sets the signal transition direction to detect for a trigger (low to high, high to low, or either direction). Push the button to cycle through the selections. The Slope button is disabled when the trigger type requires other slope qualifiers (set from the Trigger configuration menu).
-
Mode sets how the instrument behaves in the absence or presence of a trigger event:
- Auto trigger mode enables the instrument to acquire and display a waveform whether or not a trigger event occurs. If a trigger event occurs, the instrument displays a stable waveform. If a trigger event does not occur, the instrument forces a trigger event and acquisition and displays an unstable waveform.
- Normal trigger mode sets the instrument to acquire and display a waveform only when there is a valid trigger event. If no trigger occurs, the last waveform record acquired remains on the display. If no last waveform exists, no waveform is displayed.
-
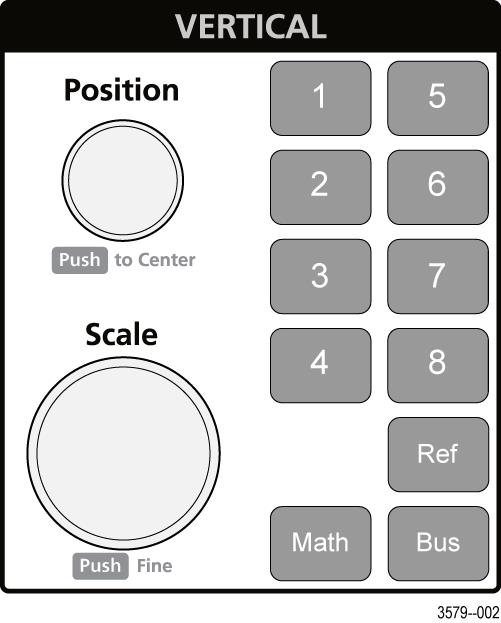
Vertical controls:
- Position moves the selected waveform (Channel, Math, Reference, Bus) and its graticule up or down on the screen. The color of the Position knob indicates which waveform the knob is controlling. Push the knob to set the threshold level to 50% of the peak-to-peak amplitude range of the signal.
- Scale sets the amplitude units per vertical graticule division of the selected waveform. The scale values are shown on the right edge of the horizontal graticule lines, and are specific to the selected waveform in both Stacked or Overlay modes (in other words, each waveform has its own unique vertical graticule settings regardless of display mode). The color of the Scale knob indicates which waveform the knob is controlling.
-
Channel buttons turn on (display), select, or turn off Channel, Math, Reference, or Bus waveforms. The number of channel buttons depends on the instrument model. The buttons operate as follows:
- If the channel is not displayed, pushing a Channel button turns on that channel to the Waveform view.
- If the channel is on the screen and is not selected, pushing that channel's button selects that channel.
- If the channel is on the screen and is also selected, pushing that channel's button turns that channel off (removes it from Waveform view).
- Math button adds or selects a Math waveform on the Waveform view.
- If no Math waveform exists, pushing the Math button adds a Math waveform to the Waveform view and opens the Math configuration menu.
- If only one Math waveform is displayed, pushing the button turns off the Math waveform (removes it from Waveform view). Push the button again to display the waveform.
- If two or more Math waveforms are displayed, pushing the button cycles through selecting each math waveform.
- Ref button adds or selects a Reference (saved) waveform on the Waveform view.
- If no Reference waveform exists, pushing the Ref button opens the Browse Waveform Files configuration menu. Navigate to and select a waveform file (*.wfm) and tap Recall to load and display the reference waveform.
- If only one Reference waveform is displayed, pushing the button turns off the Reference waveform (removes it from the Waveform View). Push the button again to display the waveform.
- If two or more Reference waveforms are displayed, pushing the button cycles through selecting each Reference waveform.
- Bus button adds or selects a bus waveform on the Waveform view.
- If no Bus waveform exists, pushing the Bus button adds a Bus waveform to the Waveform view and opens the Bus configuration menu.
- If only one Bus waveform is displayed, pushing the button turns off the Bus waveform (removes it from Waveform view).
- If two or more Bus waveforms are displayed, pushing the button cycles through selecting each Bus waveform.
-
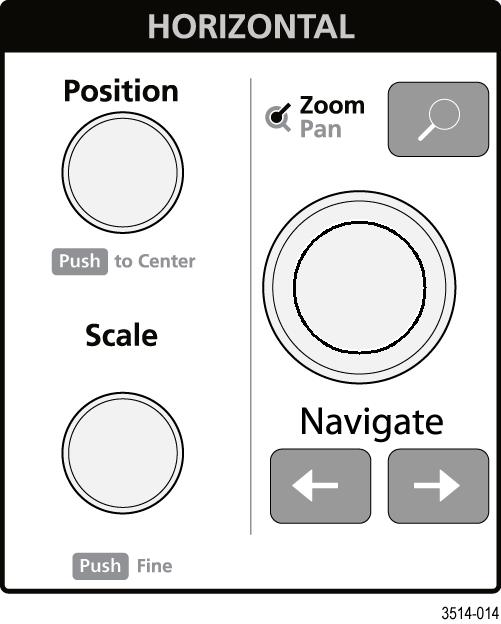
Horizontal controls:
- Position moves the waveform and graticule side to side on the screen (changing the trigger point position in the waveform record). Push the knob to center the trigger event to the center graticule on the Waveform view.
- Scale sets the time per major horizontal graticule division and samples/second parameters for the oscilloscope. Scale applies to all waveforms. Push the knob to enable the Fine mode for making smaller increment changes. Push the knob again to exit Fine mode.
- Zoom opens the Zoom mode. Push Zoom again to close zoom mode.
- Zoom knob (center knob) increases or decreases the area of the zoom box in the Zoom Waveform Overview, which in turn controls the zoom amount of the waveforms shown in the main Zoom view.
- Pan knob (outer knob) moves the Zoom box left or right in the Zoom Waveform Overview, which in turn controls the part of the waveform shown in the main Zoom view.
-
Navigate (left and right arrow) buttons puts the oscilloscope in Zoom mode and positions the previous or next search point in the waveform record to the center graticule of the Waveform view. There must be a Search badge present in the Results bar before the Navigate function will operate. Press and hold a front panel navigate button to continue moving to the next search point in that direction.
The front panel Navigate buttons can also be used for the Previous and Next button functions on measurement badges.
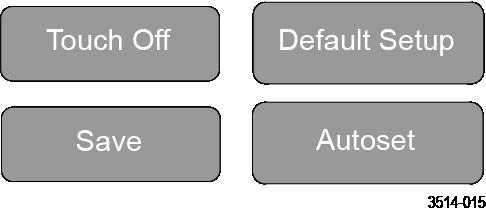
- Miscellaneous controls:
- Touch Off turns touch screen capability off. The Touch Off button is lighted when the touch screen is turned off.
-
Save is a one-push save operation that uses the current File > Save As settings to save screen shots (including open menus and dialog boxes), waveform files, instrument settings, and so on.
- If a File > Save or File > Save As operation has occurred since the last instrument startup, pushing Save saves the file types to the location last set in the Save As configuration menu.
- If no file save operation has occurred since the last instrument startup, pushing Save opens the Save As configuration menu. Select a tab to select the type of file to save (Screen Capture, Waveform, and so on), set any associated parameters, and where to save it, and select OK. The specified file or files are saved. The next time you push Save, the same type files are saved.
- Screen Captures capture the entire screen, including most displayed configuration menus and dialog boxes.
- Default Setup restores the oscilloscope settings (horizontal, vertical, scale, position, and so on) to the factory default settings.
- Autoset automatically displays a stable waveform.
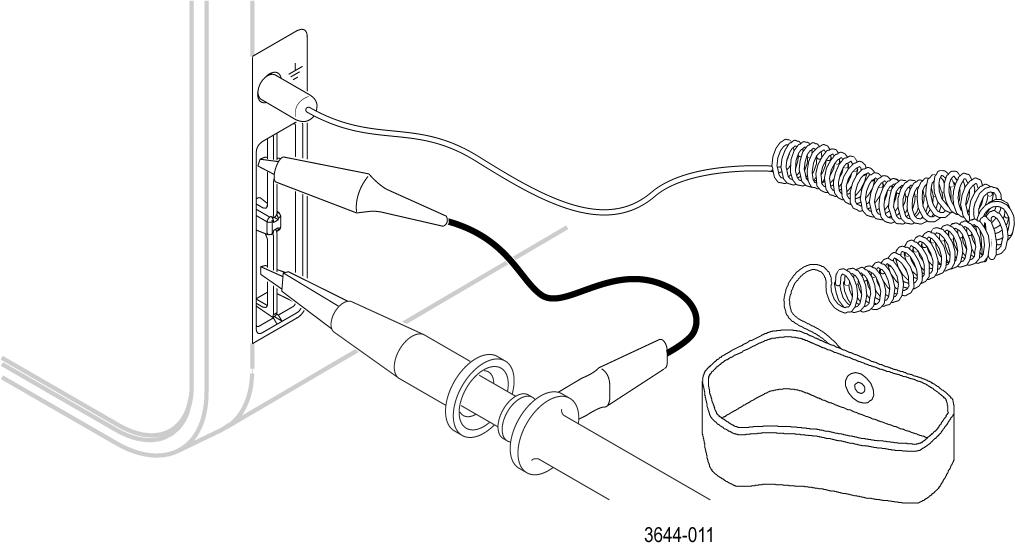
- Ground and Probe Compensation connectors: The Ground and Probe Compensation connectors are located at the lower right side of the instrument, near the front panel. The Ground connector (the small hole in the case) provides an electrically grounded (through a resistor) connection point to attach an anti-static wrist strap, to reduce electrostatic damage (ESD) while you handle or probe the DUT.
The Probe Compensation connections provide a ground connector (upper tab) and 1 kHz square wave source (lower tab) for adjusting the high-frequency response of a passive probe (probe compensation). The oscilloscope uses this signal to automatically compensate supported probes, including the ones that ship with the product.
- USB Host ports (USB 3.0 and 2.0): USB ports are located at the lower right corner of the front panel, and on the rear panel. Connect USB flash drives to which you can save or recall data (such as instrument software updates, waveforms, settings, and screen captures), or connect peripheral devices such as a mouse or keyboard.
- FlexChannel probe connectors: FlexChannel connectors support all TekVPI+ and TekVPI measurement probes, BNC passive probes, the TPL058 FlexChannel Logic Probe, and BNC cables. You connect most probes simply by pushing them into the connector until the probe seats with a click.
- Aux In auxiliary trigger input connector. A connector to which you can connect an external trigger input signal. Use the Aux In trigger signal with the Edge trigger mode.
Rear panel connections
The rear panel connections supply power to the instrument and provide connectors for network, USB devices, video, reference signals, and the AFG output.
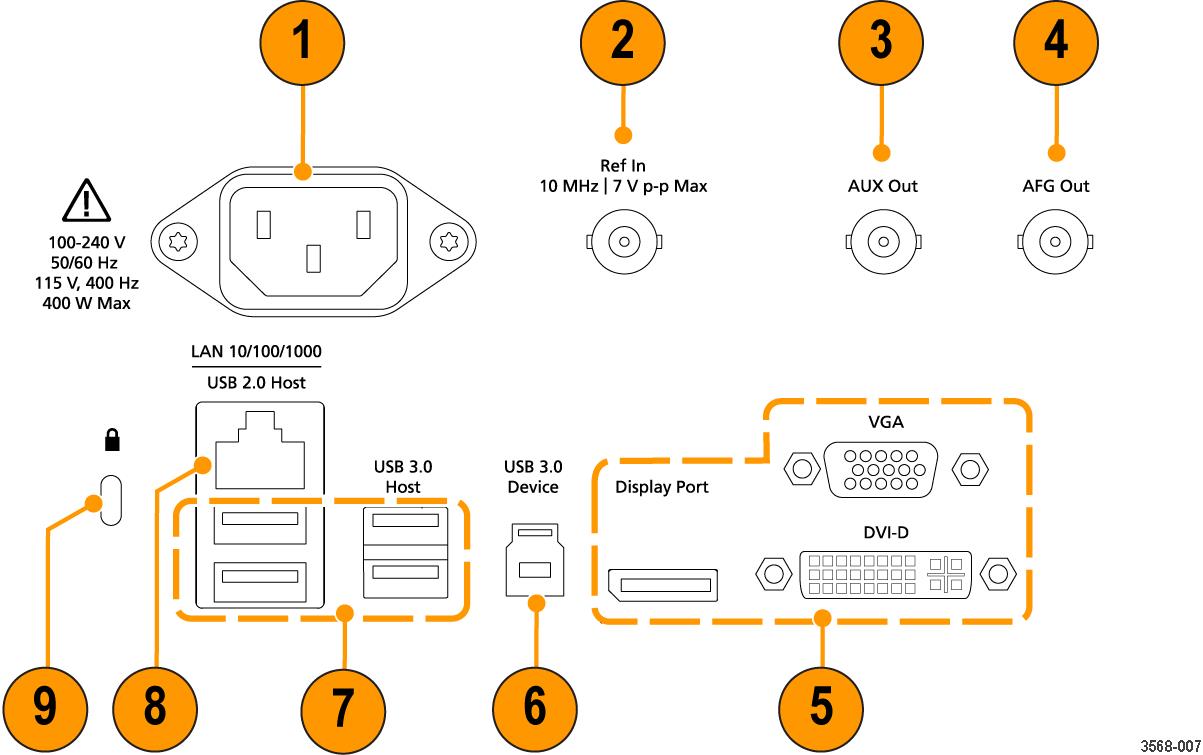
- Power cord connector. Use only the power cord specified for this product and certified for the country of use.
- Ref In lets you connect a high-precision 10 MHz reference signal to the oscilloscope for more accurate measurements.
- AUX Out generates a signal transition on a trigger event, outputs a 10 MHz reference signal, or outputs a synchronization signal from the AFG.
- AFG Out is the signal output for the optional Arbitrary Function Generator (AFG) feature.
- Video outputs (Display Port, VGA, and DVI-D) let you connect an external monitor or projector to show the instrument's graphical user interface.
- USB 3.0 Device port lets you connect to a PC to remotely control the instrument using USBTMC protocol.
- USB Host ports let you connect a USB memory device, keyboard, or mouse.
- LAN connector (RJ-45) connects the instrument to a 10/100/1000 Base-T local area network.
- Security lock connector lets you use a standard PC/laptop lock cable to secure the instrument to a work bench or other location.
User interface
The touch screen user interface contains waveforms and plots, measurement readouts, and touch-based controls to access all oscilloscope functions.
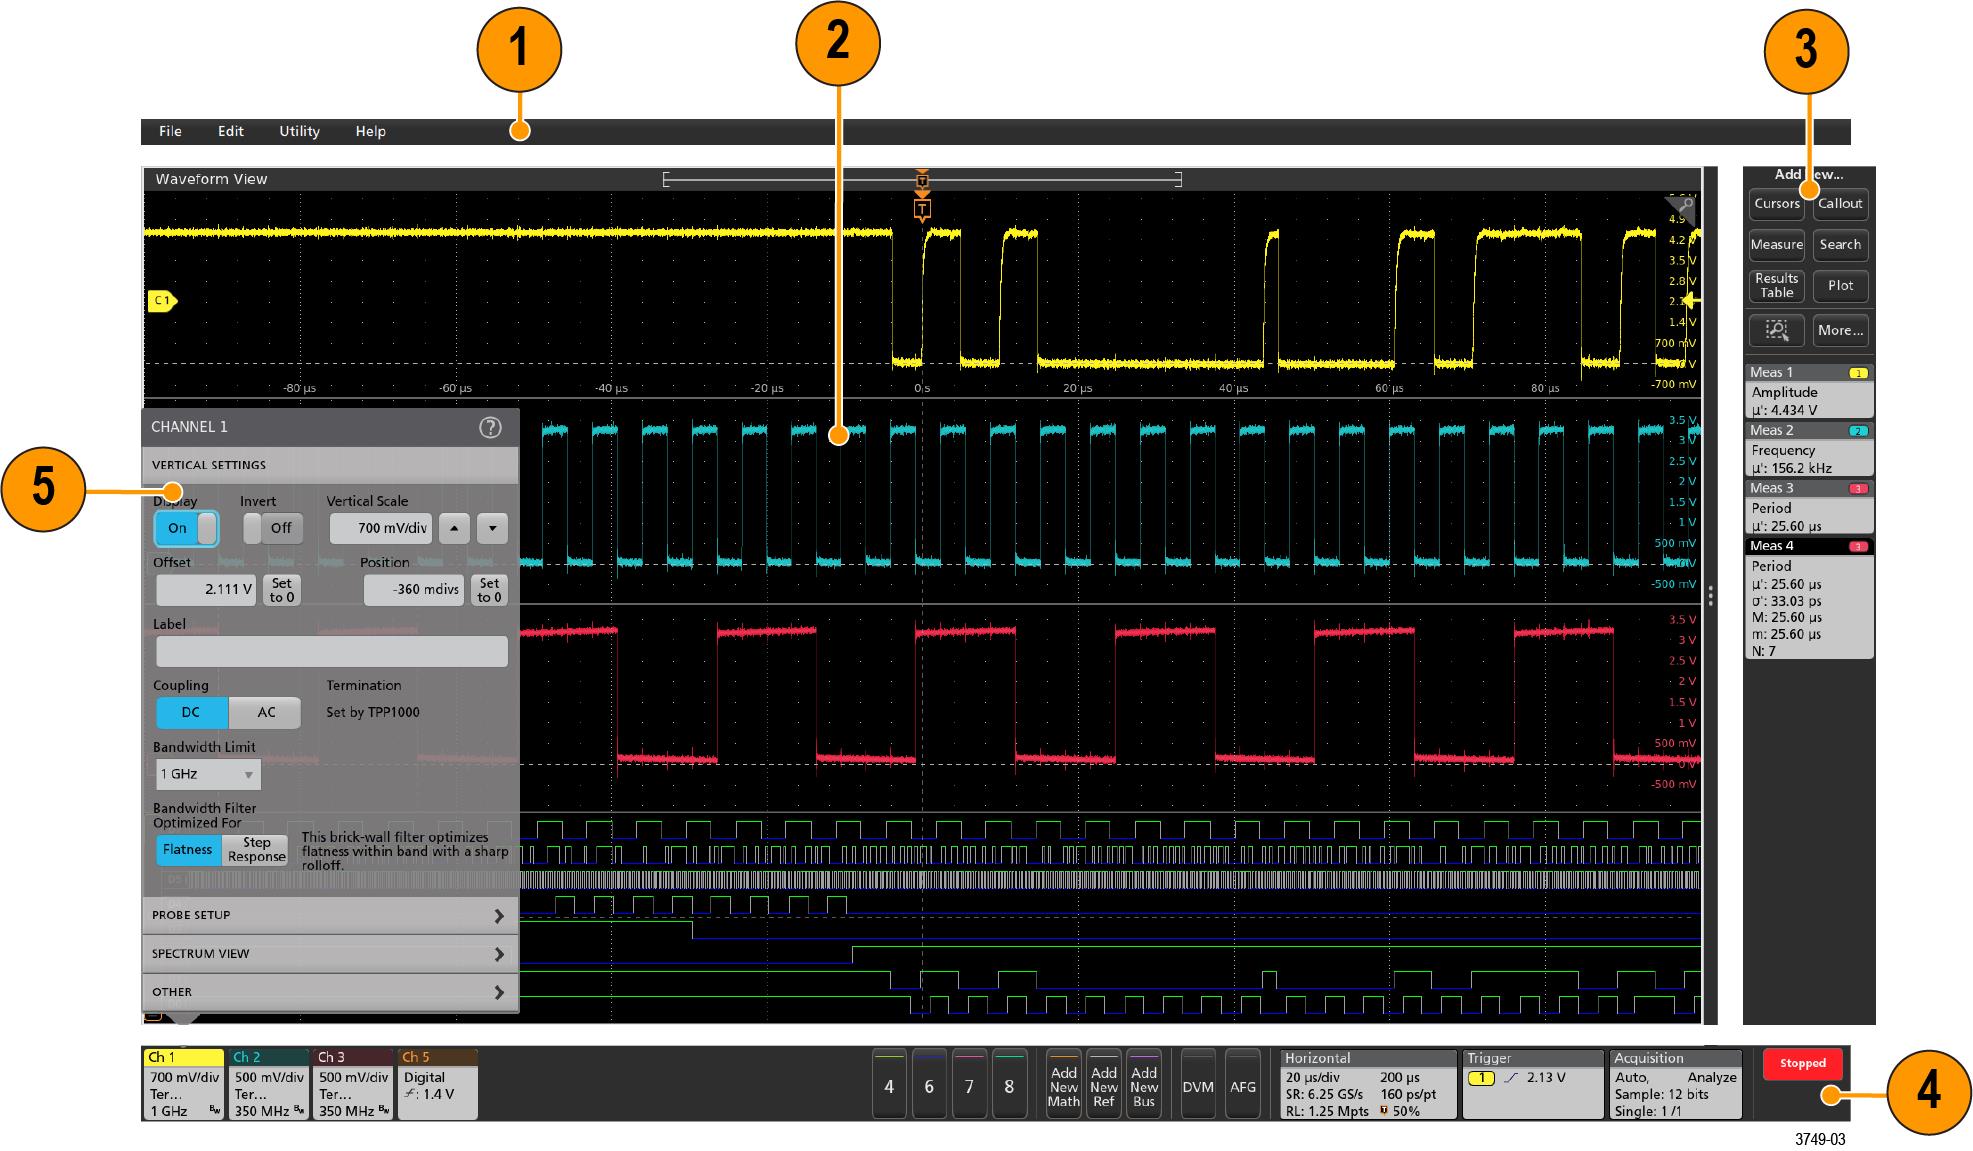
- The Menu bar provides menus for typical operations including:
- Saving, loading, and accessing files
- Undoing or redoing an action
- Setting oscilloscope display and measurement preferences
- Configuring network access
- Running self tests
- Erasing measurement and settings memory (TekSecure™)
- Loading option licenses
- Opening a Help viewer
- The Waveform View area displays analog, digital, math, reference, bus, and trend waveforms. The waveforms include waveform handles (identifiers), individual vertical graticule scale labels, and trigger position and level(s) indicators. You can set the Waveform View to stack each waveform vertically in separate graticules, called 'slices' (the default mode, as shown in the previous image), or overlay all the waveforms on the screen (traditional waveform view). See User interface elements.
You can also add Histogram, Spectral, Eye, and Measurement Results views (plots) for individual measurements. These plot views are separate view windows that you can move on the screen by dragging their title bar to a new position.
- The Results Bar contains controls for displaying cursors, adding callout, plots, and result tables to the screen, and add measurements to the Results bar. To remove a measurement, search or other badge from the Results Bar simply flick it off screen. The controls are:
- The Cursors button displays on-screen cursors in the selected view. Touch and drag, or use the Multipurpose knobs, to move the cursors. Double-tap on a cursor, or on the cursor readouts, to open a configuration menu to set cursor types and related functions.
- The Measure button opens a configuration menu from which to select and add measurements to the Results bar. Each measurement you add has a separate badge. Double-tap a measurement badge to open its configuration menu.
- The Results Table button adds a Measurement or Bus Results table to the screen. The Measurement Results table displays all measurements present in the Results bar. The Bus Results table displays bus decode information for displayed bus waveforms. Each table is contained within its own view window, which can be moved within the display area.
- To remove a measurement, search or other badge from the Results Bar simply flick it off screen.
- The Callout button adds a Callout object to the selected view. Double-tap the Callout text to open a configuration menu to change the type of callout, text and font characteristics. Drag any callout other than bookmark to any location on the oscilloscope screen view. Bookmarks callout can only be added to waveviews and spectrum views.
- The Search button lets you detect and mark a waveform where specified events occur. Tap Search to open a Search configuration menu and set the search conditions for analog and digital channels. You can add any number of searches to the same waveform or to different waveforms. Search badges are added to the Results Bar.
- The Plot button adds an XY, XYZ, or Eye Diagram plot to the display. These plots are contained within their own window and can be moved within the overall display area.
- The Measurement and Search badges show measurement and search results, and are displayed in the Results Bar. See Badges. See Add a measurement. See Add a Search.
- The Zoom icon button at the up right of the Results Bar lets you to draw a box on the screen to zoom in on an area of interest, drawing segments for mask testing, or drawing areas to define visual trigger conditions.
- The More... button at the up right of the Results Bar allows you to select Zoom, Visual trigger, Mask, or Waveform Histogram.
- The Settings Bar contains System badges for setting Horizontal, Trigger, Acquisition, and Date/Time parameters; Inactive Channel buttons to turn on channels; Add New Waveform buttons to add math, reference, and bus waveforms to the display; and Channel and Waveform badges that let you configure the individual waveform parameters. Tap a channel or waveform button to add it to the screen and display a badge. Double-tap a badge to open its configuration menu. See Badges.
- Configuration Menus let you quickly change the parameters of the selected user interface item. You can open configuration menus by double-tapping on badges, screen objects, or screen areas. See Configuration menus.
User interface elements
Each area of the user interface has a specific function that helps manage information or controls. This topic shows and describes the key user interface elements.
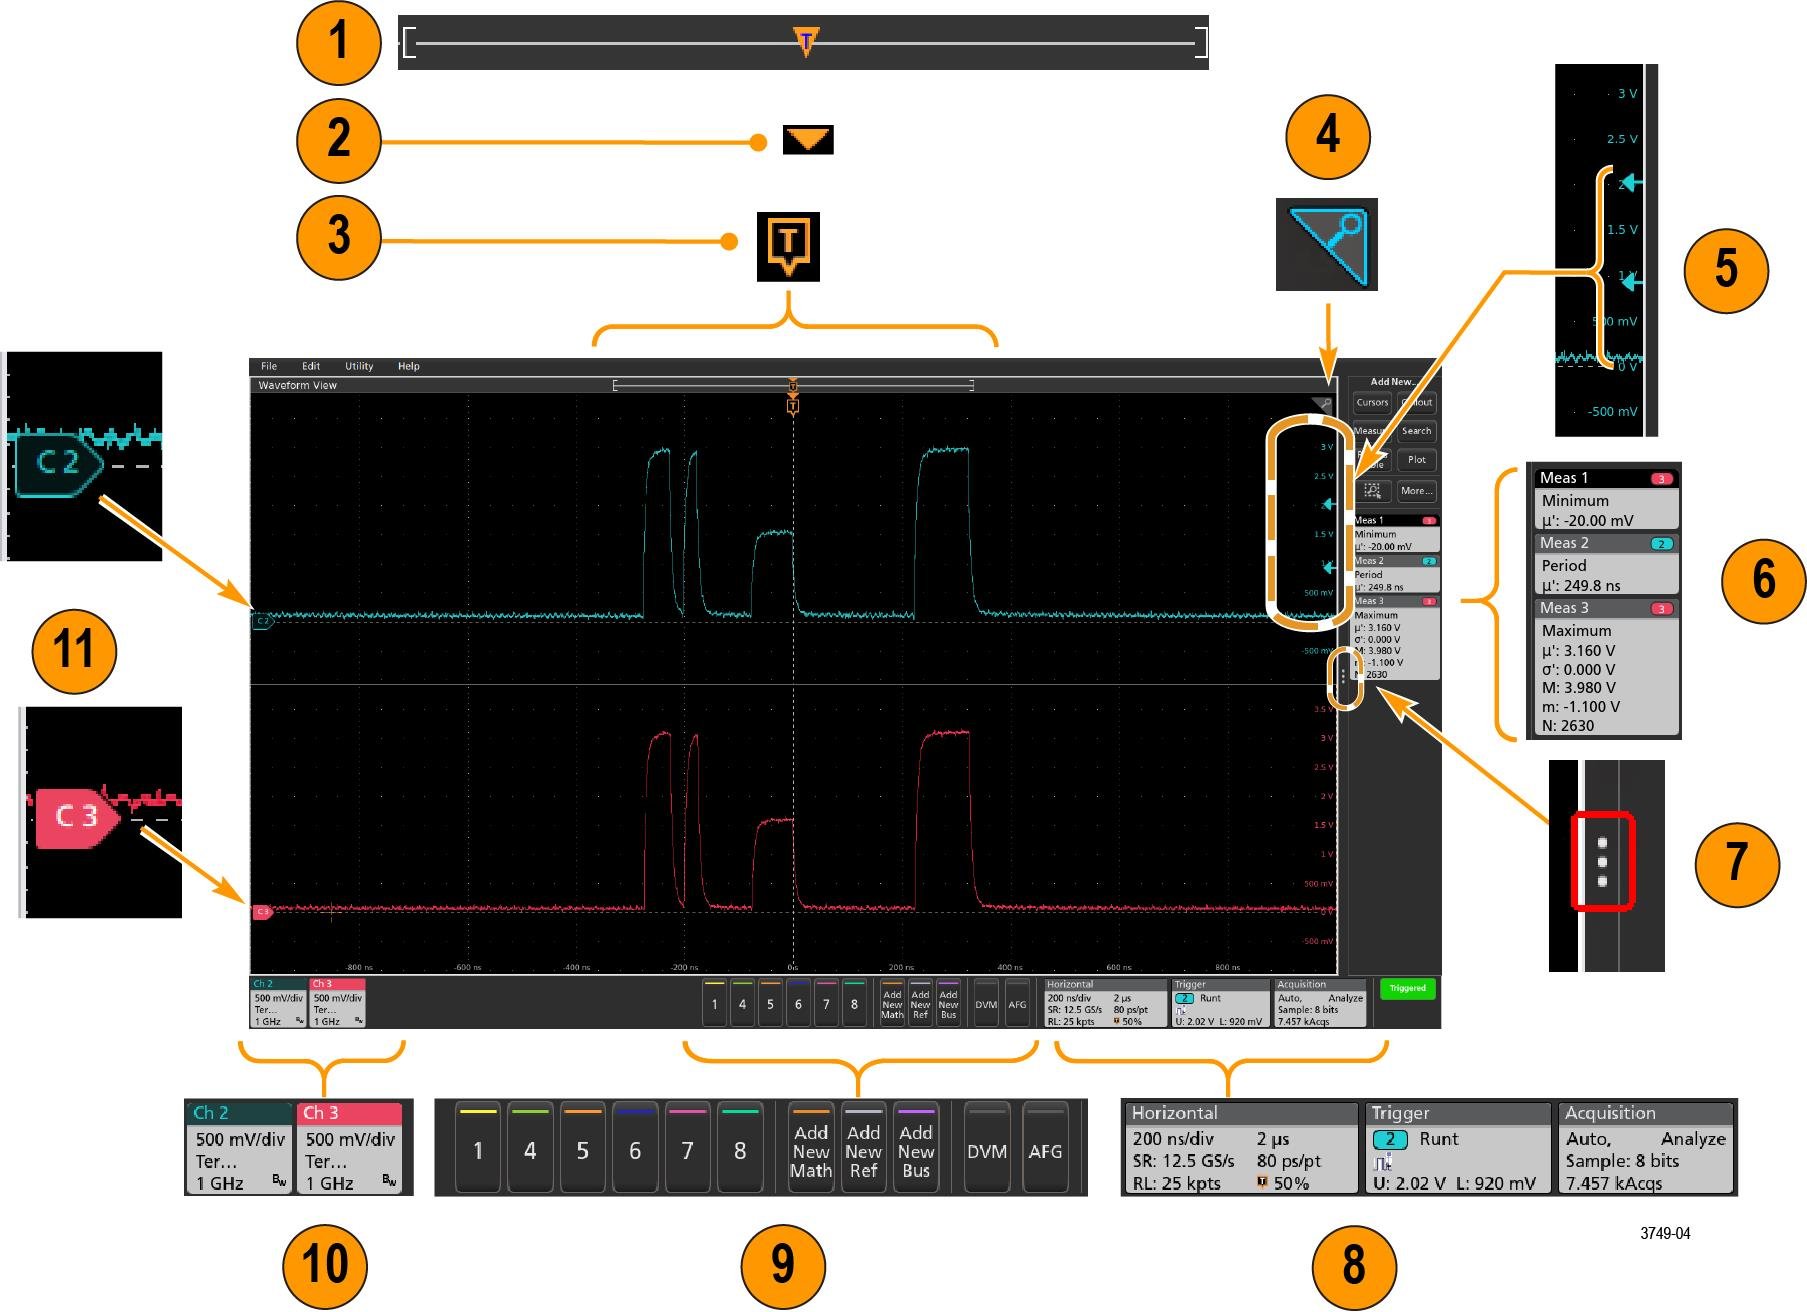
- The Waveform Record View is a graphical high-level view of the overall waveform record length, how much of the record is on the screen (shown in brackets), the location of key time events including the trigger event, and the current position of waveforms cursors.
If you are displaying a Reference waveform that is shorter than the current acquisition record length, or you are changing the horizontal time scale while the oscilloscope acquisition is stopped, the brackets change position to show the part of the waveform record that is being viewed relative to the current acquisition total record length.
If cursors are active on a waveform, the Waveform Record View shows the relative cursor positions as small vertical dashed lines.
When in Zoom mode, the Waveform Record View is replaced with the Zoom Overview. See Zoom user interface.
- The Expansion Point icon on the waveform view shows the center point around which the waveform expands and compresses when changing horizontal settings.
- The Trigger Position Indicator shows where the trigger event occurred in the waveform record. The trigger icon is displayed in the waveform slice that is the trigger source.
- The Zoom icon (in upper right corner of Waveform and Plot views) toggles zoom on and off. The front panel Zoom button and knobs also turn on zoom mode and change the position and horizontal size of the Zoom Box.
- The Trigger Level Indicator icon(s) shows the trigger level on the trigger source waveform. Some trigger types require two trigger levels.
- Measurement and Search badges show measurement and search results. See Badges. See Add a measurement.
- The Results Bar Handle opens or closes the Results bar, to maximize waveform screen viewing when needed. To reopen the Results bar, either tap the handle icon or swipe left from the right side of the display.
- The System badges show global instrument settings (Horizontal, Trigger, Acquisition, Run/Stop status, and Date/Time). See Badges.
- The Inactive Channel buttons add channel waveforms to the Waveform view and add an associated Channel badge to the Settings bar.
The Add New Math, Add New Ref, and Add New Bus buttons add the corresponding signal to the Waveform view, and add an associated Waveform badge to the Settings bar. You can add any number of Math, Reference, and Bus waveforms, limited only by system memory.
The optional AFG button opens the AFG configuration menu to set and enable the AFG output. This button is only present if the AFG option is installed.
The optional DVM button lets you use an analog probe to take DC, AC RMS, or DC+AC RMS voltage measurements on your DUT. Tap the button to add a DVM badge to the Results Bar and open a configuration menu. The DVM option also enables a trigger frequency counter, accessible from the Mode & Holdoff panel in the Trigger badge menu. This button is only present if the DVM option is installed.
- Double-tap a badge to open its associated configuration menu. See Badges. See Configuration menus.
If you add more Channel or Waveform badges than can fit in the waveform badge display area, tap the scroll buttons at each end of the waveform badge area to scroll and display hidden badges.
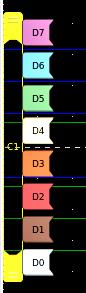
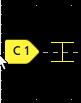
- The Waveform Handles on each waveform identify the source of that waveform (Cx for channels, Mx for Math waveforms, Rx for Reference waveforms, Bx for bus waveforms). The waveform handles are at the zero-volt level of the waveform by default. The currently selected waveform handle is a solid color; unselected waveform handles are outlined.
Double-tapping a waveform handle opens the configuration menu for that waveform.
For digital channels, the waveform handle shows the channel number, each individual digital signal labeled D0–D7 and displayed with a different color.
Double-tapping a digital waveform handle opens the digital channel configuration menu.
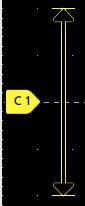
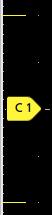
Dragging a digital signal handle over another handle swaps those two signals on the waveform.The probe Dynamic Range Limit Markers are displayed just within the left-hand graticule edge, based at the channel vertical trace handle position and extending up and down to the dynamic range limits of the probe. The markers are only displayed if compatible probes are used. Signals must be within the probe dynamic range for the oscilloscope to correctly display and measure the signals.
The markers are displayed, for about three seconds, after any Offset, Position, or Scale control change that leaves the channel dynamic range limits within the acquisition window. After about three seconds the markers become short lines at the left edge of the graticule. If the dynamic range is too small to display the arrows, the arrows are omitted. Examples of all three marker versions are shown.


Badges
Badges are rectangular icons that show waveform, measurement, and instrument settings or readouts. Badges also provide fast access to configuration menus. The badge types are Channel, Waveform, Measurement, Search, and System.
Channel and Waveform badges
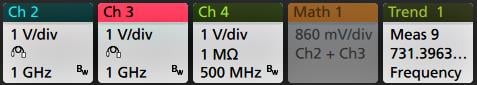
Most Channel and Waveform badges also have Scale buttons, shown by single-tapping the badge. Use the Scale buttons to increase or decrease the vertical scale setting for that waveform.
You can drag Channel and Waveform badges to change their position in the Settings bar and open the badge right-click menu to access a quick-action menu.
- Right-click the badge and turn it off.
- Flick the badge off the bottom edge of the display to remove it from the Settings bar. Flicking upwards from the bottom edge of the Settings bar recovers the badge. Badge recovery is only possible within 10 seconds of removal.
Channel badges are listed in the channel order unless you have moved them. Channel badges may also display short error or warning messages. For more information double-tap the badge to open its configuration menu, or search the instrument Help.
Waveform badges (Math, Ref, Bus, Trend) are listed in the order created (unless they have been moved), and are grouped together by type. Deleting a Waveform badge does not change the order or names of the remaining badges.
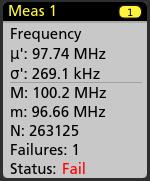
Measurement badges
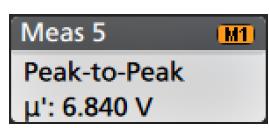
Double-tap a Measurement badge to open its configuration menu to change or refine settings. The default measurement badge readout shows the measurement's mean (μ) value.
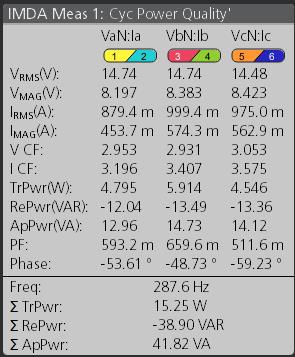
Wide Badge: Wide badge displays all the phases results in a separate column. All sub-measurements are listed in the results badge in the first column. The common result such as Frequency is applicable to all the (3) phases and displayed as single value. The configured sources for each phase are displayed in channel colors. The Wide Badge applies to IMDA measurements only.
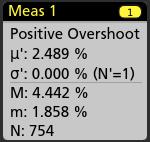
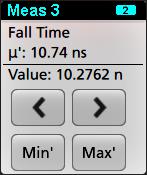
The < (Previous) and > (Next) buttons center the waveform in the display at the position of the previous or next measurement point in the record (for measurements that take more than one measurement per acquisition).
The Min' and Max' navigation buttons center the waveform in the display at the minimum or maximum value for that measurement in the current acquisition.
The prime symbol (') shown on measurement readings and Min/Max buttons indicates that the value shown (or moved to in the case of Min/Max buttons and waveforms) is from the current acquisition. Lack of a prime symbol means the value is from all acquisitions.
Measurement badges are listed in the order created, starting at the top of the Results bar. Deleting a Measurement badge does not change the order or names of the remaining badges.
You can drag Measurement badges to change their position in the Results bar and open the badge right-click menu to access a quick-action menu.
- Right-click the badge and turn it off.
- Flick the badge off the right edge of the display to remove it from the Results bar. Flicking left from the right edge of the Results bar recovers the badge. Badge recovery is only possible within 10 seconds of removal.
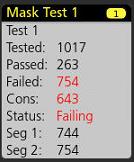
Mask Test badge
| Badge readout | Description |
|---|---|
| Label (optional readout) | A label defined in the badge configuration menu. |
| Tested | The total number of waveforms tested against the mask. |
| Passed | The number of waveforms that contained no samples that violated the mask. |
| Failed | The number of waveforms that contained one or more samples that violated the mask. Displays in red if greater than or equal to the total failures threshold. |
| Cons | The highest number of consecutively failed waveforms in the test run. Displays in red if greater than or equal to the consecutive failures threshold. |
| Status | The status of the mask test. It can be On, Off, Passed/Passing (green) or Failed/Failing (red). |
| Seg n (optional readout) | The number of waveforms that contained one or more samples that violated mask segment n. |
Double-tap a Mask Test badge to open its configuration menu to change or refine settings.
You can drag the badge to change its position in the Results bar and open the badge right-click menu to access a quick-action menu.
- Right-click the badge and turn it off.
- Flick the badge off the right edge of the display to remove it from the Results bar. Flicking left from the right edge of the Results bar recovers the badge. Badge recovery is only possible within 10 seconds of removal.
Waveform Histogram badges
The Waveform Histogram badges are located in the Results bar. The badge title shows the histogram source.
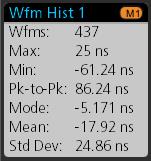
The histogram badge displays the measurements which are checked in the Result Badge menu.
You can drag the badge to change its position in the Results bar and open the badge right-click menu to access a quick-action menu.
There are two ways to delete Waveform Histogram badges.
- Right-click the badge and select Delete Histogram.
- Flick the badge off the right edge of the display to remove it from the Results bar. Flicking left from the right edge of the Results bar recovers the badge. Badge recovery is only possible within 10 seconds of removal.
Cursor Badges
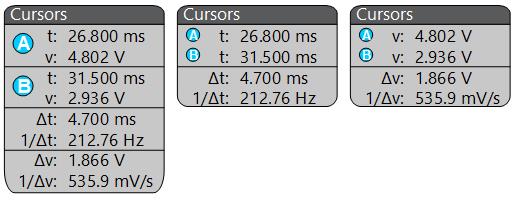
To create a cursor readouts badge, turn on Cursors, double-tap a cursor readout to open its configuration menu, and set the Readouts mode to Badge.
| Note:You can only view cursor readouts in one location at a time; either on the waveform or in a Cursors badge. You cannot move cursor readouts to a badge for Spectrum View cursors. |
You can drag the badge to change its position in the Results bar and open the badge right-click menu to access a quick-action menu.
- Right-click the badge and turn it off.
- Flick the badge off the right edge of the display to remove it from the Results bar. Flicking left from the right edge of the Results bar recovers the badge. Badge recovery is only possible within 10 seconds of removal.
Search badges
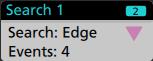
Search badges are created by tapping the button. Use the displayed configuration menu to set the search criteria.

Some searches also provide Min and Max navigation buttons that open the Zoom mode and center the waveform in the display at the minimum or maximum value for that search event in the current acquisition.
Search badges are listed in the order created. Deleting a Search badge does not change the order or names of the remaining badges.
You can drag Search badges to change their position in the Results bar and open the badge right-click menu to access a quick-action menu.
- Right-click the badge and turn it off.
- Flick the badge off the right edge of the display to remove it from the Results bar. Flicking left from the right edge of the Results bar recovers the badge. Badge recovery is only possible within 10 seconds of removal.
Deleting mass Measurements/Searches badges at once
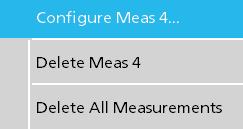
- Select and right click on the Measurement/Search badge in the Results bar, which displays the dialog box as shown:
Controls Description Configure Measurement/Search Configure Measurement or Search badges Delete Measurement/Search Deletes the selected Measurement (standard, power, etc.)/Search badge in the Results bar. Delete All Measurement/Search Deletes all the Measurement (standard, power, etc.)/Search badges in the Results bar. - When Delete All Measurements is selected, the oscilloscope asks for the confirmation to delete all the measurements/search at a time.
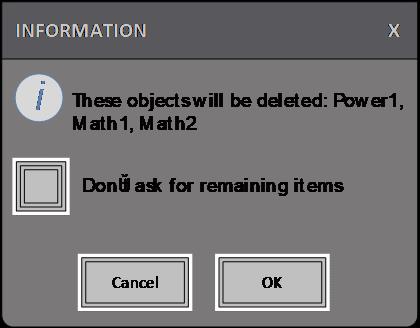
- The dialog box provides you a checkbox that gives the choice to bypass remaining information dialogs.
- Don’t ask for remaining items: Default is unchecked. If you leave it unchecked and clear the information dialog, then the dialog will appear again for the next measurement deletion.
- If the box is checked, it proceeds with deleting the rest of the items without bringing up the dialog box again. The dialog box appears for each set of measurements you want to delete.
Signal Clipping and Badges
| WARNING:Clipping is caused by excessive or dangerous voltage at the probe tip, and/or a vertical scale setting that is not adequate to display the entire vertical range of the waveform. Excessive voltage at the probe tip can injure the operator and cause damage to the probe and/or instrument. |
This instrument shows a warning triangle symbol and the words Clipping in a Channel badge when a vertical clipping condition exists. Any measurement badges associated with that channel also indicate a clipping condition by turning the measurement text red and listing the type of clipping (positive or negative).
To close the clipping message, change the vertical scale to show the entire waveform, disconnect the probe tip from the excessive voltage source, and check that you are probing the correct signal using the correct probe.
Clipping causes inaccurate amplitude-related measurement results. Clipping also causes inaccurate amplitude values in saved waveform files. If a math waveform is clipped, it will not affect amplitude measurements on that math waveform.
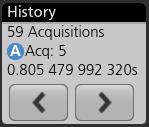
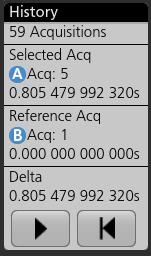
History badge
The History badge is shown in the Results bar. Navigate the history acquisitions by using the Previous/Next or Play/Pause buttons.
Timestamp shows the time difference between the previous acquisition and the selected acquisition.
| Badge readout | Function | Description |
|---|---|---|
 | Previous | The previous button takes you to the previous acquisition. |
 | Next | The next button takes you to the next acquisition. |
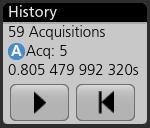
  | Play/Pause | Acquisitions are played at the specified playback speed and begin from the currently selected acquisition. The Play button changes to a Pause button when playback is active. Acquisitions are played until playback reaches the end of the history. At this point, playback stops, and the Play button is grayed out. |
 | Rewind | The Rewind button takes you back to the acquisitions where you pressed the Play button. |
 | Reset | The Reset button takes you back to the first acquisition in the history. When you are at the beginning of the history the button is grayed out. |
The waveforms can be viewed in the graticule for the selected acquisitions from history badge. You can navigate the total number of acquisitions in history. Double-tap a badge to open its configuration menu.
When Include Reference Acquisition in Badge is selected from the right click menu of the History badge, the badge displays the following information:
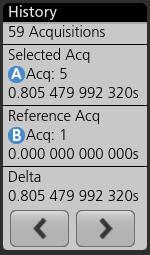
The Reference acquisition readout shows the timestamp when the acquisition occurred in time in history. It also displays the delta between the Selected acquisition and the Reference acquisition timestamps.
- Right-click the badge and select Disable Acquisition History.
- Flick the badge off the right edge of the display to remove it from the Results bar. Flicking left from the right edge of the Results bar recovers the badge. Badge recovery is only possible within 10 seconds of removal.
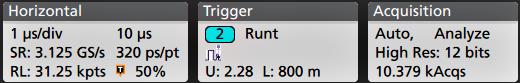
System badges
System badges (in the settings bar) display the main Horizontal and Trigger settings. You cannot delete System badges.
Double-tap a System badge to open its configuration menu.
The Horizontal badge also has Scale buttons, shown by single-tapping the badge. Use the Horizontal Scale buttons to increase or decrease the horizontal time setting.
Common badge actions
| Action | Result | Example |
|---|---|---|
| Single tap | Immediate access controls (Scale, Navigation). | |
| Double tap | Configuration menu with access to all settings for the badge. |
 |
| Touch and hold | Right-click menu with single tap access to common actions. Typical actions include turning off a channel and deleting a measurement or search badge. | |
| Flick | Flick the badge off the bottom edge of the display to remove it from the Settings bar. Flick the badge off the right edge of the display to remove it from the Results bar. Flick from the right or bottom edge to recover a removed badge. This action is only possible within 10 seconds of badge removal. | |
Badge selection status
The appearance of a badge indicates its selection status (selected or unselected), or if a measurement needs to be deleted to close a channel or waveform badge.| Badge type | Selected | Unselected | Turned off or in use |
|---|---|---|---|
| Channel or Waveform |  | ||
| Measurement | | 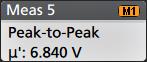 | N/A |
A dimmed Channel badge means the screen waveform is turned off (but not deleted). A dimmed Waveform badge means that the waveform display is turned off, or it is being used as a source by a measurement and cannot be deleted until the measurement is deleted.
Configuration menus
Configuration menus let you quickly set the parameters for channels, system settings (Horizontal, Trigger), measurements, cursor readouts, Waveform and Plot views, callout text, and so on.
Selections or values that you enter take effect immediately. Menu contents are dynamic, and can change depending on your selections, instrument options, or attached probes.
Tap anywhere outside a configuration menu to close it.
To open Help content for a configuration menu, tap the question mark icon in the upper right corner of the menu.
Zoom user interface
Use the zoom tools to magnify waveforms to view signal details.
- The Zoom Overview shows the entire waveform record. All waveforms are shown in Overlay mode in the Zoom Overview area. Using pinch and expand gestures on the Zoom Overview waveforms changes the horizontal time base settings.
- The Zoom Box shows the area of the Zoom Overview to display in the Zoom View (see 5). You can touch and drag the box to move the area to view. Moving the Zoom Box, or changing its position, does not change the horizontal time base settings.
- The Zoom icon (in the upper right corner of the Waveform View) switches zoom mode on and off.
A zoom box lets you quickly draw a box around an area of interest in the Waveform or Zoom Overview. Drawing a box immediately puts the oscilloscope into zoom mode. To draw a zoom box, tap the DRAW-A-BOX button (while in Zoom mode), then touch and drag on the waveform to draw a box waveform. You can continue to draw zoom boxes until you single tap anywhere on the screen or open a menu.
To toggle between Zoom mode and Mask mode, double-tap the DRAW-A-BOX button and select one of the options. Search for the Mask Testing topics in the oscilloscope Help for more information.
- The Zoom View shows the zoomed waveforms, as marked by the Zoom Box, in the Zoom Waveform Record View. Use pinch and/or drag options in the zoom view to change the zoomed area of interest. Pinch, expand, and drag gestures in the Zoom View only change zoom magnification settings and Zoom Box position.
- Use the Zoom Title Bar controls to adjust the vertical and horizontal size of the zoom area. Click or tap the + or - buttons or use the A and B multipurpose knobs.
In a waveform view, if both Cursor and Zoom are turned on, use the Zoom Box and Cursors button to change the multipurpose knob functionality. Tap the Zoom Title Bar to assign the knobs to adjust the zoom or tap the Cursors button to assign knobs to adjust the cursors.
Double tap the Horizontal Zoom Position or Horizontal Zoom Scale fields to enter a value using a numerical keypad.
To exit the zoom display mode, tap the Zoom icon in the corner of display or tap the X in the Zoom Title Bar.

Using the touch screen interface for common tasks
Use standard touch screen actions, similar to those found on smart phones and tablets, to interact with most screen objects. You can also use a mouse to interact with the UI. The equivalent mouse operation is shown for each touch operation.
The oscilloscope has a user interface tutorial. Tap Help > User Interface Tutorial to quickly learn the fundamental touch operations.
| Task | Touchscreen UI action | Mouse action |
|---|---|---|
| Add a channel, math, reference, or bus waveform to the screen. | Tap an inactive channel button, Add New Math, Add New Reference, or Add New Bus button. | Click an inactive channel button, Add New Math, Add New Reference, or Add New Bus button. |
| Select a channel, math, reference, or bus waveform to make it active | Stacked or Overlay mode: Tap the Channel or Waveform badge. | Stacked or Overlay mode: Left-click the Channel or Waveform badge. |
| Stacked mode: Tap the channel, math, reference, or bus waveform slice or handle. | Stacked mode: Left-click the channel, math, reference, or bus waveform slice or handle. | |
| Overlay mode: Tap the channel or waveform handle. | Overlay mode: Left-click the channel or waveform handle. | |
| Display scale or navigation buttons on a badge (waveform, measurement, search, horizontal). Not all measurement or search badges display navigation buttons. | Tap the badge. | Click the badge. |
| Open a configuration menu on any item (all badges, views, cursor readouts, labels, and so on). | Double-tap the badge, view, or other object. | Double-click the badge, view, or other object. |
| Open a right-click menu (badges, views). | Touch and hold on the badge, Waveform View, Plot view, or other screen item until a menu opens. | Right-click the object. |
| Close a configuration menu. Some dialog boxes will not close until you click an OK, Close, or other button in the dialog. | Tap anywhere outside the menu or dialog. | Click anywhere outside the menu or dialog. |
| Move a menu. | Touch and hold the menu title bar or a blank area in the menu, then drag the menu to new position. | Click and hold the right mouse button on title or blank area, drag to new position. |
| Move a callout. Callouts are screen objects and are not associated with any particular waveform channel or slice. | Touch and hold on a callout and quickly start to drag, then move to new position. Start to move the callout as soon as selected (highlighted), otherwise the UI opens the right-click menu. | Click and hold the right mouse button on the callout and quickly start to drag, then move to the new position. |
| Change horizontal or vertical settings directly on a waveform. Vertical changes only apply to the selected channel or waveform; horizontal changes apply to all channels and waveforms. | Tap a badge and use the Scale buttons. | Left-click a channel, waveform, or Horizontal badge and click on the Scale buttons. |
| Touch and hold two fingertips on the waveform view, move them together or apart vertically or horizontally, lift from screen; repeat. | ||
| Increase or decrease the zoom area while in Zoom mode. | Touch and hold two fingertips on the waveform view, move them together or apart vertically or horizontally, lift from screen; repeat. | Click the + or - buttons on the Zoom Title bar. |
| Click the Draw-a-Box button, draw a box around the waveform area of interest. | ||
| Quickly scroll or pan a waveform or list. | Touch and drag in the waveform or list. | Click and drag in the waveform or list. |
| Close or open the Results Bar to increase the Waveform View area. | Tap on the Results Bar Handle (three vertical dots in border) or anywhere in the border between the Waveform View and the Results Bar. | Click the Results Bar Handle (three vertical dots in border) or anywhere in the border between the Waveform View and the Results Bar. |
| Click and drag the Results Bar divider. | ||
| Change the position of badges in the Settings Bar or Results Bar. | Touch and drag the badge to a new position in the same bar. | Click and drag the badge to a new position in the same bar. |
Configure the instrument
Set the time zone and clock readout format
Set the time zone to your region so that saved files are marked with the correct date and time information. You can also set the time format (12 or 24 hour clock).
Procedure
Download and install the latest instrument firmware
Installing the latest firmware helps ensure that your instrument has the latest features and is taking the most accurate measurements.
Before you begin
Procedure
What to do next
To confirm the firmware update, locate the version number found in the About window under the Help menu. Confirm that the instrument firmware version number matches the firmware version number that you just installed.
Run Signal Path Compensation (SPC)
Run SPC when you first receive an instrument, and at regular intervals, for best measurement accuracy. You should run SPC whenever the ambient (room) temperature has changed by more than 5 °C (9 °F), or once a week if you use vertical scale settings of 5 mV per division or less.
About this task
Signal Path Compensation (SPC) corrects for DC level inaccuracies in the internal signal path, caused by temperature variations and/or long-term signal path drift. Failure to run SPC on a regular basis may result in the instrument not meeting warranted performance levels at low volts per division settings.
Before you begin
Disconnect all probes and cables from the front-panel channel inputs and rear-panel signal connectors.
Procedure
- Tap Run SPC. The SPC Status readout shows Running while SPC is running. SPC can take three minutes approximately per channel to run, so wait until the SPC Status message changes to Pass before reconnecting probes and using the instrument.CAUTION:You can abort the SPC calibration by tapping Abort SPC. This may leave some channels uncompensated, resulting in possible inaccurate measurements. If you do abort the SPC, make sure to run the SPC procedure completely before using the instrument to take measurements.
Compensate the TPP Series probes
Probe compensation adjusts the high frequency response of a probe for best waveform capture and measurement accuracy.
Before you begin
The oscilloscope must be powered on for at least 20 minutes before compensating a probe.
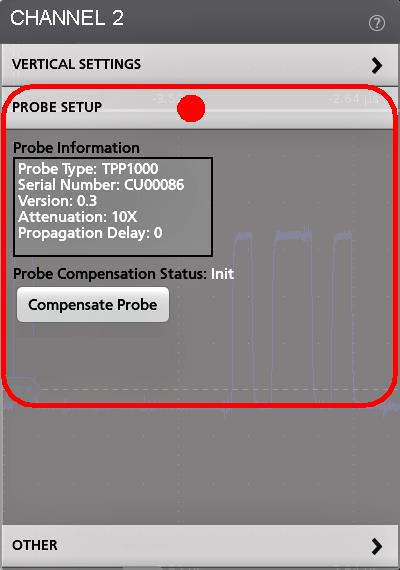
Procedure
Use this procedure to compensate supported TPP-family probes that show a Default status when connected to the oscilloscope.
Connect to a network (LAN)
Connecting to a network allows you to remotely access the instrument.
Work with your network administrator to obtain the required information to connect to your network (IP address, Gateway IP address, Subnet Mask, DNS IP address, and so on).
- Connect a CAT5 cable from the instrument LAN connector to your network.
- Select Utility > I/O on the menu bar to open the I/O configuration menu.
- Obtain or enter the network address information:
- If your network is DHCP-enabled, and the IP address field does not already show an address, tap Auto to obtain the IP address information from the network. DHCP mode is the default mode.
- If your network is not DHCP-enabled, or you need a permanent (non-changing) IP address for this instrument, tap Manual and enter the IP address and other values provided by your IT or system administrator resource.
- Tap Test Connection to verify that the network connection is working. The LAN Status icon turns green when the instrument successfully connects to your network. If you have problems connecting to your network, contact your system administration resource for help.
Operating basics
Add a channel waveform to the display
Use this procedure to add a channel signal to the Waveform View.
- Connect signal(s) to the channel input(s).
- Tap an Inactive Channel button (in the Settings bar) of a connected channel.
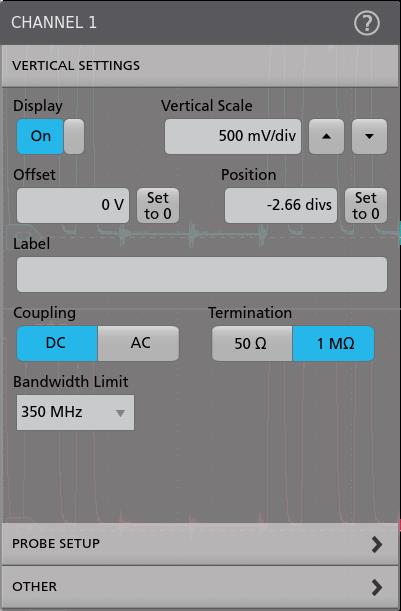
The selected channel is added to the Waveform View and a Channel badge is added to the Settings bar.
- Continue tapping Inactive Channel buttons to add more channels (digital or analog). Channels are displayed from lowest-numbered channel at the top, to highest-numbered channel at the bottom of the view, regardless of the order they were added (in stacked mode).
- Double-tap a channel badge to open that channel's configuration menu to check or change settings.
Configure channel or waveform settings
Use the channel and waveform configuration menus to set parameters such as vertical scale and offset, coupling, bandwidth, probe settings, deskew values, external attenuation values, and other settings.
Before you begin
Procedure
- Double-tap a Channel or Waveform badge to open a configuration menu for that item. For example, in a Channel menu, use the Vertical Settings panel to set basic probe parameters such as vertical scale and position, offset, coupling, termination, and bandwidth limit. Available settings depend on the probe.
- Tap the Probe Setup panel to confirm probe settings and run configuration or compensation on supported probes.
- Tap the Other panel to set probe deskew, external attenuation, and alternate units parameters.
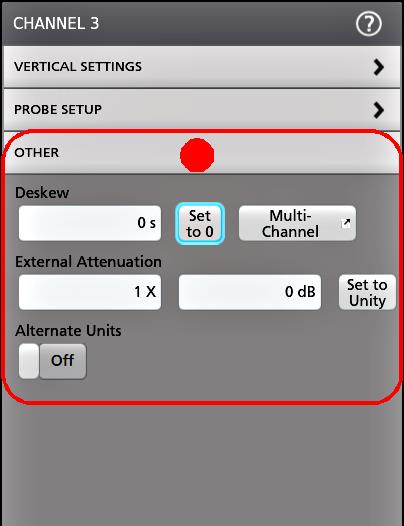
Autoset to quickly display a waveform
The Autoset function analyzes the signal characteristics and changes the instrument Horizontal, Vertical, and Trigger settings to automatically display a triggered waveform. You can then make further changes to trigger and horizontal settings to view the waveform point of interest.
- Connect the probe with the signal of interest to an available channel.
- Double-tap the Trigger badge and set the trigger source to that of the signal of interest.
- Connect any other associated signal(s) to available channel input(s).
- Add the channel waveforms to the Waveform view. See Add a channel waveform to the display.
- Tap File > Autoset or push the front-panel Autoset button. When using the Stacked Display mode, the instrument analyzes the signal characteristics of the trigger source channel (analog or digital) and adjusts the horizontal, vertical, and trigger settings accordingly to display a triggered waveform for that channel. The Vertical scale is adjusted in each waveform slice of all active waveforms to maximize ADC utilization.
When using the Overlay Display mode, the instrument adjusts the horizontal and trigger settings of the trigger source channel to display a triggered waveform for that channel. Vertical scale and position adjustments for all active channels in Overlay Display mode are controlled by the Autoset in Overlay Display Mode Optimizes selection in the Autoset panel of the User Preferences menu. If the selection is Visibility, Autoset vertically scales and positions all active channel waveforms such that they are uniformly spaced on screen. If the selection is Resolution, Autoset vertically scales and positions all active channel waveforms such that they each use as much of the ADC's range as possible.
Note:You can set which parameters the instrument can adjust when running an Autoset. Access the Autoset panel in Utility > User Preferences > Autoset.
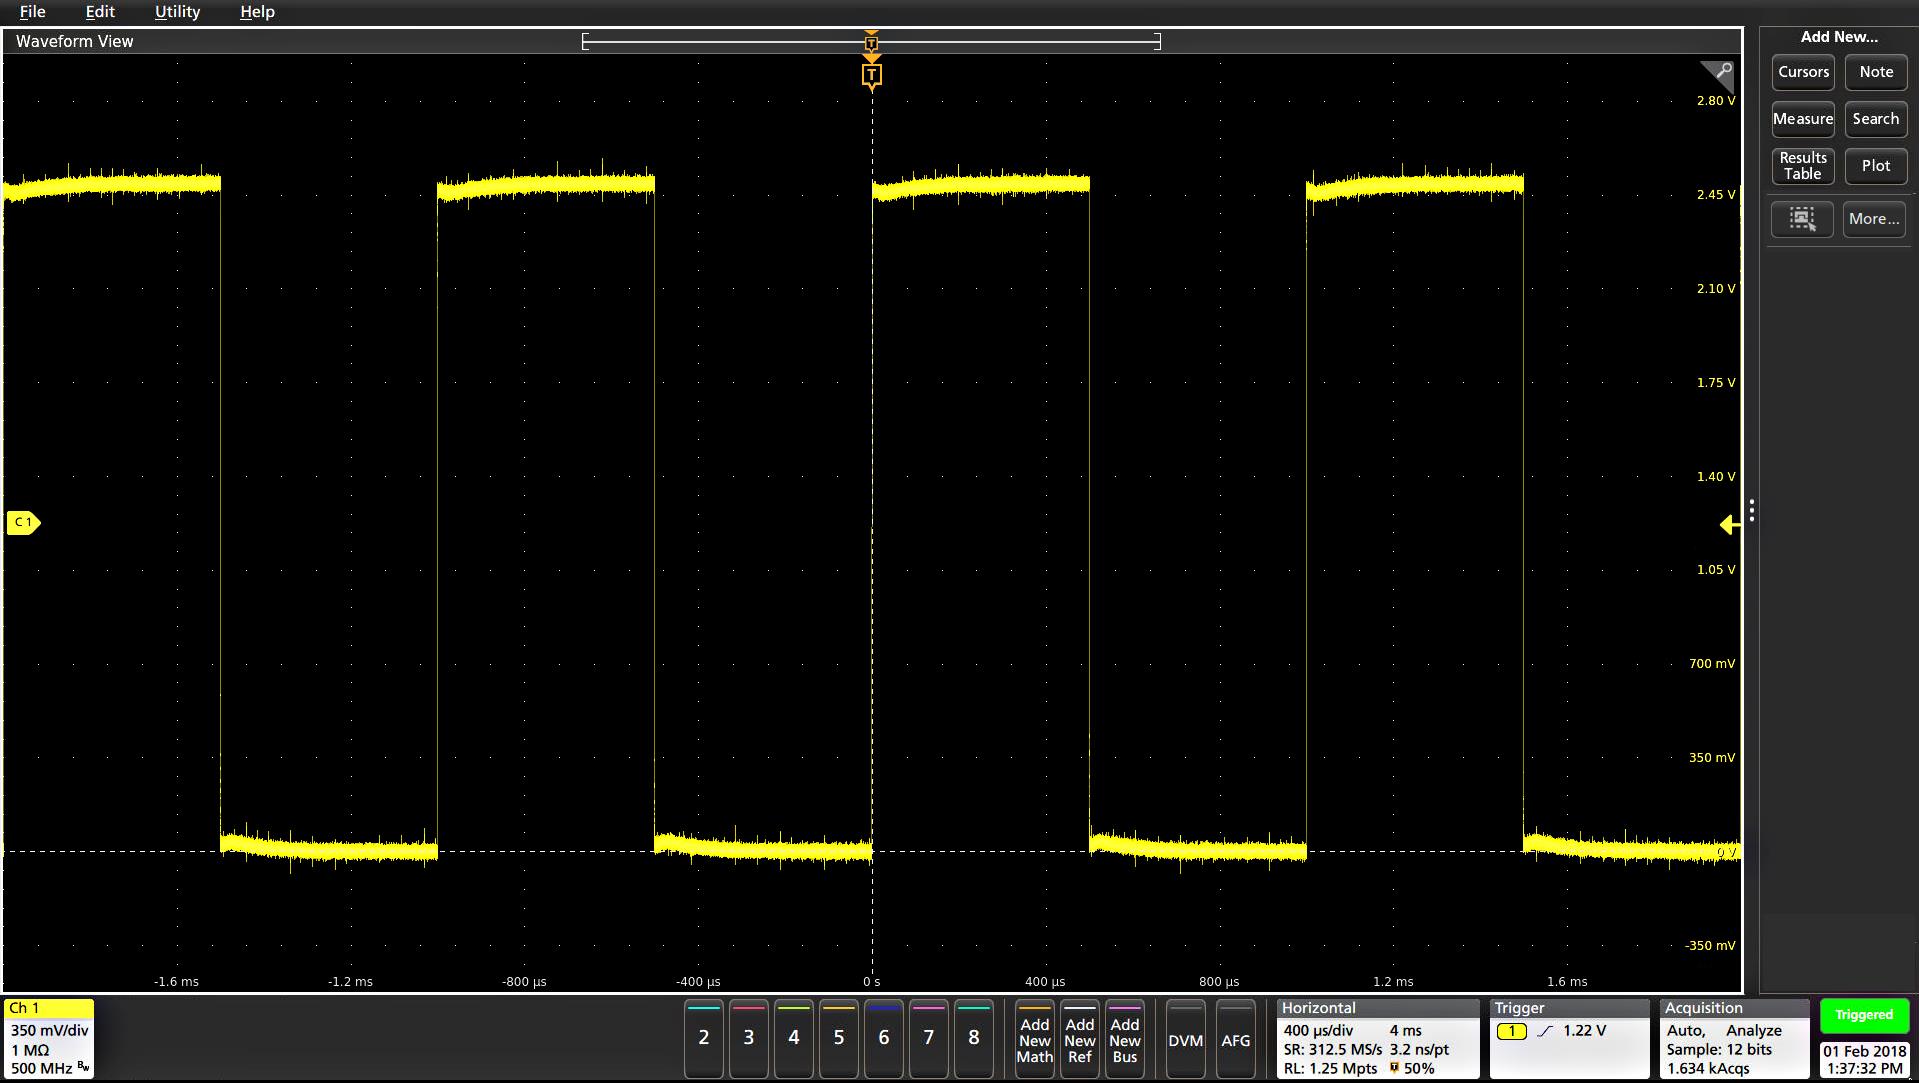
Autoset guidelines
- Autoset displays three or four cycles (depending on the detected signal) with the trigger level near the midlevel of the signal.
- The trigger is set to type Edge, rising slope, DC coupling.
- If no channels are displayed before pushing Autoset, the oscilloscope adds Ch 1 to the Waveform view whether it has a signal or not.
- Autoset ignores math, reference, and bus waveforms.
- A channel or waveform with a frequency less than 40 Hz is classified as no signal.
How to trigger on a signal
Use this procedure to open the Trigger menu to select and configure the trigger event type and conditions.
- Double-tap the Trigger badge on the Settings bar to open the Trigger configuration menu.
- Select a trigger from the Trigger Type list. The trigger type sets what fields are available in the menu and also updates the illustration to show a graphic of the trigger type.
To trigger on a bus, you must first add the bus to the Waveform view. See Add a math, reference, or bus waveform
Note:Triggering on buses other than Parallel requires purchasing and installing serial trigger and analysis options. - Select the other fields and panels to refine the trigger conditions. The menu fields and trigger graphic updates as you make changes to the trigger settings. Displayed fields depend on the selected trigger type. Selection changes take effect immediately.
- Tap the Help icon on the menu title for more information on these settings.
- Tap outside the menu to close the menu.
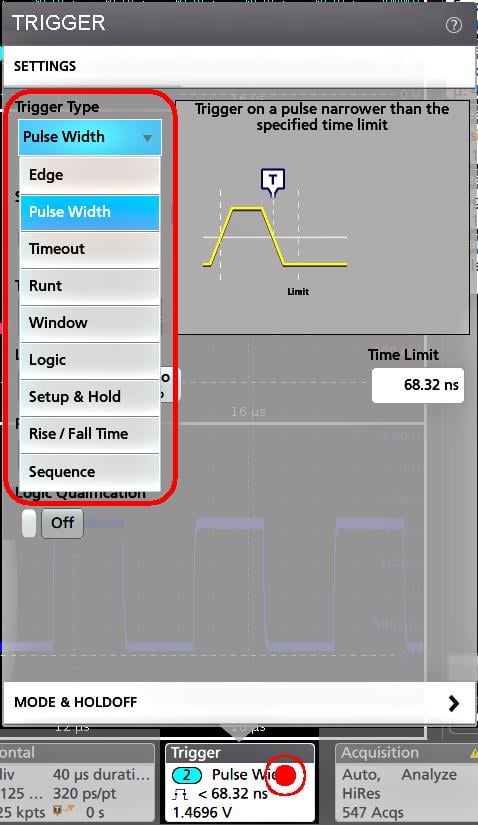
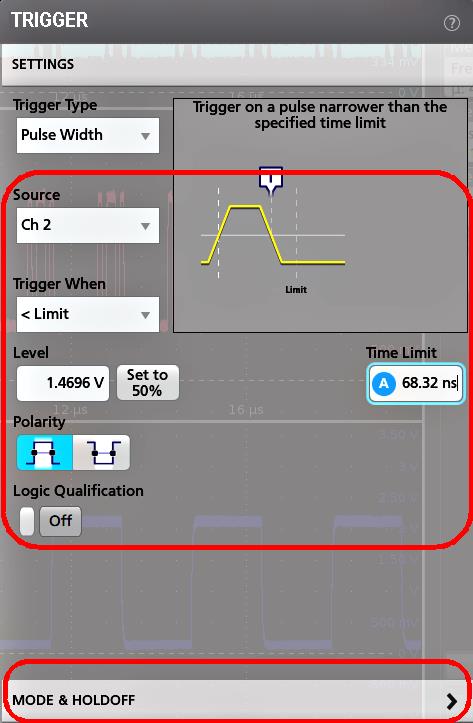
Set the acquisition mode
Use this procedure to set the method the instrument uses to acquire and display the signal.
- Double-tap the Acquisition badge on the Settings bar to open the Acquisition configuration menu.
- Select the acquisition method from the Acquisition Mode list. Set any other parameters associated with the selected acquisition type.
- Tap the Help icon on the menu title for more information on these settings.
- Tap outside the menu to close the menu.
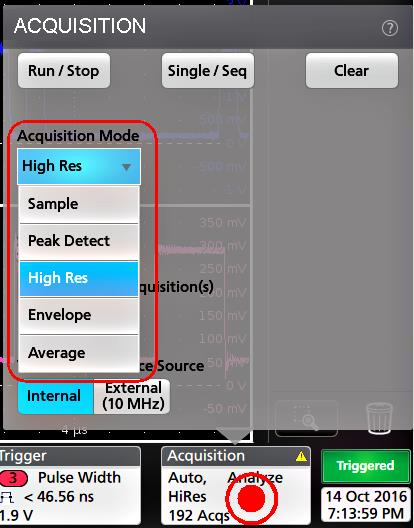
Set Horizontal parameters
Use this procedure to set the horizontal time base parameters such as mode, minimum sample rate, horizontal scale, delay, and trigger delay time (relative to the center of the waveform record.
- Double-tap the Horizontal badge on the Settings bar to open the Horizontal configuration menu.
- Use the menu selections to set horizontal parameters.
- Tap the Help icon on the menu title for more information on these settings.
Add a math, reference, or bus waveform
Math waveforms let you create new waveforms based on operations between two or more waveforms or by applying equations to waveform data. A reference waveform is a static waveform record displayed for comparison. Bus waveforms let you view and analyze serial or parallel data.
- Tap the Add New Math, Add New Ref, or Add New Bus button in the Settings bar.
- The instrument adds the waveform to the Waveform view, adds a Waveform badge to the Settings bar, and opens a configuration menu. This example shows adding a Math waveform.
- Use the configuration menus to refine the waveform parameters. Displayed fields depend on the waveform and selections made in the menu. Selection changes take effect immediately.
This example shows adding a Math waveform, using the Math Source fields to select Ch 1 and Ch 2 as the waveform sources, set the math type to Basic math operation, and subtracting channel 2 from channel 1.
- When adding a Reference waveform, the instrument displays a Recall configuration menu. Navigate to and select the reference waveform file (*.wfm) to recall, then tap the Recall button. The instrument displays the Reference waveform.
- Double-tap a math, reference, or bus badge to check or change the waveform settings.
- Tap the Help icon on a configuration menu title for more information on math, reference, and bus waveform settings.
- Tap outside the menu to close the menu.
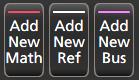
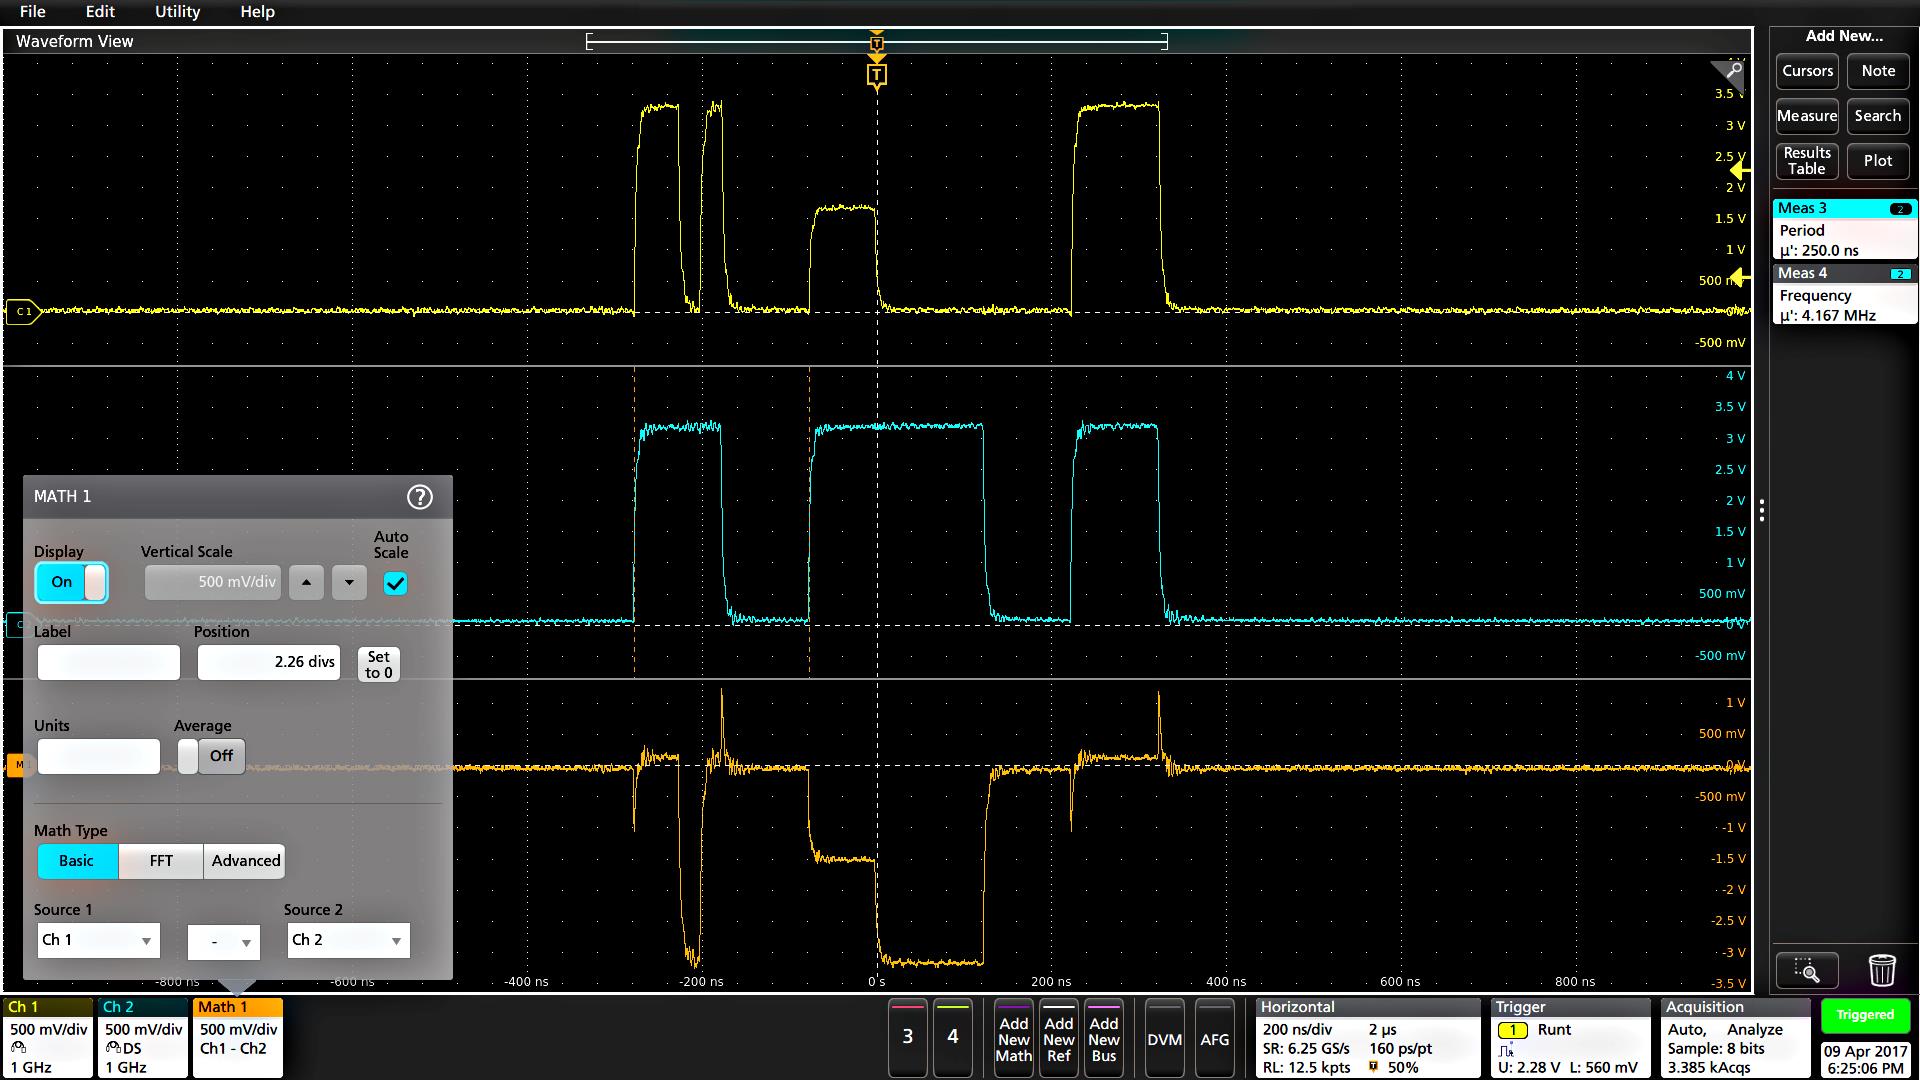
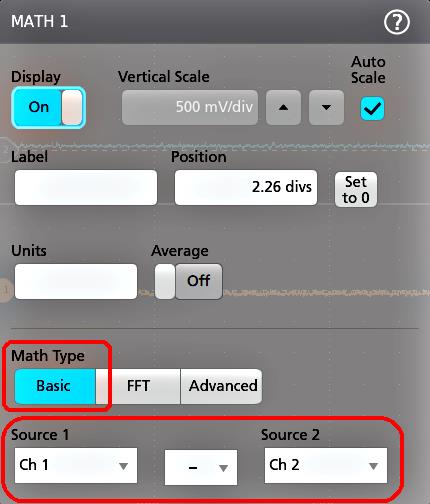
Add a measurement
Use this procedure to select and add measurements.
- Acquire the channel(s) and/or waveform(s) on which you want to take measurements. Note:Waveforms do not need to be displayed to be used for measurements, as long as the channel or waveform badge is on the Settings bar and is acquiring the signal to measure.
- Tap the button to open the Add Measurements configuration menu or drag the Measure button onto a waveform in the waveform display area to automatically set the source. Note:If the menu shows tabs other than Standard, then optional measurement types have been installed on the instrument. Select a tab to show the measurements for that option.
- Tap the Source field and select the measurement source. The list shows all available sources that are valid for the measurement.
- Select a measurement category panel, such as Amplitude Measurements or , to display measurements for those categories.
- Select a measurement and tap Add to add the measurement to the Results bar. You can also double-tap a measurement to add it to the Results bar.
- Select and add other measurements for the current source. Tap the measurement category panels to display and select other measurements to add.
- To add measurements for other sources, select a different source, select a measurement, and add the measurement.
- Tap outside the Add Measurements menu to close the menu.
- To further adjust a measurement's settings, double-tap a measurement badge to open a configuration menu for that measurement. See Configure a measurement.
- Tap the Help icon on the menu title for more information on settings.
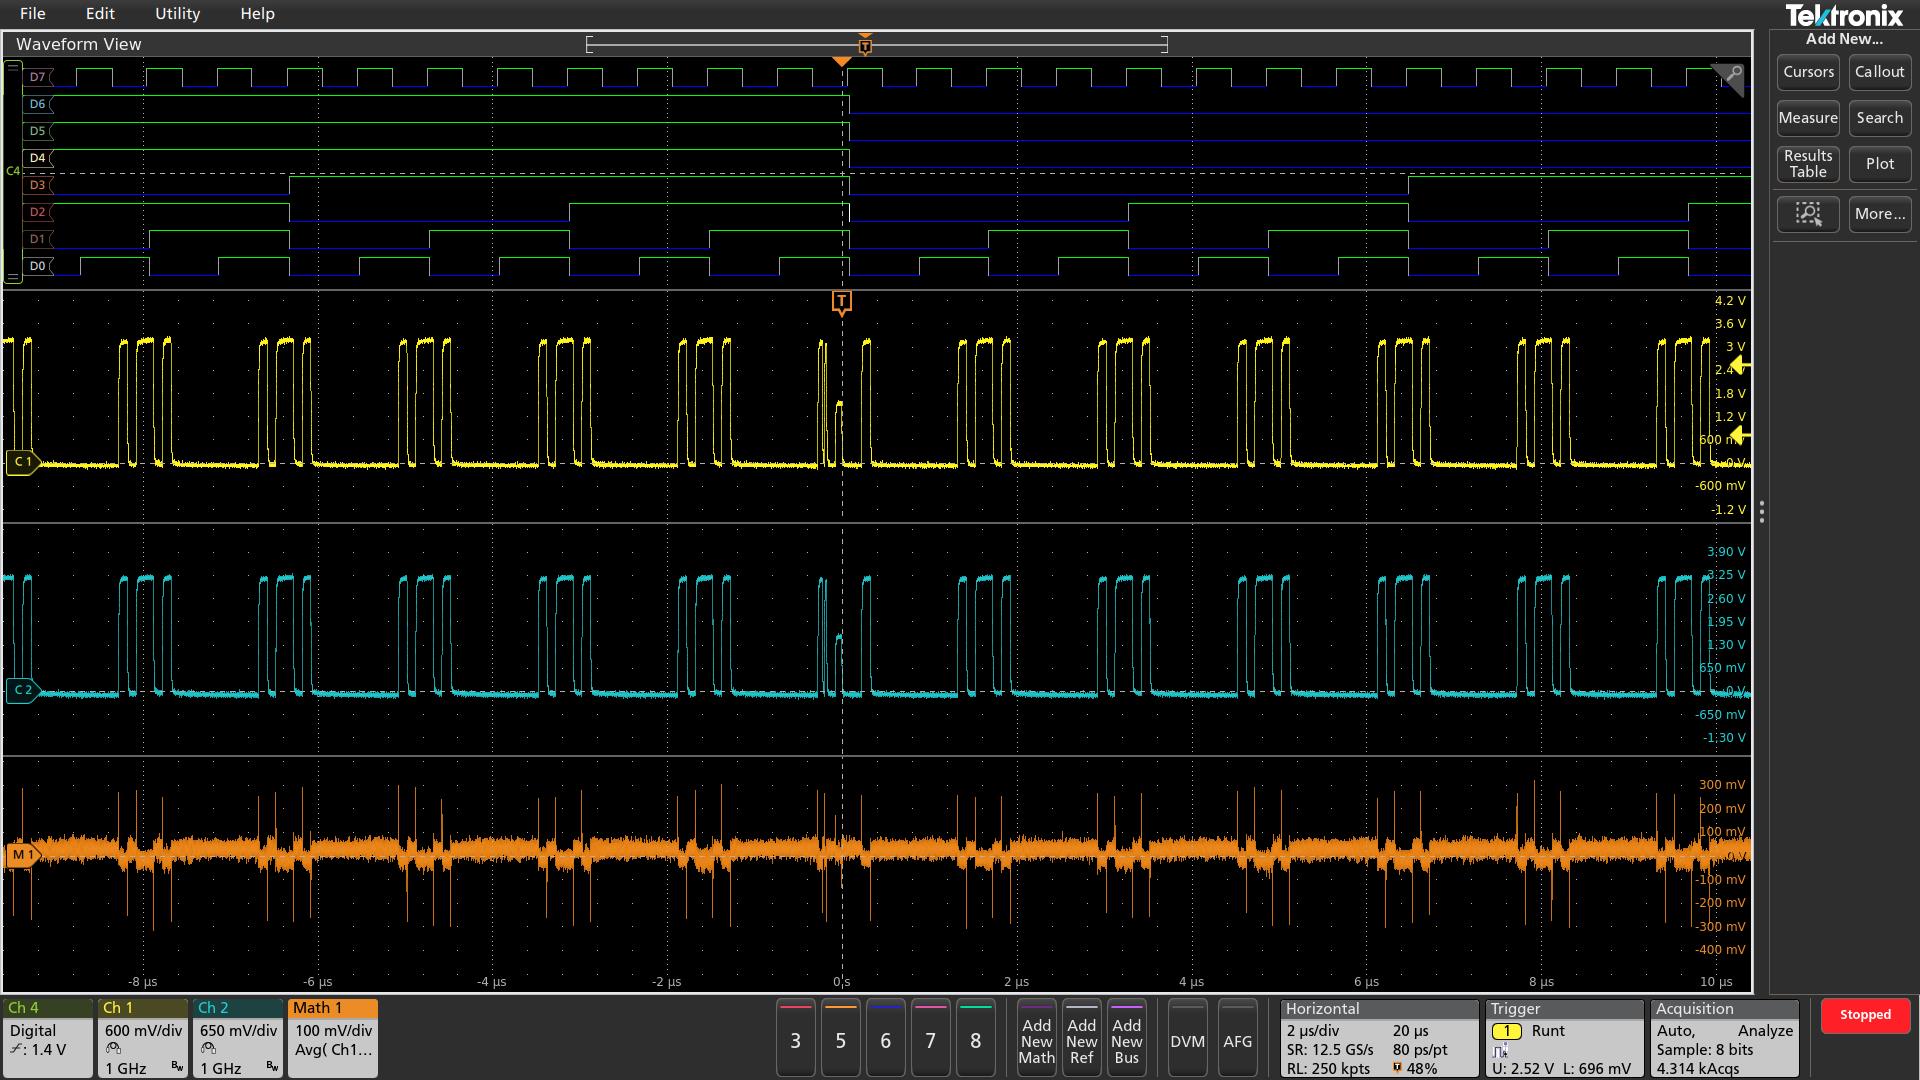
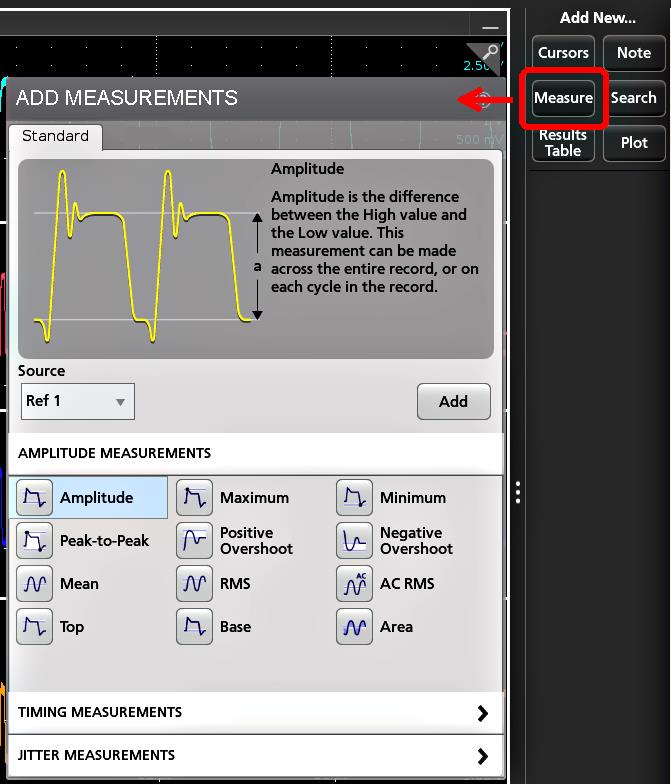
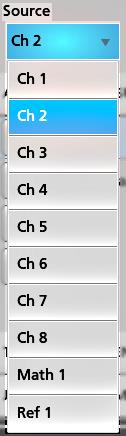
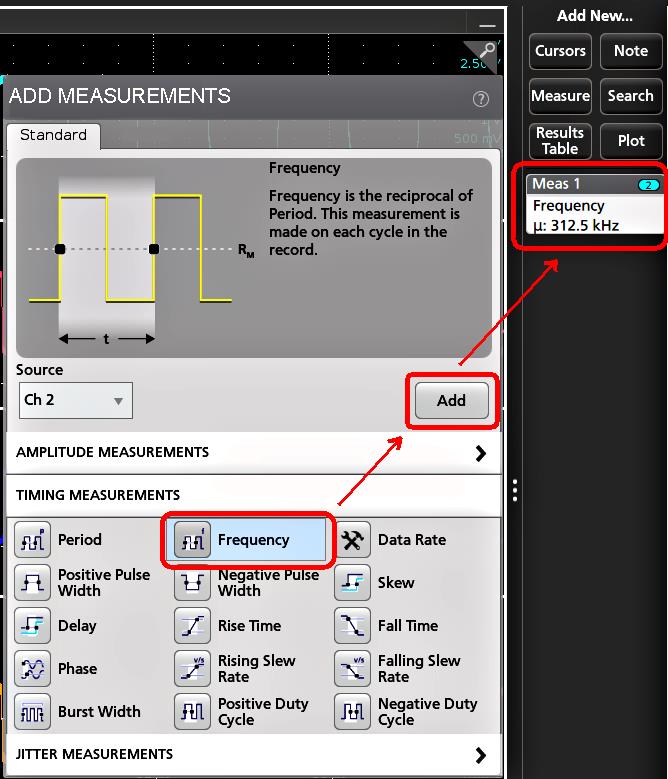
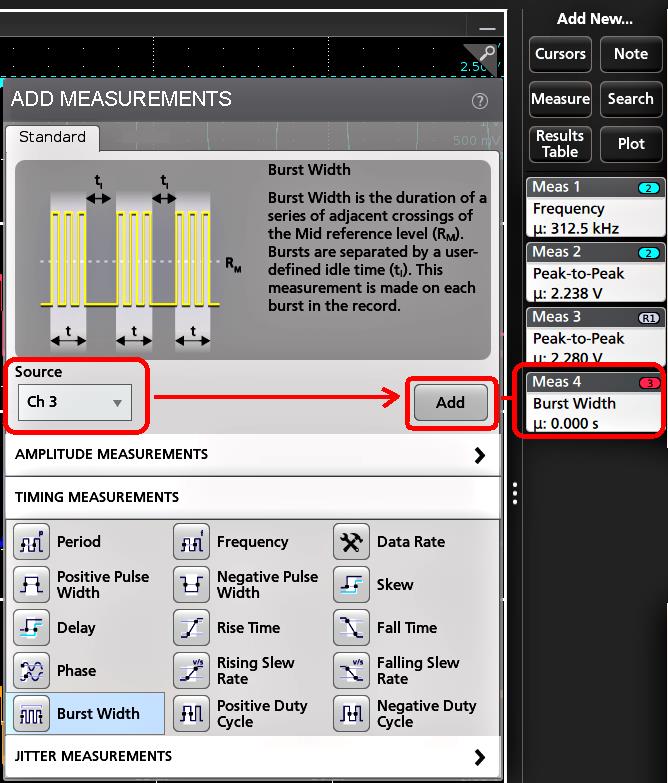
Configure a measurement
Use this procedure to add statistical readouts to the measurement badge, display plots for the measurement, and refine measurement parameters (configuration, global versus local scope of settings, gating, filtering, and so on).
- Double-tap a measurement badge to open its Measurement configuration menu.
- Tap Show Statistics in Badge to add statistical readouts to the measurement badge.
- Tap available panel titles to make changes for those categories.
- Use the available fields to refine the measurement conditions. Displayed fields depend on the measurement. Selection changes take effect immediately. Selection changes can also change fields in other panels.
- Tap the Help button on the menu title for more information on this menu's settings.
- Tap outside the menu to close the menu.
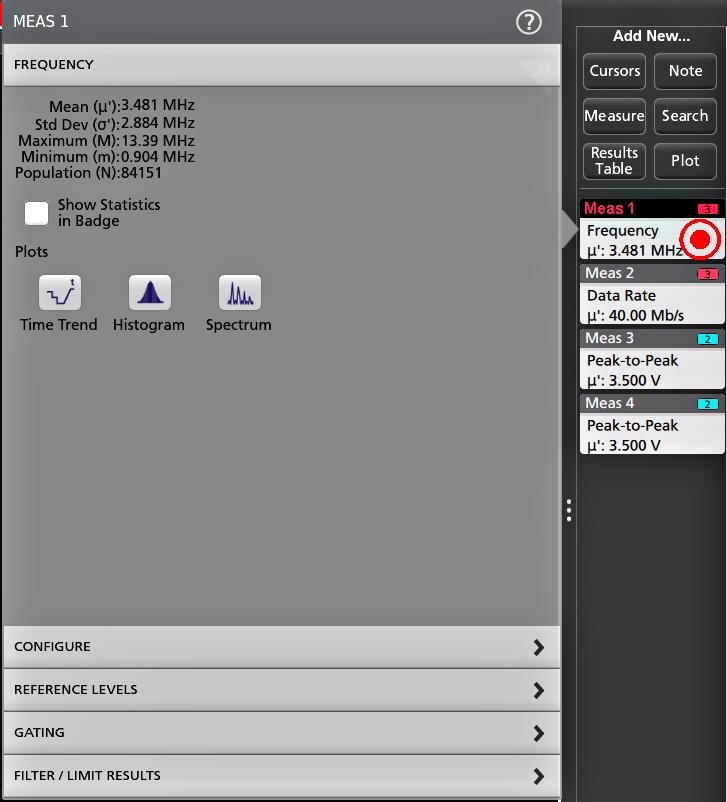
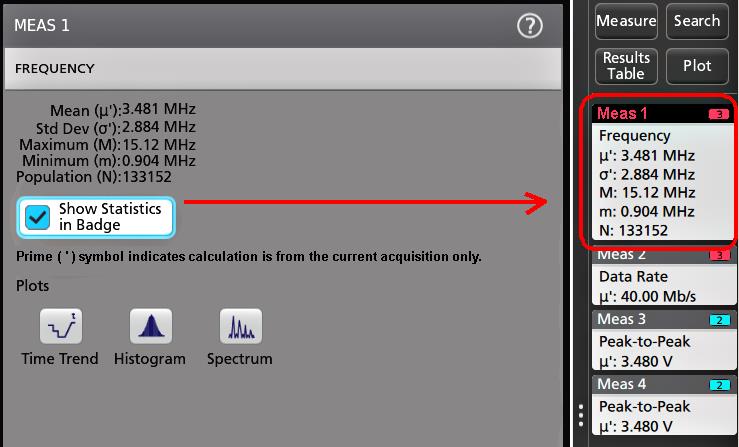
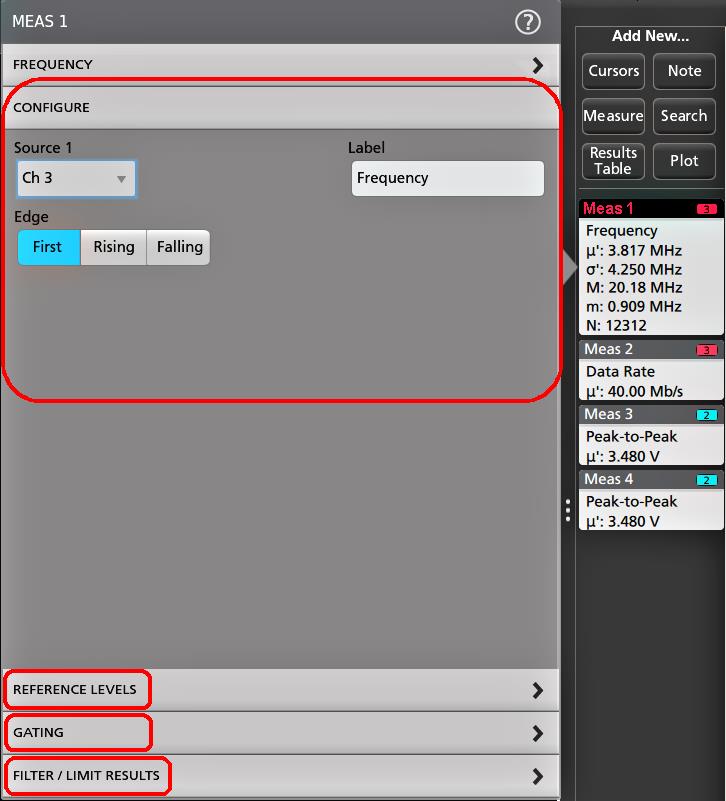
Add a plot of a measurement
Measurement plots let you graph the distribution of waveform data point occurrences (histogram), plot the frequency components (spectrum) of a waveform, show the time trend of a measurement, display an eye diagram, and other supported plots. Available plots depend on the measurement.
- Double-tap a Measurement badge to open the Meas configuration menu.
- Tap a Plots button to add that plot for the measurement to the screen.
The following shows adding a Histogram plot.
You can add more than one plot to measurements (to different measurements or the same measurement). For example, you can add two histogram plots for the same measurement, set one to display the X-Axis with a Logarithmic scale, and the other plot to display the X-Axis with a Linear scale.
- You can move plot windows by dragging the Plot view title bar to a new position. The blue background area moves to show where the plot will be located when you remove your finger from the title bar. You can also resize plot windows by selecting and dragging the Plot view border. You should use a mouse to do these operations, as it is easier to select and drag plots with a mouse.
- Double-tap within a Plot view to open a configuration menu to set display characteristics. Tap the Help icon on the configuration menu title for more information on that menu's settings. Tap outside the menu to close the menu.
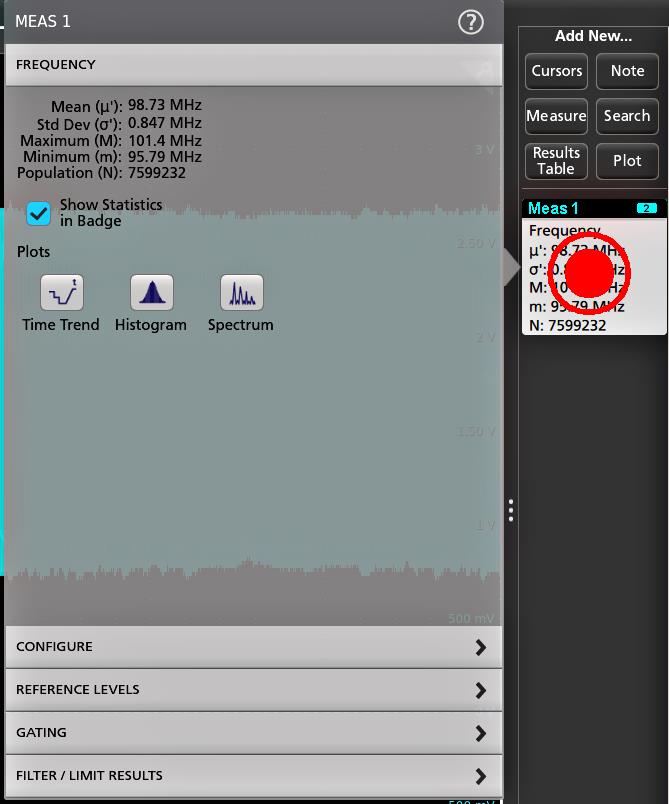
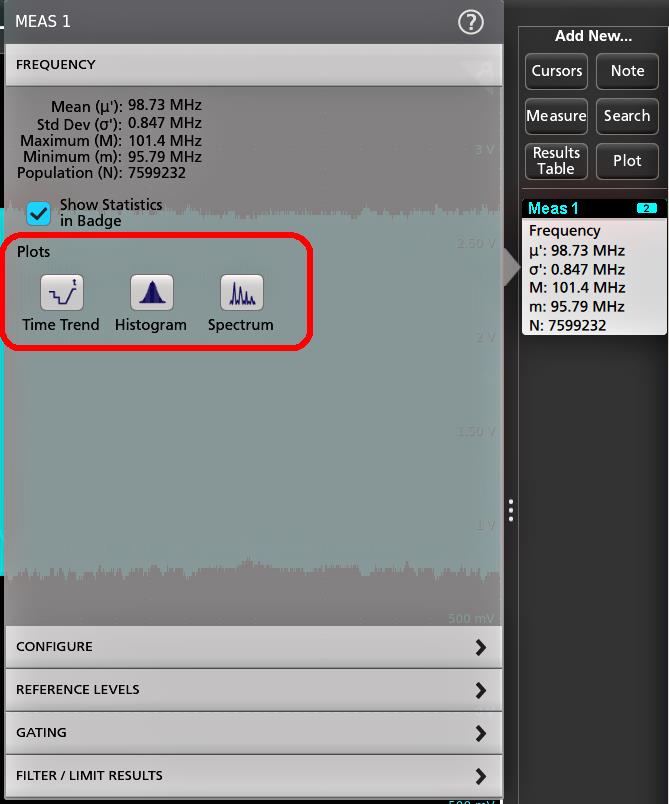
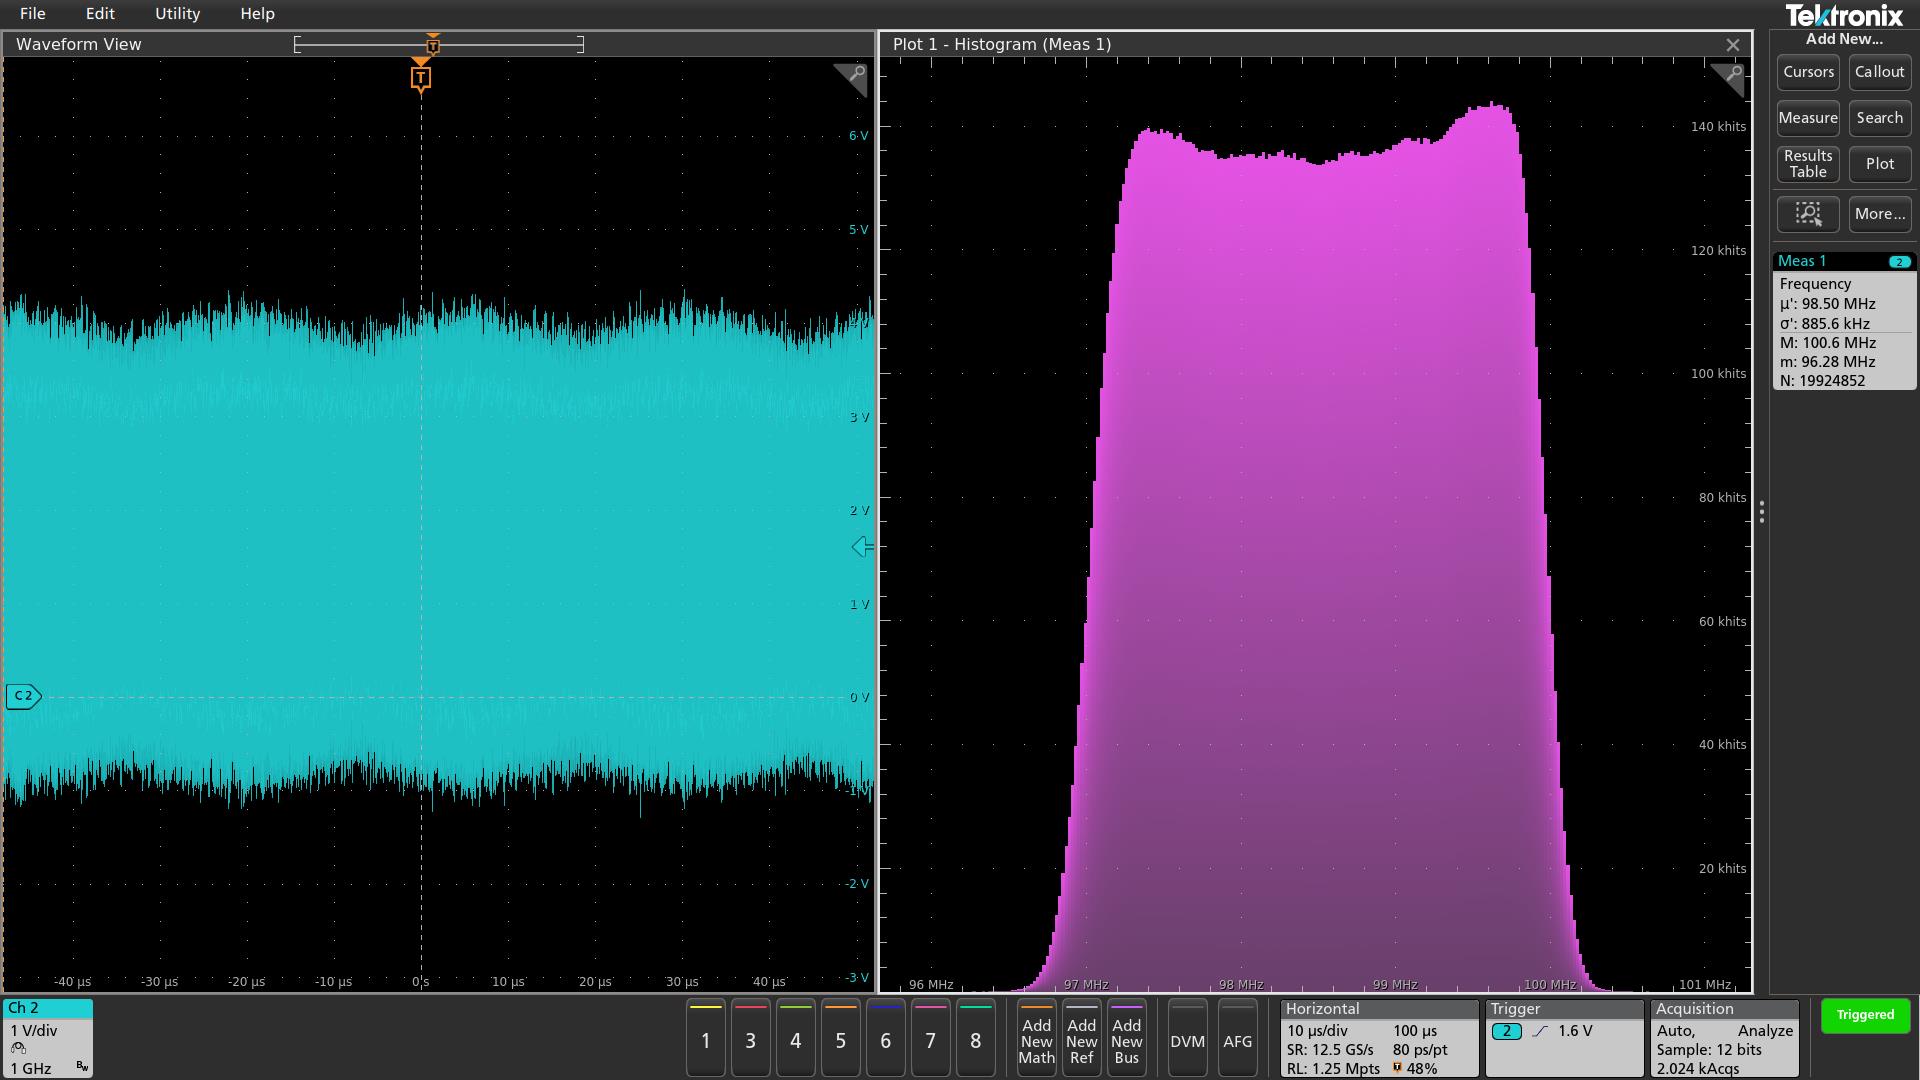
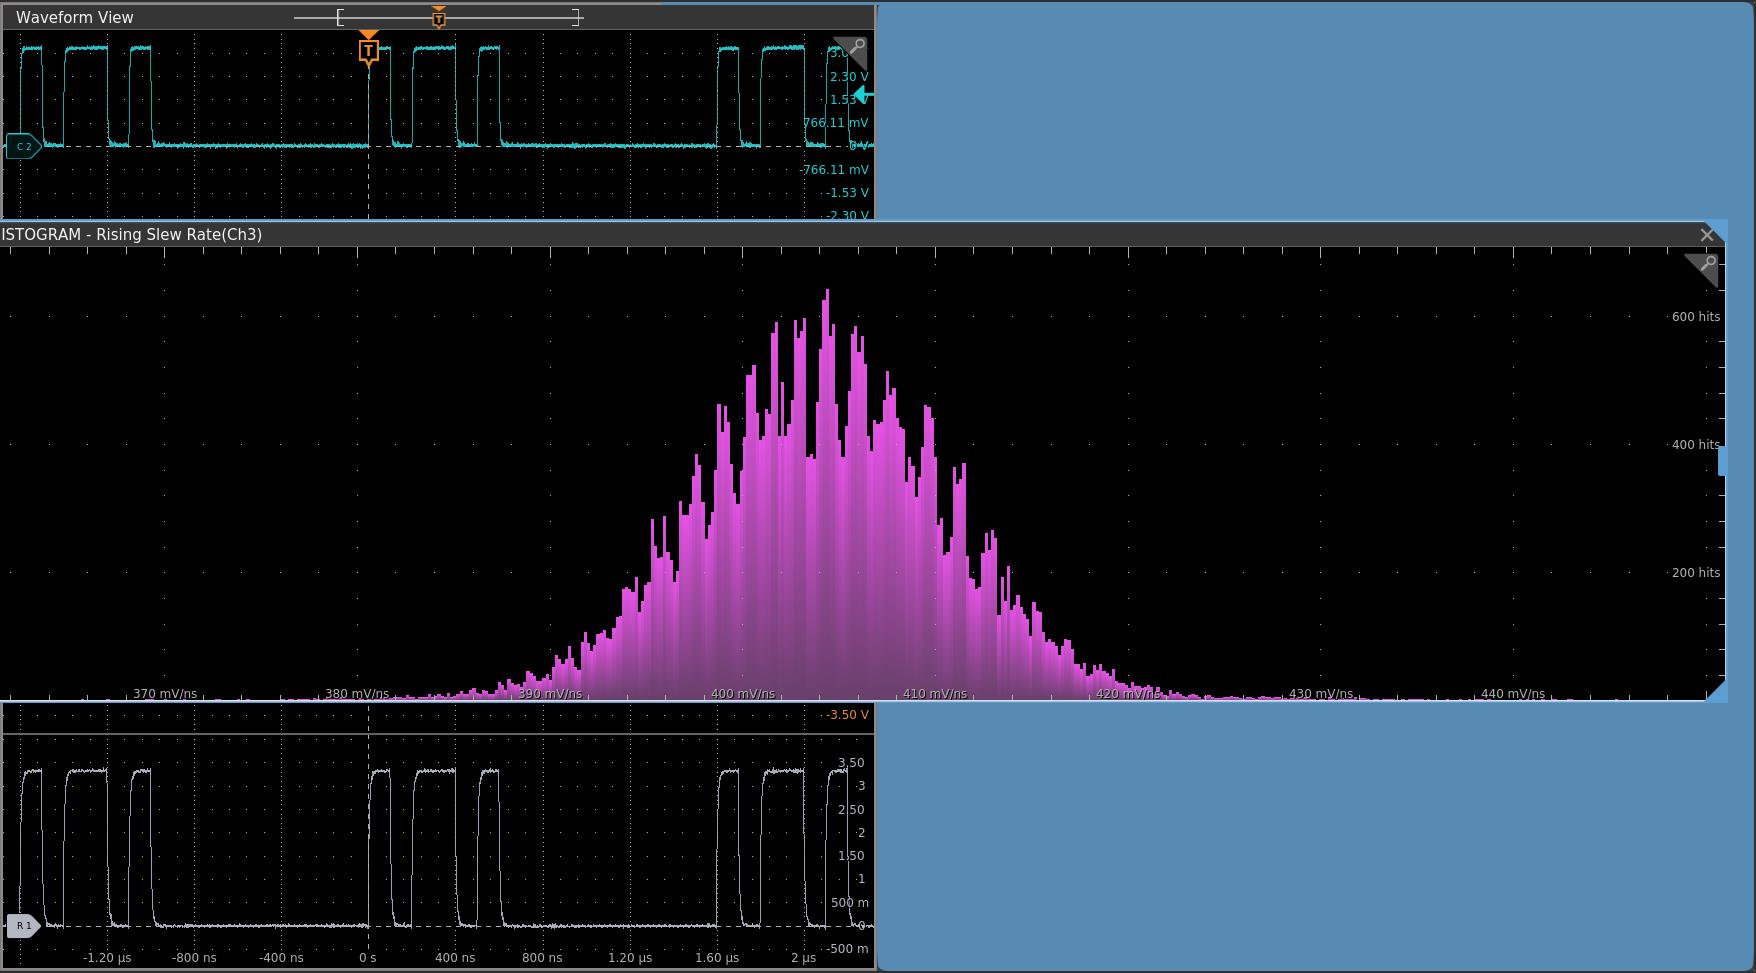
Add a Search
Use this procedure to set search criteria and mark a waveform where those events occur.
You can search on analog and digital signals, math waveforms, and reference waveforms. You can add searches to different waveforms and multiple searches to the same waveform.
Prerequisite: Display the channel or waveform signal on which to search. The waveform must be displayed to create a search for it.
- Tap the button to open the Search configuration menu.
- Use the configuration menu fields to set the search criteria in the same way that you would set for a trigger condition (select the Search Type, Source, and conditions on which to search). Note:You cannot search for sequential events (there is no Sequence search type).
- The searched waveform is marked with one or more triangles as soon as the search criteria becomes true. Each search uses a different color for its markers. The example image shows search criteria set to find positive pulse widths that are less than 70 ns wide.
- To stop showing marks on a waveform, double-tap the Search badge and tap Display to Off.
- To move the waveform to center marks on the display, push the Run/Stop front panel button to stop acquisition, single-tap a Search badge, and tap the < or > Navigation button. Note:Navigation buttons are only functional when the oscilloscope acquisition mode is set to Stop.
This opens the Zoom mode and moves the waveform to the previous or next event mark on the waveform.
- If available for a search, tap the Min or Max button to center the waveform in the display at the minimum or maximum value of the search events in the waveform record.
- To return the instrument to normal acquisition mode, push the Run/Stop front-panel button to set it to Run mode.
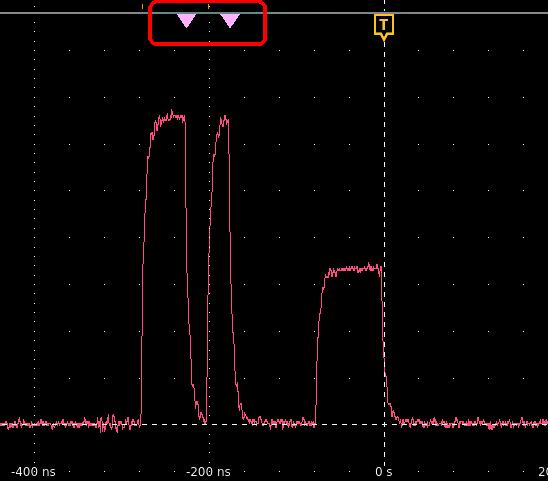
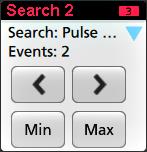
Delete a Measurement or Search badge
Use this procedure to remove a Measurement or Search badge from the Results bar.
- Touch and hold the Measurement or Search badge that you want to delete. The instrument opens a right-click menu.
- Select Delete Meas to delete that badge from the Results bar. Note:You can undo a measurement delete.
- The second way to delete a Measurement or Search badge is by flicking it off the right edge of the display. Flicking to the left from the right edge of the display recovers the badge.
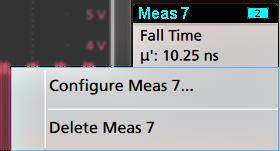
| Note:Badge recovery is possible within 10 seconds only of removal. |
Change waveform view settings
Use this procedure to change the waveform display mode (Stacked or Overlay), waveform trace interpolation algorithm, waveform persistence, style and intensity, and graticule style and intensity.
- Double-tap on an open graticule area to open the Waveform View configuration menu.
- Tap the buttons in the Display Mode to toggle between Overlay and Stacked modes.
- Use the other controls to set the waveform interpolation algorithm, waveform point persistence, style, and intensity, and graticule style and intensity.
- Tap the Help icon on the menu title to open the Waveform View menu help topic for more information on the waveform view parameters.
- Tap outside the menu to close the menu.
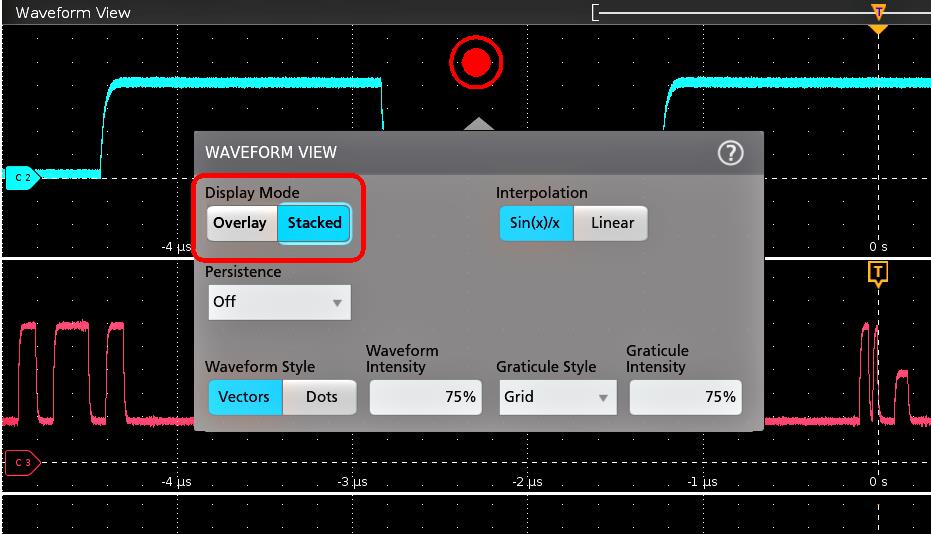
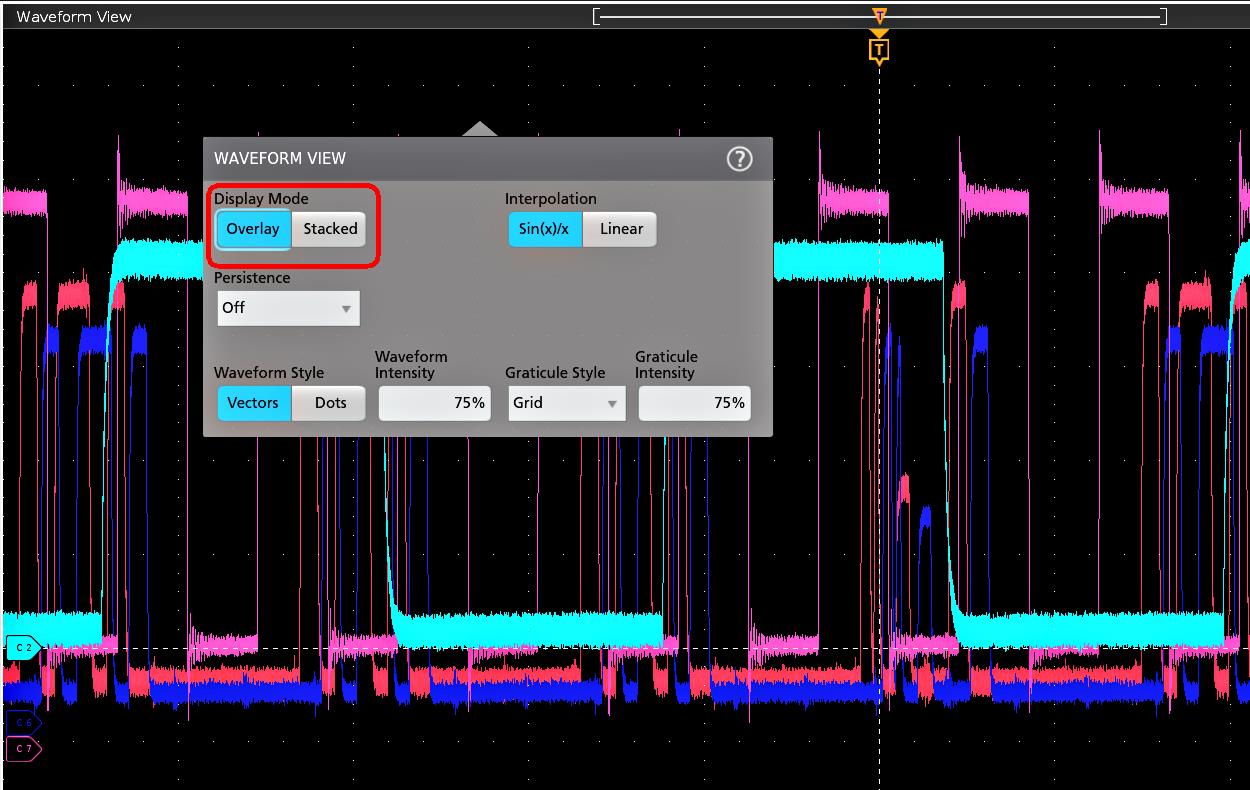
Display and configure cursors
Cursors are on-screen lines that you can move to take measurements on specific parts of a waveform or plot, or between two different waveforms. Cursor readouts show both current position values and the difference (delta) between cursors. Polar cursor readouts are available through the cursor configuration menu for XY plots.
- Tap the waveform slice (in Stacked mode), or the channel or waveform badge (in Overlay mode) to which you want to add cursors.
- Tap the Add New...Cursors button. The cursors are added to the display.
- Use Multipurpose Knobs A and B to move the cursors, or touch and drag a cursor. Cursors show readouts that show position and difference measurements between the cursors.
- To move the cursors to a different channel or waveform, just tap in that waveform graticule.
- To further configure cursors, double-tap on either cursor line or the cursor readouts to open the Cursors configuration menu. For example, tap the Cursor type to select the cursors to display, such as Waveform, V Bars, H Bars, and V&H Bars.
The cursor configuration menu in the waveform view.
The cursor configuration menu in an XY plot.
- To split the cursors between two waveforms, tap the Source field and select Split and select the source for each cursor. The cursors are moved to the specified waveforms.
- Tap the Help icon on the menu title for more information on the menu settings.
- To stop showing cursors, open the Cursors configuration menu and set Display to Off.
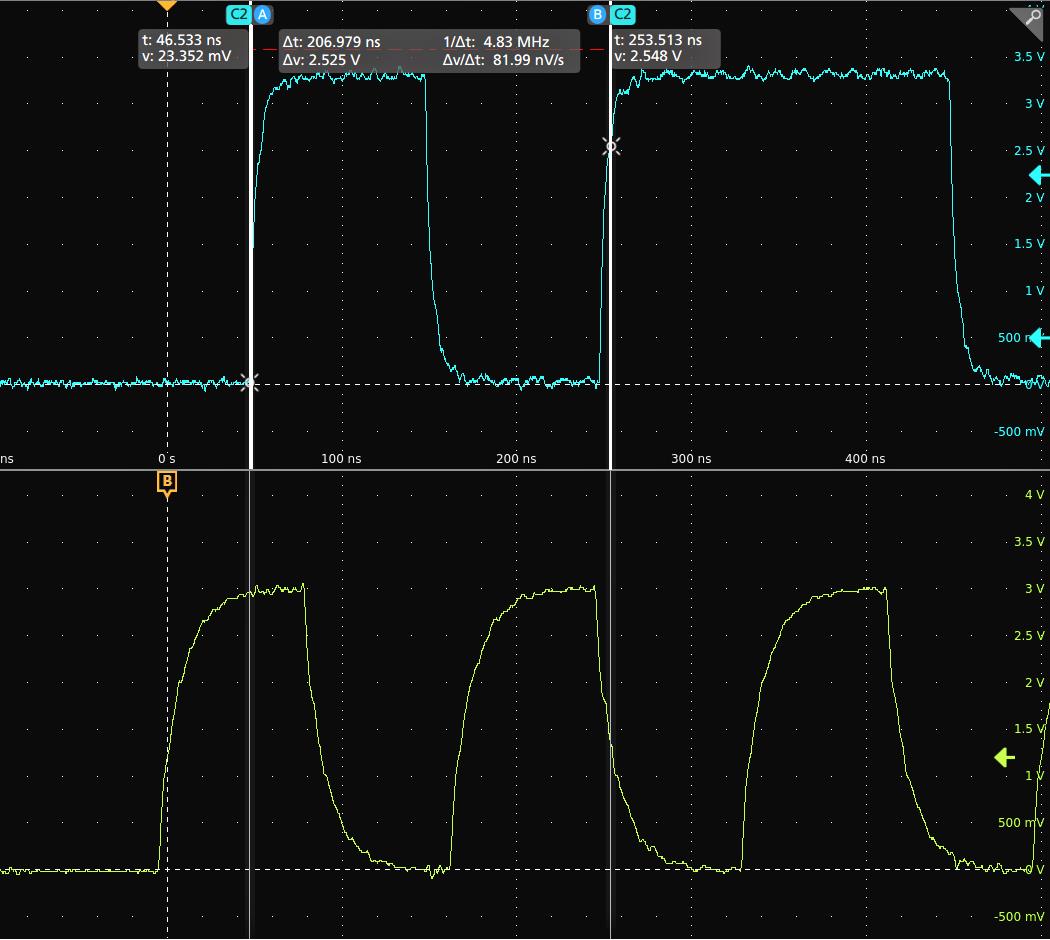
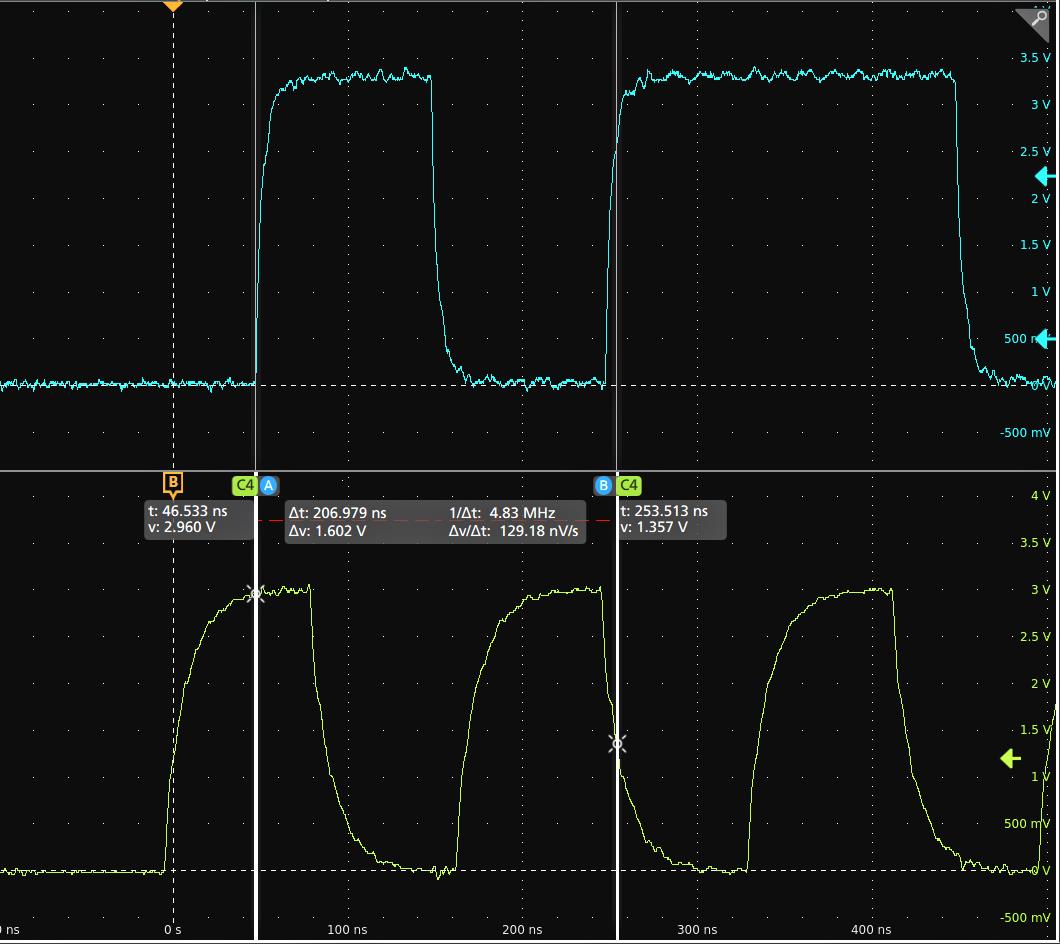
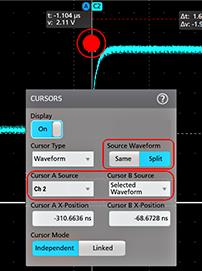
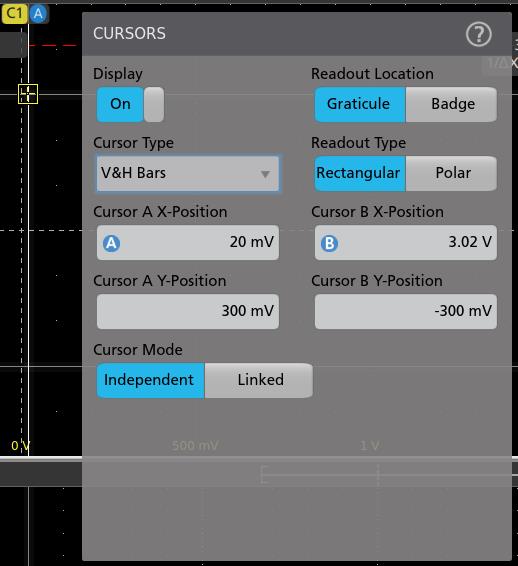
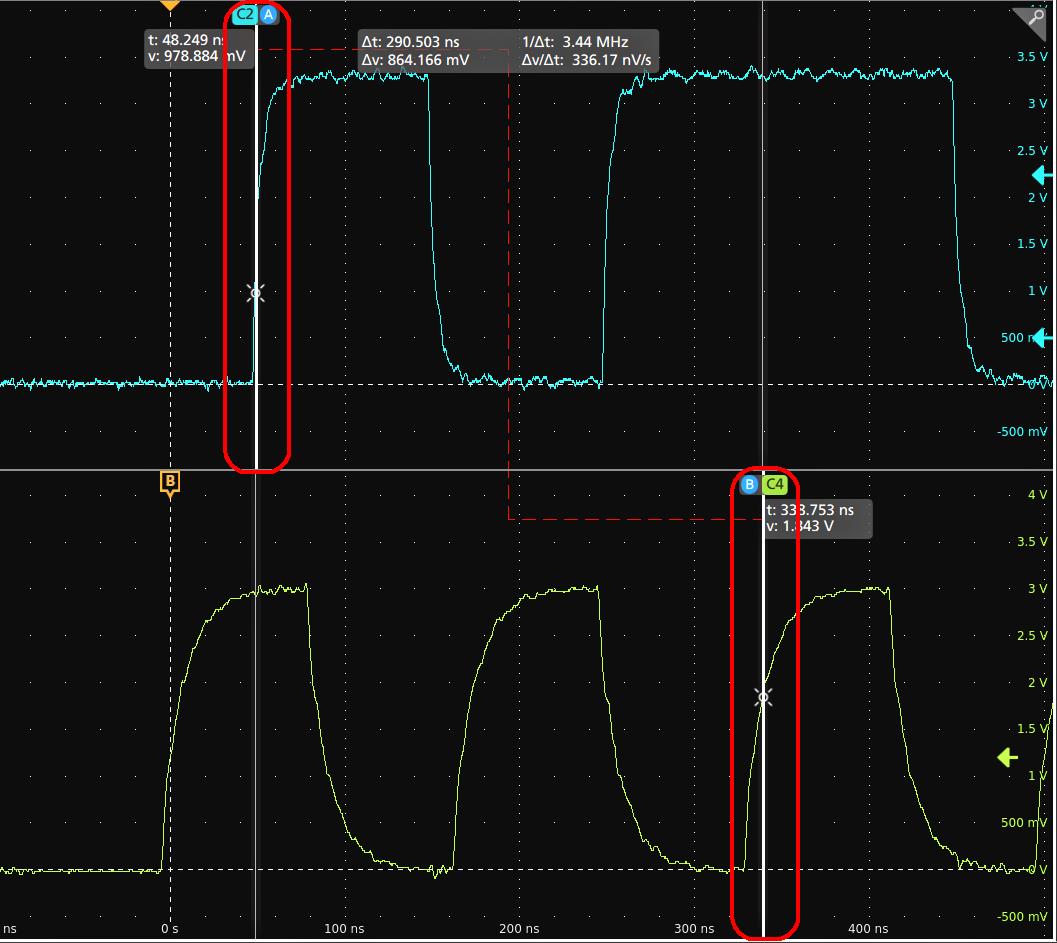
Remote access from a Web browser
You can remotely access your network-connected standard instrument (not running Windows) from a Web browser to display the instrument user interface on a PC.
This procedure describes how to remotely access the UI controls and screen for standard (non Windows 10) instruments. To remotely access the UI controls and screen for Windows 10 instruments, see the Remote access to a Windows 10 instrument topic in the Help.
- The instrument must be connected to, and accessible from, the network to which the PC is connected. See Connect to a network (LAN)
- The IP address of the instrument that you want to access. To determine the instrument's IP address, select Utility > IO in the instrument menu bar and view the network settings in the LAN panel.
- You are accessing a standard (instrument that does not have the Windows OS option installed).
- Open a Web browser on a PC connected to the same network as the instrument.
- Enter just the instrument IP address on the URL line of the browser and press Enter. For example: 135.62.88.157. The browser searches for and opens the Web page for the instrument.
- Select Instrument Control (e*Scope). The browser displays the instrument screen. If a password is set for the e*Scope, an Enter Password window will popup. Enter the password and tap Submit. If the password is input incorrectly five times, it will block the e*Scope for five minutes.
- Use a mouse to select and interact with the instrument controls shown in the Web browser. If your remote PC or laptop has a touch screen monitor, you can use the remote touchscreen monitor to access the instrument controls.
Close the browser to logout the session.
| Note:If connection error occurs, refresh the page in the web browser or restart the web browser for seamless interaction with the instrument remotely. 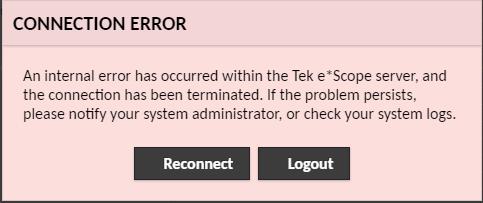 |
- Open a connection to the instrument using e*Scope.
- Select and copy the text on your PC.
- In e*Scope, press Ctrl-Alt-Shift to open the Clipboard menu.
- Paste the text into the Clipboard field.
- Press Ctrl-Alt-Shift to close the browser Clipboard menu.
- Use e*Scope to open the instrument menu to which to paste content, and position the cursor in the field where you want to paste the text.
- Press Ctrl-V (on real keyboard or from virtual keyboard) to paste the text from the e*Scope browser clipboard to the menu field.
- Repeat steps 2 through 7 to copy and paste other text from the PC to the instrument.
Connect the oscilloscope to a PC using a USB cable
Use a USB cable to connect the oscilloscope directly to a PC for remote instrument control.
- On the oscilloscope, select Utility > I/O from the menu bar.
- Tap USB Device Port Settings.
- Confirm that the USB Device Port control is On (default setting).
- Connect a USB cable from the PC to the USB Device port on the instrument.
Maintenance
Inspection and cleaning
Inspection and Cleaning describes how to inspect for dirt and damage. It also describes how to clean the exterior and interior of the instrument. Inspection and cleaning are done as preventive maintenance. Preventive maintenance, when done regularly, may prevent instrument malfunction and enhance its reliability.
Preventive maintenance consists of visually inspecting and cleaning the instrument and using general care when operating it.
How often to perform maintenance depends on the severity of the environment in which the instrument is used. A proper time to perform preventive maintenance is just before instrument adjustment.
Exterior cleaning (other than display)
Clean the exterior surfaces of the chassis with a dry lint-free cloth or a soft-bristle brush. If any dirt remains, use a cloth or swab dipped in a 75% isopropyl alcohol solution. Use a swab to clean narrow spaces around controls and connectors. Do not use abrasive compounds on any part of the chassis that may damage the chassis.
Clean the On/Standby switch using a cleaning towel dampened with deionized water. Do not spray or wet the switch itself.
| CAUTION:Avoid the use of chemical cleaning agents which might damage the plastics used in this instrument. Use only deionized water when cleaning the front-panel buttons. Use a 75% isopropyl alcohol solution as a cleaner for cabinet parts. Before using any other type of cleaner, consult your Tektronix Service Center or representative.
|
Inspection - Exterior. Inspect the outside of the instrument for damage, wear, and missing parts. Immediately repair defects that could cause personal injury or lead to further damage to the instrument.
| Item | Inspect for | Repair action |
|---|---|---|
| Cabinet, front panel, and cover | Cracks, scratches, deformations, damaged hardware | Repair or replace defective module |
| Front-panel knobs | Missing, damaged, or loose knobs | Repair or replace missing or defective knobs |
| Connectors | Broken shells, cracked insulation, and deformed contacts. Dirt in connectors | Repair or replace defective modules. Clear or brush out dirt |
| Carrying handle and cabinet feet | Correct operation | Repair or replace defective module |
| Accessories | Missing items or parts of items, bent pins, broken or frayed cables, and damaged connectors | Repair or replace damaged or missing items, frayed cables, and defective modules |
Flat panel display cleaning
Clean the flat panel display surface by gently rubbing the display with a clean-room wipe (such as Wypall Medium Duty Wipes, #05701, available from Kimberly-Clark Corporation), or an abrasive-free cleaning cloth.
If the display is very dirty, moisten the wipeor cloth with distilled water, a 75% isopropyl alcohol solution, or standard glass cleaner, and gently rub the display surface. Use only enough liquid to dampen the cloth or wipe. Avoid using excess force or you may damage the display surface.
| CAUTION:Improper cleaning agents or methods can damage the flat panel display.
|
| CAUTION:To prevent getting moisture inside the instrument during external cleaning, do not spray any cleaning solutions directly onto the screen or instrument.
|
Service the instrument
For more information on troubleshooting, maintenance, and replacing parts on your instrument refer to the instrument service manual or contact a Tektronix Service Center.
Returning the instrument for service
If the instrument has removable batteries, remove the batteries before repacking the instrument and do not include the batteries in the shipment.
| Note:Do not ship removable batteries to Tektronix Service Centers. |
When repacking the instrument for shipment, use the original packaging. If the packaging is unavailable or unfit for use, contact your local Tektronix representative to obtain new packaging.
Seal the shipping carton with an industrial stapler or strapping tape.
Before returning the instrument for service, contact the Service Center to get an RMA (return material authorization) number, and any return or shipping information you may need.
If the instrument is being shipped to a Tektronix Service Center, enclose the following information:
-
The RMA number.
-
The owner's address.
-
Name and phone number of a contact person.
-
Type and serial number of the instrument.
-
Reason for returning.
-
A complete description of the required service.
Mark the address of the Tektronix Service Center and the return address on the shipping carton in two prominent locations.
Help us improve our technical documentation. Provide feedback on our TekTalk documentation forum.