
Historically, engineers working with high-frequency signals have relied on spectrum analyzers to identify, characterize, and test the performance of their designs, devices, and systems. But these devices fall short when analyzing signals with an unpredictable time-related behavioral component.
Tektronix Real-Time Spectrum Analyzers (RTSAs), however, capture and store signals as a seamless, continuous record of time. Combining deep memory with powerful digital signal processing, RTSAs allow for a variety of triggering, display, and analysis capabilities to reveal signal changes in both the time and frequency domains.
In this post, we’ll cover three key challenges engineers face when it comes to time and frequency correlated measurements, and how Tektronix RTSAs can address those challenges.
- Capturing Unknown Signals
Analyzing today’s high-bandwidth RF signals requires vector measurements that provide both magnitude and phase information. Modern vector signal analyzers (VSAs) are best suited for capturing stationary or repetitive waveforms. But they have a limited ability to analyze transient events, pulsed waveforms, or other fast-occurring phenomena. This becomes an issue, of course, because it’s tough to capture a signal you aren’t aware of or you’re not anticipating.
In addition to capturing traditional spectral measurements, RTSAs produce spectrograms using gapless acquisition with thousands or even millions of FFTs per second. These spectrograms are traditional waterfall color-coded representations of spectral power over time, which allows engineers to track variations in the spectrum.
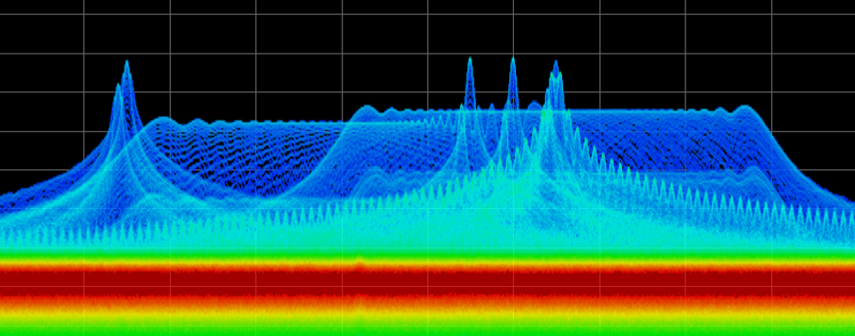
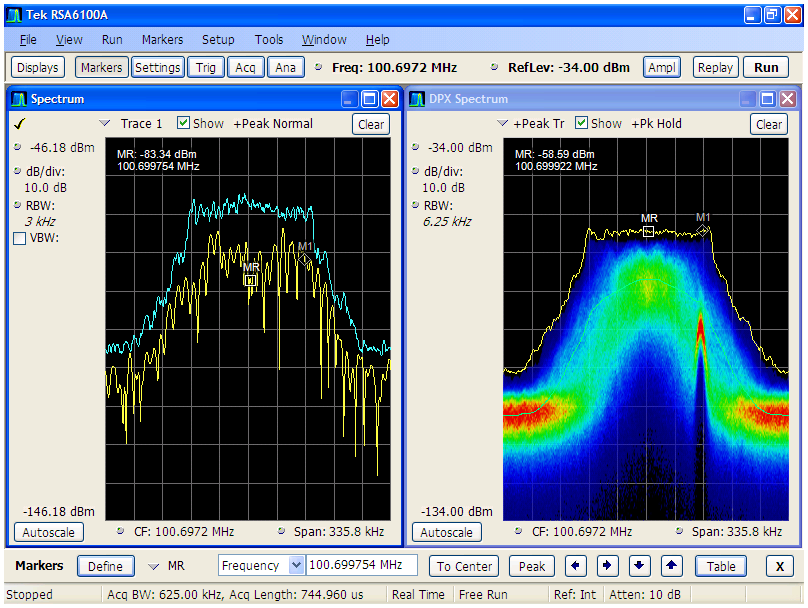
Using patented Digital Phosphor Technology (DPX™), Tektronix RTSAs can uncover hidden signals by rasterizing RF samples into pixel information, giving you a truly “live” view of the RF signals. The DPX display helps you to see how traces change over time and displays signal events that cannot be seen with traditional spectrum analyzers. The DPX spectrum indicates how traces change in two ways: First, it uses color shading to show how consistent the shape of a trace is. Second, it uses persistence to hold signals on the screen so you can see them longer. The DPX display reveals transient signal behavior that helps you discover instability, glitches, and interference that might be in the same band as your expected signals but separated by either time or power levels. This enables you to distinguish rare transient signals from normal signals and background noise, as the figure above shows.
- Triggering in Frequency and Time
VSAs lack key mixed-domain (frequency and time) triggering capabilities — like triggering on specific signal frequency variations, power densities, or event durations — needed to discover infrequent events. They also lack the ability to continuously record while processing acquisitions, so VSAs may miss triggering conditions that occur while processing the previous acquisition. Triggering also requires prior knowledge or understanding of the event, which may not be realistic with transient, intermittent, or unexpected signals.

With gapless acquisition capabilities, Tektronix RTSAs maintain a continuous time record of thousands or even millions of spectra per second, so engineers will never miss fast RF transients and effects again. You can also use RTSAs to set new types of triggers that respond to mixed-domain conditions such as carrier frequency drift or appearance of interferers during an acquisition window. Additionally, users can set DPX density-based triggers, which leverage signal history in the form of display persistence to capture signals only when they occur a minimum number of times.
-
Storing, Retrieving, and Analyzing Data in the Time and Frequency Domain
With traditional VSAs, field engineers often struggle to analyze signals in both the time and frequency domains. To begin with, they need two acquisitions to capture this information — one in the time domain and one in the frequency domain — which is a time-consuming task. Second, the relationship between time and frequency is often lost when engineers are back in the lab and want to retrieve and analyze those signals.
To address this challenge, the internal architecture of Tektronix RTSAs only requires a single acquisition, saving you time, and ensuring that every acquired sample maintains a correlation in the time and in the frequency domain. Furthermore, Tektronix RTSAs preserve the relationship between time and frequency measurements not only during the acquisition, but also when the data moves to storage for later retrieval and analysis. Never again will you find yourself reviewing your data and wondering when that unexpected glitch happened.
For engineers who need to efficiently understand the relationship between signal power, frequency, and time, traditional VSAs can’t do the job. Tektronix Real-Time Spectrum Analyzers, however, address this challenge, saving you time and allowing you to capture, identify, and analyze the hard-to-get, glitchy, and unexpected signals that VSAs miss.
For detailed information regarding these three challenges, please download the technical brief – Overcoming 3 Key Challenges of Time and Frequency Correlated RF Measurements. To see a quick demonstration, check out this video on Fast Spectrum Sweeps with a Real-Time Spectrum Analyzer.


