연락처
텍트로닉스 담당자와 실시간 상담 6:00am-4:30pm PST에 이용 가능
전화
전화 문의
9:00am-6:00PM KST에 이용 가능
다운로드
매뉴얼, 데이터 시트, 소프트웨어 등을 다운로드할 수 있습니다.
피드백
OM4245 OM4225 Optical Modulation Analyzer Datasheet
OM4245, OM4225 Datasheet
이 데이터 시트의 제품은 텍트로닉스에서 더 이상 판매하지 않습니다.
리퍼브 테스트 장비에 대한 Tektronix Encore를 확인하십시오.
이러한 제품에 대한 지원 및 보증 상태를 살펴보십시오.

The OM4245 Optical Modulation Analyzer (OMA) is a 45 GHz 1550 nm (C- and L- band) fiber-optic test system for visualization and measurement of complex modulated signals, offering a complete solution to testing both coherent and direct-detected transmission systems. The OM4245 consists of a polarization- and phase-diverse receiver and analysis software enabling simultaneous measurement of modulation formats important to advanced fiber communications, including polarization-multiplexed (PM) formats such as QPSK, 8QAM, 16QAM, PAM4, and many others. The OMA software performs all calibration and processing functions to enable real-time burst-mode constellation diagram display, eye-diagram display, Poincaré sphere, and bit-error detection.
Key features
Unparalleled flexibility- Optical modulation analyzer architecture is compatible with both real-time and equivalent-time oscilloscopes 1
- Complete coherent signal analysis system for polarization-multiplexed QPSK, offset QPSK, QAM, differential BPSK/QPSK, and other advanced modulation formats
- Displays constellation diagrams, phase eye diagrams, Q-factor, Q-plot, spectral plots, Poincaré Sphere, signal vs. time, laser phase characteristics, BER, with additional plots and analyses available through the MATLAB interface
- Measures polarization mode dispersion (PMD) of arbitrary order with most polarization multiplexed signals
- Precise coherent receiver hardware provides minimal variation over temperature and time for a high degree of accuracy and high-stability, polarization-diverse, optical field detection
- Highly linear photo detection allows operation at high local oscillator and signal power levels to eliminate electrical amplification
- An integrated pair of ECDL tunable lasers for use as a local oscillator and another for self-test. Both lasers have industry-best linewidth and tuning range for any wavelength within the band
- Optical modulation analyzer software tolerates >5 MHz instantaneous signal laser linewidth – compatible with standard network tunable sources such as DBR and DFB lasers
- No laser phase or frequency locking required
- Smart polarization separation follows signal polarization
- User access to internal functions with a direct MATLAB 2 interface
- Remote access available through Ethernet
- Superior user interface offers comprehensive visualization for ease-of-use combined with the power of MATLAB
- Optical modulation signal analyzer software included with OM1106 and OM4200 series products
- Multi-carrier software option allows user-definable superchannel setup
- Superchannel configuration allows user to define number of channels, channel frequency, and channel modulation format
- Test automation acquires complete measurements at each channel
- Integtrated measurement results allow easy channel-to-channel comparisons
1Certain features may be available only when used with Tektronix oscilloscopes.
2MATLAB is a registered trademark of MathWorks.
OM4200 series instrument flexibility
The OM4000 series instruments were the first in the industry to work with both real-time and equivalent-time oscilloscopes. This unprecedented architecture allows the user to get the benefits of either acquisition format all with a single optical modulation analyzer (OMA). The OM4200 series continues this flexibility. For customers whose analysis requires a high sample rate, using the OM4200 with a real-time oscilloscope, such as the Tektronix DPO70000SX series, may be optimal. For customers whose analysis requires high vertical resolution – such as modulator characterization – an equivalent-time oscilloscope may be the most beneficial. Using a Tektronix oscilloscope solution of sufficient bandwidth provides coherent analysis up to 80 GBaud.
OMA user interface
The OMA software has displays for all of the standard coherent optical visualizations such as eye diagrams, constellation diagrams, Poincaré spheres, and so on. The software also provides a complete measurement suite to numerically report key measurements. Constellation measurements include elongation, real and imaginary bias, magnitude, phase angle, EVM, and others. Eye diagram measurements include many key time domain metrics such as eye height, overshoot, undershoot, risetime, falltime, skew, crossing point, and so on. All numerical measurements also provide statistics to enable data gathering over longer periods of time.

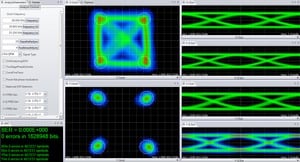
OMA software showing color-grade graphics options. Symbols can also be colored to a key indicating prior state. Data shown is 112 Gb/s PM-QPSK.
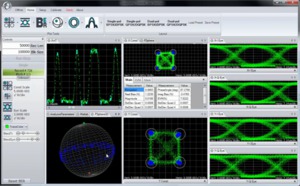
OMA showing several equivalent-time measurement plots.
Interaction between OMA and MATLAB
The OMA software takes information about the signal provided by the user together with acquisition data from the oscilloscope and passes them to the MATLAB workspace. A series of MATLAB scripts are then called to process the data and produce the resulting field variables. The software then retrieves these variables and plots them. Automated tests can be accomplished by connecting to the OMA software or by connecting directly to the MATLAB workspace.
You do not need any familiarity with MATLAB; the OMA software can manage all MATLAB interactions. However, advanced users can access the MATLAB interface internal functions to create user-defined demodulators and algorithms, or for custom analysis visualization.
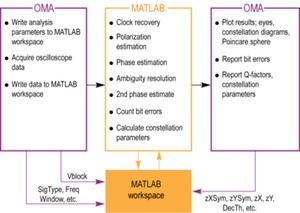
OMA software/MATLAB data flow
Signal processing approach
For real-time sampled systems, the first step after data acquisition is to recover the clock and retime the data at 1 sample per symbol at the symbol center for the polarization separation and following algorithms (shown as upper path in the figure). The data is also re-sampled at 10X the baud rate (user settable) to define the traces that interconnect the symbols in the eye diagram or constellation (shown as the lower path).
The clock recovery approach depends on the specified signal type. Laser phase is then recovered based on the symbol-center samples. Once the laser phase is recovered, the modulation part of the field is available for alignment to the expected data for each tributary. At this point bit errors can be counted by looking for the difference between the actual and expected data after accounting for all possible ambiguities in data polarity. The software selects the polarity with the lowest BER. Once the actual data is known, a second phase estimate can be done to remove errors that may result from a laser phase jump. Once the field variables are calculated, they are available for retrieval and display by the OMA software.
At each step the best algorithms are chosen for the specified data type, requiring no user intervention unless desired.
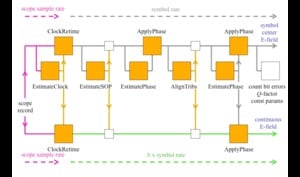
Data flow through the “Core Processing” engine.
Get up and running fast with the easy-to-use OMA interface
The OMA software lets you easily configure and display your measurements and also provides software control for third-party applications using WCF or .NET communication. The software can also be controlled from MATLAB or LabVIEW.
The following image shows a QAM measurement setup. The plots can be moved, docked, or resized within the application work space or into separate windows on the desktop. You can display or close plots to show just the information you need.
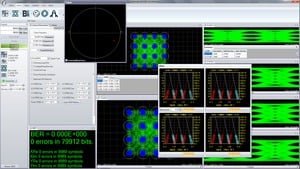
QAM measurements on the OMA software.
In addition to the numerical measurements provided on individual plots, the Measurements tab provides a summary of all numeric measurements, including statistics.
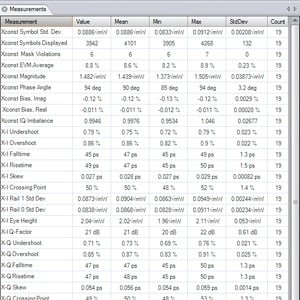
The Measurements tab- a summary of all measurements in one place
Make measurements faster
The OMA software is designed to collect data from the oscilloscope and move it into the MATLAB workspace with extreme speed to provide the maximum data refresh rate. The data is then processed in MATLAB to extract and display the resulting measurements.
Take control with tight MATLAB integration
Since 100% of the data processing occurs in MATLAB, test engineers can easily probe into the processing to understand each step along the way. R&D labs can also take advantage of the tight MATLAB integration by writing their own MATLAB algorithms for new techniques under development.
Use the optimum algorithm
Don’t worry about which algorithm to use. When you select a signal type in the OMA software (for example, PM-QPSK), the application applies the optimal algorithm for that signal type to the acquired data. Each signal type has a specially designed signal processing approach optimized for that signal. This means that you get results right away.
Don’t get stymied by laser phase noise
Signal processing algorithms designed for electrical wireless signals don’t always work well with the much noisier sources used for complex optical modulation signals. Our robust signal processing methods tolerate enough phase noise to make it possible to test signals that would traditionally be measured by differential or direct detection such as DQPSK.
Find the right BER
Q-plots are a great way to get a handle on your data signal quality. Numerous BER measurements vs. decision threshold are made on the signal after each data acquisition. Plotting BER vs. decision threshold shows the noise properties of the signal. Gaussian noise will produce a straight line on the Q-plot. The optimum decision threshold and extrapolated BER are also calculated. This gives you two BER values: the actual counted errors divided by the number of bits counted, as well as the extrapolated BER for use when the BER is too low to measure quickly.
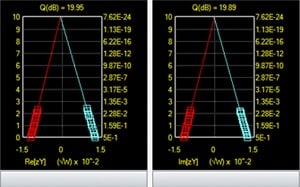
Q-plot.
Constellation diagrams
Once the laser phase and frequency fluctuations are removed, the resulting electric field can be plotted in the complex plane. When only the values at the symbol centers are plotted, this is called a Constellation Diagram. When continuous traces are also shown in the complex plane, this is often called a Phase Diagram. Since the continuous traces can be turned on or off, we refer to both as the Constellation Diagram.
The scatter of the symbol points indicates how close the modulation is to ideal. The symbol points spread out due to additive noise, transmitter eye closure, or fiber impairments. The scatter can be measured by symbol standard deviation, error vector magnitude, or mask violations.
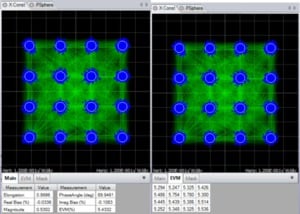
Constellation diagram.
Constellation measurements
Measurements made on constellation diagrams are available on the “fly-out” panel associated with each graphic window. The measurements available for constellations are described below.
| Measurement | Description |
|---|---|
| Elongation | The ratio of the Q modulation amplitude to the I modulation amplitude is a measure of how well balanced the modulation is for the I and Q branches of a particular polarization’s signal |
| Real Bias | Expressed as a percent, this says how much the constellation is shifted left or right. Real (In-phase) bias other than zero is usually a sign that the In-phase Tributary of the transmitter modulator is not being driven symmetrically at eye center |
| Imag Bias | Expressed as a percent, this says how much the constellation is shifted up or down. Imaginary (Quadrature) bias other than zero is usually a sign that the Quadrature Tributary of the transmitter modulator is not being driven symmetrically at eye center |
| Magnitude | The mean value of the magnitude of all symbols with units given on the plot. This can be used to find the relative sizes of the two Polarization Signals |
| Phase Angle | The transmitter I-Q phase bias. It should normally be 90 |
| StdDev by Quadrant | The standard deviation of symbol point distance from the mean symbol in units given on the plot. This is displayed for BPSK and QPSK |
| EVM (%) | The RMS distance of each symbol point from the ideal symbol point divided by the magnitude of the ideal symbol expressed as a percent |
| EVM Tab | The separate EVM tab shown in the right figure provides the EVM% by constellation group. The numbers are arranged to correspond to the symbol arrangement. This is ideal for setting Transmitter modulator bias. For example, if the left side groups have higher EVM than the right side, adjust the In-phase Transmitter modulator bias to drive the negative rail harder |
| Mask Tab | The separate Mask tab shown in the right figure provides the number of mask violations by constellation group. The numbers are arranged to correspond to the symbol arrangement. The mask threshold is set in the Engine window and can be used for pass/fail transmitter testing |
Color features
The Color Grade feature provides an infinite persistence plot where the frequency of occurrence of a point on the plot is indicated by its color. This mode helps reveal patterns not readily apparent in monochrome. Note that the lower constellation groups of the example below have higher EVM than the top groups. In most cases this indicates that the quadrature modulator bias was too far toward the positive rail. This is not evident from the crossing points which are approximately correct. In this case an improperly biased modulator is concealing an improperly biased driver amp.
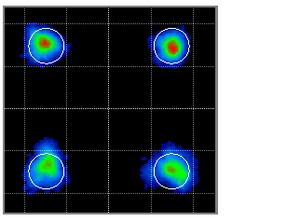
Color Grade Constellation.
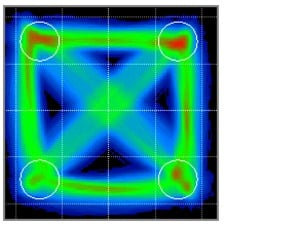
Color Grade with fine traces.
Color Key Constellation Points is a special feature that works when not in Color Grade. In this case the symbol color is determined by the value of the previous symbol. If the prior symbol was in Quadrant 1 (upper right) then the current symbol is colored Yellow. If the prior symbol was in Quadrant 2 (upper left) then the current symbol is colored Magenta. If the prior symbol was in Quadrant 3 (lower left) then the current symbol is colored Light Blue (Cyan). If the prior symbol was in Quadrant 4 (lower right) then the current symbol is colored Solid Blue.
This helps reveal pattern dependence. The following figure shows that pattern dependence is to blame for the poor EVM on the other groups. The modulator nonlinearity would normally mask this type of pattern dependence due to RF cable loss, but here the improper modulator bias allows that to be transferred to the optical signal.
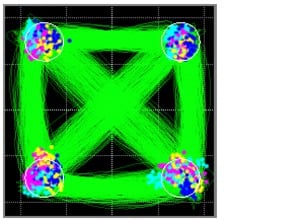
Color Key constellation
Eye diagrams
Eye diagram plots can be selected for appropriate modulation formats. Supported eye formats include Field Eye (the real part of the phase trace in the complex plane), Power Eye (which simulates the eye displayed with a Tektronix oscilloscope optical input), and Diff-Eye (which simulates the eye generated by using a 1-bit delay-line interferometer). As with the Constellation Plot you can right-click to choose color options as well.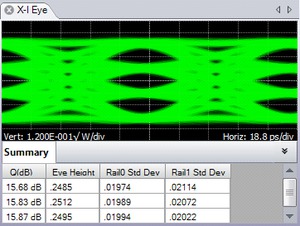
Field eye diagram.
Field eye measurements
| Measurement | Description |
|---|---|
| Q (dB) | Computed from 20 × Log10 of the linear decision threshold Q-factor of the eye |
| Eye Height | The distance from the mean 1-level to the mean 0-level (units of plot) |
| Rail0 Std Dev | The standard deviation of the 0-level as determined from the decision threshold Q-factor measurement |
| Rail1 Std Dev | The standard deviation of the 1-level as determined from the decision threshold Q-factor measurement |
In the case of multilevel signals, the above measurements are listed in the order of the corresponding eye openings in the plot. The top row values correspond to the top-most eye opening.
The above functions involving Q-factor use the decision threshold method described in the paper by Bergano1. When the number of bit errors in the measurement interval is small, as is often the case, the Q-factor derived from the bit error rate may not be an accurate measure of the signal quality. However, the decision threshold Q-factor is accurate because it is based on all the signal values, not just those that cross a defined boundary.
1N.S. Bergano, F.W. Kerfoot, C.R. Davidson, “Margin measurements in optical amplifier systems,” IEEE Phot. Tech. Lett., 5, no. 3, pp. 304-306 (1993).
Additional measurements available for nonoffset formats
| Measurement | Description |
|---|---|
| Overshoot | The fractional overshoot of the signal. One value is reported for the tributary, and for a multilevel (QAM) signal it is the average of all the overshoots |
| Undershoot | The fractional undershoot of the signal (overshoot of the negative-going transition) |
| Risetime | The 10-90% rise time of the signal. One value is reported for the tributary, and for a multilevel (QAM) signal it is the average of all the rise times |
| Falltime | The 90-10% fall time of the signal |
| Skew | The time relative to the center of the power eye of the midpoint between the crossing points for a particular tributary |
| Crossing Point | The fractional vertical position at the crossing of the rising and falling edges |
Measurements vs. Time
In addition to the eye diagram, it is often important to view signals versus time. For example, it is instructive to see what the field values were doing in the vicinity of a bit error. All of the plots that display symbol-center values will indicate if that symbol errors by coloring the point red (assuming that the data is synchronized to the indicated pattern). The Measurement vs. Time plot is particularly useful to distinguish errors due to noise, pattern dependence, or pattern errors.
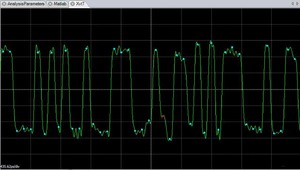
Errored symbol (red dot) in Measurement vs. Time plot.
3D visualization tools
Complex-modulation signals are inherently 3D since in-phase and quadrature components are being changed vs. time. The 3D Eye Diagram provides a helpful combination of the Constellation and Eye diagrams into a single 3D diagram. This helps to visualize how the complex quantity is changing through the bit period. The diagram can be rotated and scaled.
Also available in 3D is the Poincaré Sphere. The 3D view is helpful when viewing the polarization state of every symbol. The symbols tend to form clusters on the Poincaré Sphere which can be revealing to expert users. The non-normalized Stokes Vectors can also be plotted in this view.
Analysis Controls
The various Analysis Control tabs in the OMA software let you set parameters for the system and relevant measurements.
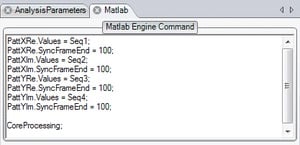
MATLAB tab.
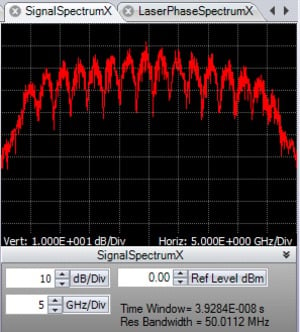
Signal Spectrum tab.
| Parameter | Description |
|---|---|
| Frequency | Clock recovery is performed in software, so only a frequency range of expected clock frequencies is required |
| Signal Type | The signal type (such as PM-QPSK) determines the algorithm used to process the data |
| Data Patterns | Specifying the known PRBS or user pattern by physical tributary permits error counting, constellation orientation, and two-stage phase estimation |
You can assign user data patterns in the MATLAB tab. The data pattern can be input into MATLAB or found directly through measurement of a high SNR signal.
Signal spectra
An FFT of the corrected electric field vs. time can reveal much about the data signal. Asymmetric or shifted spectra can indicate excessive laser frequency error. Periodicity in the spectrum shows correlation between data tributaries. The FFT of the laser phase vs. time data can be used to measure laser phase noise.
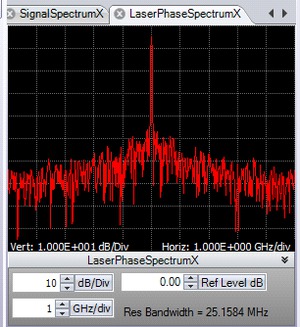
Laser Phase Spectrum window
Poincaré Sphere
Polarization data signals typically start out well aligned to the PM-fiber axes. However, once in standard single mode fiber, the polarization states will start to drift. However, it is still possible to measure the polarization states and determine the polarization extinction ratio. The software locks on each polarization signal. The polarization states of the two signals are displayed on a circular plot representing one face of the Poincaré sphere. States on the back side are indicated by coloring the marker blue. The degree of orthogonality can be visualized by inverting the rear face so that orthogonal signals always appear in the same location with different color. So, Blue means back side (negative value for that component of the Stokes vector), X means X-tributary, O means Y-tributary, and the Stokes vector is plotted so that left, down, blue are all negative on the sphere.
InvertedRearFace – Checking this box inverts the rear face of the Poincaré sphere display so that two orthogonal polarizations will always be on top of each other.
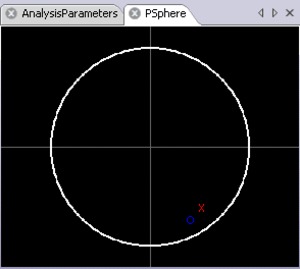
Poincaré Sphere window.
Impairment measurement and compensation
When studying transmission implementations, it is important to be able to compensate for the impairments created by long fiber runs or optical components. Chromatic Dispersion (CD), and Polarization Mode Dispersion (PMD) are two important linear impairments that can be measured or corrected by the OMA software. PMD measurement is based on comparison of the received signal to the back-to-back transmitter signal or to an ideal signal. This produces a direct measure of the PMD instead of estimating based on adaptive filter behavior. You can specify the number of PMD orders to calculate. Accuracy for 1st-order PMD is ~1 ps at 10 Gbaud. There is no intrinsic limit to the CD compensation algorithm. It has been used successfully to compensate for many thousands of ps/nm.
Recording and playback
You can record the workspace as a sequence of .MAT files using the Record button in the Offline ribbon. These files are recorded in a default directory, usually the MATLAB working directory, unless previously changed. You can play back the workspace from a sequence of .MAT files by first using the Load button in the Offline Commands section of the Home ribbon. Load a sequence by marking the files you want to load using the Ctrl key and marking the filenames with the mouse. You can also load a contiguous series using the Shift key and marking the first and last filenames in the series with the mouse. Use the Run button in the Offline Commands section of the Home ribbon to cycle through the .MAT files you recorded. All filtering and processing you have implemented occurs on the recorded files as they are replayed.

Workspace record and playback.
Multi-carrier superchannel support
Even as 100G coherent optical systems are being deployed, architectures for 400G and beyond are being proposed and developed. One architecture gaining prominence is the “superchannel.” The configurations of superchannels vary considerably. Some proposals call for 400G to be achieved by 2 carriers of DP-16QAM. Other proposals are for 500 Gb/s consisting of 10 or more carriers of DP-QPSK. Some of these carriers are arranged on a standard ITU carrier grid, while others support 12.5 GHz “grid-less” layouts. Clearly, flexible test tools are needed for such next-generation systems. Option MCS for the OM4245 or OM4225 offers the complete flexibility to carry out such tests.
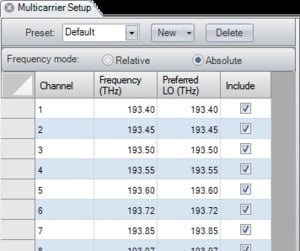
Multi-carrier setup.
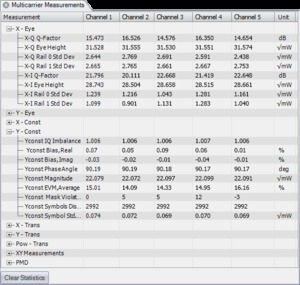
Multi-carrier measurements.
User-definable superchannels
For manufacturers getting a jump on superchannels, or researchers investigating alternatives, user-definable superchannel configurations are a must. Option MCS lets you set up as many carriers within the superchannel definition as necessary. Each carrier can have an arbitrary center frequency; no carrier grid spacing is imposed. The carrier center frequencies can be set as absolute values (in THz) or as relative values (in GHz).
Typically, the application software retunes the OM4245 local oscillator for each carrier. However, in cases where multiple carriers will fit within the oscilloscope bandwidth, multiple carriers can be demodulated in software from a common local oscillator frequency. This provides the flexibility to specify the preferred local oscillator frequency for each carrier.
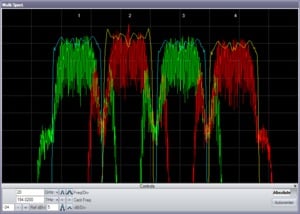
Superchannel spectrum.
Automated measurements
Once the superchannel is configured, the OMA software can take measurements on each channel without further intervention. The software automatically tunes the OM4245 local oscillator, takes measurements at that channel, re-tunes to the next channel, and so on, until measurements of the entire superchannel have been taken. Results of each channel are displayed in real-time and persist after all measurements are made for easy comparison.
Integrated measurement results
All of the same measurement results that are made for single channels are also available for individual channels in a superchannel configuration. Additionally, multi-carrier measurement results are available side-by-side for comparison between channels. Visualizations such as eye diagrams, constellation diagrams, and optical spectrum plots can be viewed a single channel at a time, or with all channels superimposed for fast comparison.
For separating channels in a multi-carrier group, several different filters can be applied, including raised cosine, Bessel, Butterworth, Nyquist, and user-defined filters. These filters can be any order or roll-off factor and track the signal frequency.
Receiver test
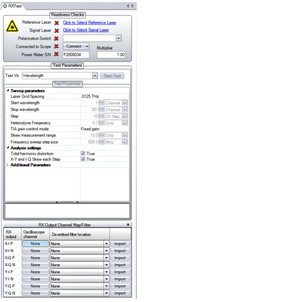
The OMA software can perform many of the coherent receiver measurements specified in the OIF Implementation Agreements and elsewhere. These measurements include:
- Small signal bandwidth, including:
- Absolute magnitude frequency response
- Relative I/Q and X/Y magnitude response
- Relative I/Q and X/Y phase response
- Low frequency cutoff
- P/N, I/Q and X/Y skew
- Total harmonic distortion
- Image rejection ratio
- Quadrature phase error
- IQ; XY gain imbalance
Relevant measurements are a function of wavelength. In order to optimize test time, you can specify the start and stop wavelengths, the step size, and a wide range of other parameters. The Wavelength Sweep can also produce a calibration file that is used by software to correct for coherent receiver impairments, when the receiver is part of a Tektronix Optical Modulation Analyzer system.
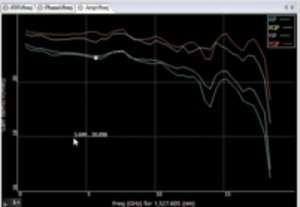
Test results are displayed both graphically and numerically based upon the user's preference. Some receiver test measurements require the use of the OM2210 Receiver Calibration Source.
Coherent optical signal generation
Tektronix offers several signal generation instruments capable of generating coherent optical waveforms. The AWG70000 Series Arbitrary Waveform Generators (AWG) and the PPG3000 Series Programmable Pattern Generators offer the flexibility to choose the signal generator best suited to your test requirements.
The AWG70000 Series can reach sampling rates as high as 50 GS/s with 10 bits vertical resolution. This level of performance allows for the direct generation of IQ baseband signals required by modern coherent optical communication systems. The arbitrary waveform generation capabilities of the AWG70000 Series makes it possible to create multi-level signals such as 16QAM or 64QAM, add impairments to a signal, or create waveforms that are pre-compensated for the real-world effects of the test system.
Coherent optical signal generation is one of the more demanding applications for an AWG. The requirements in terms of number of channels, sampling rate, bandwidth, record length, and timing and synchronization quality can be only met by the highest performance instruments, such as the Tektronix AWG70000 series. The unique capability of generating ideal or distorted signals, and the ease to add new modulation schemes and signal processing algorithms without the need to add any extra hardware, make Tektronix AWGs an ideal tool for coherent optical communication research and development.
The PPG3000 Series can generate patterns up to 32 Gb/s and offers 1, 2, or 4 channels in a single instrument. The patterns can be standard PRBS patterns or user-defined. Using a 4-channel pattern generator makes creating dual-polarization I-Q waveforms very simple.
Coherent optical modulation: The OM5110
Engineers need instrument-grade optical signal sources to test the latest 100G, 400G, and 1Tb/s coherent optical products. The Tektronix OM5110 Multi-format Optical Transmitter provides the flexibility to modulate all the most common coherent optical formats at rates up to 46 GBaud.
The OM5110 Multi-Format Optical Transmitter is a C-and L-Band transmitter capable of modulating the most common coherent optical modulation formats such as PM-QPSK and PM-16QAM. When combined with a signal source, such as the AWG70001A Arbitrary Waveform Generator or the PPG3204 32 Gb/s Pattern Generator, it offers a complete coherent optical test signal generation system.
For coherent optical transmitter or transceiver manufacturers, the OM5110 may be used as a golden reference against which to compare module designs. The OM4245 optical modulation analyzer can be used to measure the performance of a transmitter under development and then compared against the OM5110 reference transmitter. The flexibility to automatically or manually set all amplifier and modulator bias points provides the user to simulate less-than-ideal performance of their own device.
Coherent optical receiver manufacturers can also use the OM5110 as the ideal transmitter with which to test their receiver’s performance and prove functionality under best-case conditions. Then, using an instrument such as the AWG70001A Arbitrary Waveform Generator, optical impairments can be added to the signal to test the receiver under a wide range of real-world scenarios.
As the demand for network bandwidth has increased, new transmission schemes such as multi-carrier “superchannels” are under investigation. The OM5110 can function as the heart of a superchannel system. Multiple optical carriers can be externally combined and used as the laser source to the OM5110 using the external signal input. Tektronix offers external laser sources, such as the OM2012 Tuneable Laser Source which can be used to create a superchannel system. With such a configuration systems with aggregate data rates such as 400G, 1Tb/s, and beyond, can be created.
Supported measurements and display tools
| Characteristic | Description |
Real-time supported feature |
Equivalent time supported feature |
|---|---|---|---|
| Constellation Diagram | Constellation diagram accuracy including intradyne and demodulation error can be measured by the RMS error of the constellation points divided by the magnitude of the electric field for each polarization signal | X | X |
| Constellation Elongation | Ratio of constellation height to width | X | X |
| Constellation Phase Angle | Measure of transmitter IQ phase angle | X | X |
| Constellation I and Q Bias | Measure of average symbol position relative to the origin | X | X |
| Constellation Mask | User-settable allowed EVM level. Symbols violating the mask are counted | X | X |
| Eye Decision Threshold Q-factor | The actual Q achieved will depend on the quality of the data signal, the signal amplitude, and the oscilloscope used for digitalization. Using the Tektronix DPO73304DX oscilloscope (4-Ch), a Q-factor of 20 dB is achievable at 40 GBaud | X | X |
| Decision Threshold Q-plot | Displays BER vs. decision threshold for each eye opening. The Q value at optimum decision threshold is the Q-factor | X | X |
| Signal Spectrum and Laser Spectrum | Display of signal electric field vs. time in the complex plane FFT of power signal or laser phase noise | X | |
| MATLAB Window | Commands may be entered that execute each time signals are acquired and processed | X | X |
| Measurements vs. Time | Pre-defined measurement vs. time measurements include Optical field, symbol-center values, errors, and averaged waveforms. Any parameter can be plotted vs. time using a custom-created MATLAB expression | X | X |
| 3D Measurements | 3D Eye (complex field values vs. time), and 3D Poincaré Sphere for symbol and tributary polarization display | X | |
| Differential Eye Diagram Display | Balanced or single-ended balanced detection is emulated and displayed in the Differential Eye Diagram | X | |
| Frequency Offset | Frequency offset between signal and reference lasers is displayed in Measurement panel | X | |
| Poincarè Sphere | Polarizations of the Pol-muxed signal tributaries are tracked and displayed on the Poincaré Sphere. PER is measured | X | X |
| Signal Quality | EVM, Q-factor, and mask violations | X | X |
| Tributary Skew | A time offset for each tributary is reported in the Measurement panel | X | X |
| CD Compensation | No intrinsic limit for offline processing – FIR-based filter to remove CD in frequency domain based on a given dispersion value | X | |
| PMD Measurement | PMD values are displayed in the Measurement panel for Polarization-multiplexed formats with a user-specified number of PMD orders | X | |
| Oscilloscope and/or Cable Delay Compensation | The OMA software corrects cable, oscilloscope, and receiver skew through interpolation. Additional cable adjustment is available using the oscilloscope UI | ±0.5 ns | |
| Oscilloscope Skew Adjustment | Equivalent-time oscilloscope skew is adjusted using the "Delay" feature in the supported sampling head plug-ins | ±100% | |
| Calibration Routines | Receiver Skew, DC Offset, and Path Gain Mismatch Hybrid angle and state of polarization are factory calibrated | X | X |
| Data Export Formats | MATLAB (other formats available through MATLAB or ATE interface); PNG | X | X |
| Raw Data Replay with Different Parameter Setting | Movie mode and reprocessing | X | X |
| Bit Error Ratio Measurements | Number of counted bits/symbols | X | X |
| Number or errors detected | X | X | |
| Bit error ratio | X | X | |
| Differential-detection errors | X | X | |
| Save acquisition on detected error | X | X | |
| Offline Processing | Run software on a separate PC or on the oscilloscope | X | X |
| Coherent Eye Diagram | Shows the In-Phase or Quadrature components vs. time modulo two bit periods. | X | X |
| Power Eye Diagram | Shows the computed power per polarization vs time modulo 2 bit periods. | X | X |
The OM4200 series is part of a complete coherent optical test system
Tektronix is the only test and measurement vendor that can offer a complete coherent optical test system from signal generation, to modulation, acquisition, and analysis.
Specifications
All specifications are typical unless noted otherwise.
Optical modulation analyzer
- Maximum detectable baud rate (assuming "raised-cosine" pulse shape, where Bandwidth Required = Baud Rate * (1+Alpha)/2, using an Alpha of 0.1)
- OM4245:
80 GBaud with Tektronix DPS77004SX, using 70 GHz inputs
60 GBaud with Tektronix DPS77004SX, using 33 GHz inputs
OM4225:
45 GBaud with Tektronix DPO73304SX, using 33 GHz inputs
- Sample Rate
- 200 GS/s with Tektronix DPS77004SX
100 GS/s with Tektronix DPO73304SX
- EVM noise floor
- 1.8%
- O/E gain imbalance between I and Q
- 0.1 dB
- Available modulation formats
-
OOK, 3-state OOK, (PM) BPSK, (PM) QPSK, (PM) 8, 16, 32, 64-QAM, (PM) Offset QPSK, (PM) 8-PSK, 2ASK2PSK, and PAM4
Any PRBS or user-supplied pattern
Contact factory for new modulation formats
- Control
- Built-in Ethernet interface
- X, Y I/Q Connectors
- 2.4 mm, 50 Ω, output only
OM4200 series coherent receiver
- Optical input
-
C-band: 1530 to 1567.5 nm
C- and L-band: 1530 to 1600 nm (Optional)
- Maximum input power
- Signal input: +10 dBm
Reference input: +16 dBm
- Maximum input power damage level
- +18 dBm
- Electrical bandwidth
- OM4245: 45 GHz
OM4225: 25 GHz
- Optical phase angle of IQ mixer after correction
- 90° ±1°
- Skew after correction
- ±1 ps
External local oscillator input
- Optical input wavelength range
- C-band: 1530 to 1567.5 nm
L-band: 1570 to 1600 nm (Optional)
- Suggested external local oscillator input power range
- +7 dBm to +16 dBm
- Maximum input peak power (damage level)
- +18 dBm
- Instantaneous linewidth
Local oscillator
- Wavelength range
- C-band: 1527.6 to 1567.5 nm
C- and L- band: 1567.5 to 1609.6 nm (optional)
- Output power
- >14.5 dBm
- Minimum wavelength step
- 10 GHz
- Minimum frequency step
- 100 MHz
- Absolute wavelength accuracy
- 10 pm
- Linewidth (short term)
- 100 kHz
- Sidemode suppression ratio
- 55 dB
High-resolution spectrometer
- Maximum frequency span
- LO frequency ± oscilloscope bandwidth (instantaneous)
1530 to 1600 nm (using Option MCS and Option CL)
- LO Wavelength Range
-
C-band: 1530 to 1567.5 nm
C- and L-band: 1530 to 1600 nm
- Number of FFT points
- 1 million
- Minimum RBW
- 1/maximum oscilloscope time window
- Frequency accuracy
- 10 pm
Software requirements
Supported platforms for the OM4200 software:
- Computer with nVidia graphics card running US Microsoft Windows 7 64-bit and MATLAB 2011b (64-bit) or MATLAB 2014a (64-bit)
- Computer with nVidia graphics card running US Microsoft Windows 7 32-bit and MATLAB 2009a (32-bit)
The following platforms are supported but may not be able to use certain advanced graphics features such as color grade and 3D:
- Tektronix 70000 Series oscilloscopes running Microsoft Windows 7 64-bit and MATLAB 2011b (64-bit)
- Computer with non-nVidia graphics running US Microsoft Windows 7 64-bit and MATLAB 2011b (64-bit)
- Computer with non-nVidia graphics running US Microsoft Windows 7 32-bit and MATLAB 2009a (32-bit)
Please check with Tektronix when ordering for the most up-to-date requirements including support for the latest releases of MATLAB software.
Please contact Tektronix for a price quote or to arrange a demonstration. All product descriptions and specifications are subject to change without notice.
Power requirements
- Power requirements
-
100/115/230 V AC, ~50 to 60 Hz, 1 power cable, max. 100 VA
Physical characteristics
- Dimension
-
- Height
- 1.96 in. (49.8 mm) with feet
1.7 in. (43.2 mm) without feet
- Width
- 17.27 in. (438.7 mm)
- Depth
- 20.78 in. (527.8 mm) not including connectors and rear feet
21.98 in. (558.3 mm) including connectors and rear feet
- Weight
-
- Net
- 10.6 lb. (4.8 kg)
- Shipping
- 17.5 lb. (7.9 kg)
Environmental characteristics (does not include oscilloscope)
- Temperature
-
- Operating
- +10 °C +35 °C (50 °F to 95 °F)
- Storage
- –20 °C to +60 °C (-4 °F to 140 °F), noncondensing humidity
- Humidity
- 15% to 80% relative humidity, noncondensing
CAUTION
This device is a Class 1M laser product for use only under the recommended operating conditions and ratings specified in the data sheet. Use of controls or adjustments or performance of procedures other than those specified in the data sheet may result in hazardous radiation exposure.
Invisible laser radiation – Do not view the laser output from this device directly with optical instruments.
This device complies with 21CFR1040.10 except for deviations pursuant to Laser Notice No. 50, dated June 24, 2007.

Ordering information
Models
| Model | Option | Description |
Receiver bandwidth |
C-band lasers included |
L-band lasers included |
Wavelength band |
|---|---|---|---|---|---|---|
| OM4245 | CC | 45 GHz Optical Modulation Analyzer | 45 GHz | 2 | 0 | 1530 to 1567.5 nm |
| OM4245 | CL | 45 GHz Optical Modulation Analyzer | 45 GHz | 1 | 1 | 1530 to 1600 nm |
| OM4225 | CC | 25 GHz Optical Modulation Analyzer | 25 GHz | 2 | 0 | 1530 to 1567.5 nm |
| OM4225 | CL | 25 GHz Optical Modulation Analyzer | 25 GHz | 1 | 1 | 1530 to 1600 nm |
Recommended configurations
| Oscilloscope type | Receiver model | Receiver options |
Receiver bandwidth |
Recommended oscilloscope model |
Oscilloscope bandwidth |
|---|---|---|---|---|---|
| Real-time | OM4245 | Recommended: Opt. CC, Opt. QAM, OMINSTALL | 45 GHz | DPS77004SX | 70 GHz |
| OM4225 | Recommended: Opt. CC, Opt. QAM, OMINSTALL | 25 GHz | DPO73304SX | 33 GHz | |
| Equivalent-time | OM4245 | Required: Opt. EXT Recommended: Opt. CC, Opt. QAM, OMINSTALL | 45 GHz | DSA8300 with Opt. ADVTRIG and 2 each 80E11 | 70 GHz |
| OM4225 | Required: Opt. EXT Recommended: Opt. CC, Opt. QAM, OMINSTALL | 25 GHz | DSA8300 with Opt. ADVTRIG and 2 each 80E11 | 70 GHz |
OM1106 Optical Modulation Analysis Software
A stand-alone software-only tool that can perform all the data acquisition, analyses, filtering, and display of the Tektronix OM series instruments using the customer’s polarization-diverse coherent receiver. This software is included with the OM4225 and OM4245.
OM2210 Coherent Receiver calibration source
You can use the OM2210 to maintain calibration of Tektronix OMA series hardware or to characterize 3rd-party receivers. See the Tektronix OM2210 data sheet for more information.
Instrument options
OM4245 options
- OM4245
-
45 GHz Optical Modulation Signal Analyzer (requires choice of lasers)
- OM4245 CC
- C-band lasers (receiver tested over C-band)
- OM4245 CL
-
Coupled C- and L-band lasers (receiver calibrated over Cand L-band)
- OM4245 EXT
- Adds external connections for reference laser
- OM4245 QAM
- Adds QAM and other software demodulators
- OM4245 MCS
- Adds multi-carrier superchannel support
OM4225 options
- OM4225
-
25 GHz Optical Modulation Signal Analyzer (requires choice of lasers)
- OM4225 CC
- C-band lasers (receiver tested over C-band)
- OM4225 CL
-
Coupled C- and L-band lasers (receiver calibrated over Cand L-band)
- OM4225 EXT
- Adds external connections for reference laser
- OM4225 QAM
- Adds QAM and other software demodulators
- OM4225 MCS
- Adds multi-carrier superchannel support
OM1106 options
- OM1106
- Optical Modulation Analyzer Software only
- OM1106 QAM
- Adds QAM and other software demodulators
- OM1106 MCS
- Adds multi-carrier superchannel support
OM1106 software upgrade options
- OM11UP QAM
- Adds QAM and other software demodulators
- OM11UP MCS
- Adds multi-carrier superchannel support
Power plug options
- Opt. A0
- North America power plug (115 V, 60 Hz)
- Opt. A1
- Universal Euro power plug (220 V, 50 Hz)
- Opt. A2
- United Kingdom power plug (240 V, 50 Hz)
- Opt. A3
- Australia power plug (240 V, 50 Hz)
- Opt. A5
- Switzerland power plug (220 V, 50 Hz)
- Opt. A6
- Japan power plug (100 V, 50/60 Hz)
- Opt. A10
- China power plug (50 Hz)
- Opt. A11
- India power plug (50 Hz)
- Opt. A12
- Brazil power plug (60 Hz)
User manual options
- Opt. L0
- English manual
Service options
- Opt. C3
- Calibration Service 3 Years
- Opt. C5
- Calibration Service 5 Years
- Opt. R3
- Repair Service 3 Years (including warranty)
- Opt. R5
- Repair Service 5 Years (including warranty)
Standard accessories
OM4200 series standard accessories
- OM4200 Series Optical Modulation Analyzer Installation and Safety Instructions
- 071-3414-xx
- Power cord
- Type depends on ordered power cord option
- RF Cable 2.4 mm to 2.92mm (4)
- OMCABLE33G8
- Ethernet cable
- 174-6230-xx
- Patch Cord Fiber, 8" (Opt. EXT)
- 174-6231-xx
- Programmed HASP key (USB)
- 650-5642-xx
- Programmed USB Flash Drive (Software, manuals)
- 650-5643-xx
Calibration and warranty
- Calibration interval
- 1 year
- Warranty
- 1 year
Accessories
Recommended accessories
- OMCABLE33G8
- 2.4 mm to 2.92 mm, 8” long, 33 GHz
- OMCABLE45G8
- 2.4 mm to 2.4 mm 8” long, 45 GHz
- OMCABLE45G14
- 2.4 mm to 2.4 mm, 14” long, 45 GHz
- OMDONGLE
-
Replacement OM license dongle (requires software license key number)
- OMTRAIN
- On-site training and/or installation for OMxxxx products
- OMADDLSW
-
Additional set of Optical Modulation Analyzer Software (requires OM4000 or OM4200 instrument serial number)
- OMINSTALL AMR
- On-site OM-series install for the Americas
- OMINSTALL JPN
- On-site OM-series install for Japan
- OMINSTALL EMEA
- On-site OM-series install for Europe, Middle East, and Africa
- OMINSTALL APAC
- On-site OM-series install for Asia Pacific
Related products
- OM5110
- 46 GBaud Multi-Format Optical Transmitter
- OM2210
- Coherent Receiver Calibration Source
- OM2012
- Tunable Laser Source
- OM1106
- Optical Modulation Analysis Software (included with the OM4200 series instruments)


