1.Introduction
AC to DC power supplies are fully integrated into our daily lives. They are the heart of all our electronics, providing energy for the everyday devices that we rely on. A cell phone charger is a power supply, but so are the power electronic circuits embedded inside almost any electronics or appliance connected to the AC line. This near universal use of power supplies means that although the power that each individual supply draws is small, the cumulative effects are very significant. For this reason it is desirable, and often required by regulation, to control power supply characteristics such as efficiency.
AC –DC Power supplies convert electrical energy from their AC line input to provide DC outputs that are:
- Isolated from the dangerous high-voltage, high-capacity AC line.
- Smoothed and low-noise DC voltage.
- Regulated to be largely independent of input voltage changes.
- Current controlled to avoid damage to the load (especially batteries) and to the power supply itself
Typically, an AC to DC power supply converts the AC line (110 220V 50/60Hz) into low voltage (12, 5, 3V) DC.
Power supply designers strive to improve the efficiency of their designs while maintaining specified performance over a range of input and load conditions and complying with demanding international regulations for harmonic current content, standby power, safety and EMC.
This application note is intended to assist engineers who design and test power supplies and other equipment connected to the AC line make power related measurements accurately, quickly and safely.
2. Power Supply Measurements Essential Background
AC Power is the product of RMS input voltage, RMS input current and power factor.
The power supply input voltage is the normal AC line in most cases and its shape is near sine-wave with low distortion.
The input current may be highly distorted and rich in harmonic content.
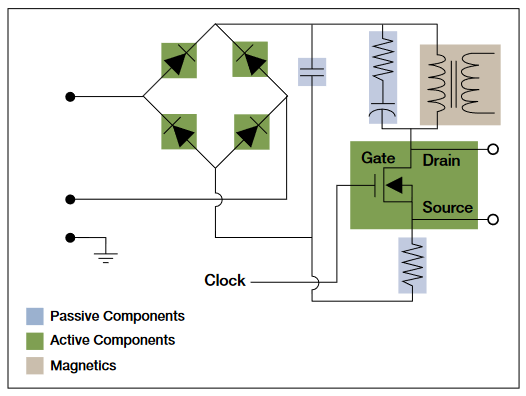
Most power supplies have input circuits consisting of arectifier followed by a smoothing capacitor to produce a high voltage DC. The capacitor maintains the DC voltage when the AC line input voltage is falling and is charged only when the AC voltage is higher than the DC ‘bus’ voltage. The AC input current is thus no sine wave, but only flows near the peak of the voltage sinewave.
An example of a typical switch mode power supply is shown in Figure 1. Figure 2 shows typical input waveforms of a power supply.
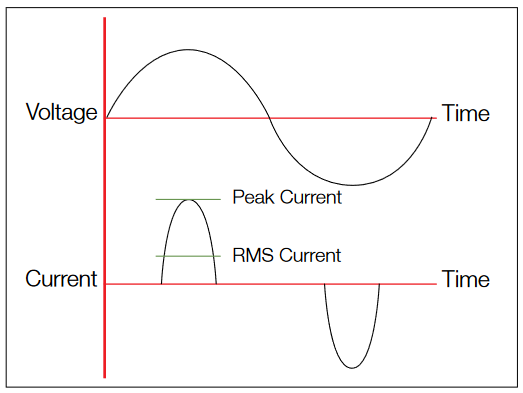
This distorted current increases the RMS current drawn from the AC line, but does no useful work and does not contribute to the real power (watts) drawn or used by the power supply.
This extra, wasted current, multiplied up by the millions of power supplies in use means that the the AC supply and distribution system must be larger than required to supply the necessary power (watts) and that power is wasted providing the excess current by resistive losses in the transmission and distribution system.
This is one reason why the current distortion drawn by power supplies is limited by international regulations such as IEC61000-3-2.
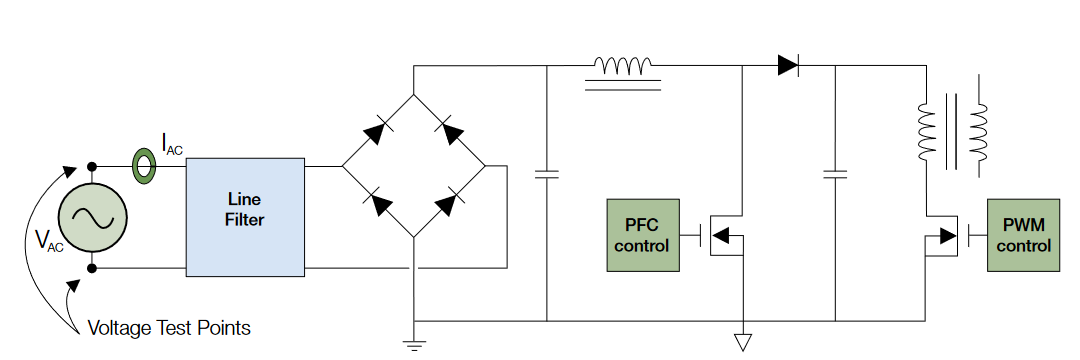
Most modern power supply designs mitigate this problem by employing some form of wave shaping circuit on their input, often called a (PFC) Power Factor Correction circuit. An example of PFC implementation is shown in Figure 3. These circuits help shape the input current such that the input impedance of the power supply appears fairly linear to the power line, similar to a resistive load. By doing so, the problems of distorted input current waveforms can be significantly improved. Another key issue, most designers face today is measuring and certifying energy consumption and efficiency on their class of device to comply with institutions like ENERGY STAR™ and CEC.
In order to satisfy these requirements for low input current distortion and harmonics, high efficiency and low average and standby power consumption its important to understand how to measure them in accordance with internationally accepted practice.
3. Critical Power Supply Measurements
It's important for a power supply designer to keep check of all these parameters that are so crucial to a power supply’s performance proper operation and compliance to specification. Some of the most important power measurements a designer has to make are listed as follows:
4. Making Power Supply Input Measurements Using a Tektronix – PA1000
Tektronix PA1000 is a single channel high precision Power Analyzer that helps makes complex power measurements on a power supply very easy. This section will discuss a practical example of making power supply input measurements on a typical power supply. The DUT (Device under test) for this example is a generic laptop charger.
Wiring:
The standard current inputs of a power analyzer will measure a large range of current, from milli-amps to 20 or 30 amps RMS. This is suitable for most power supplies up to 3kW.
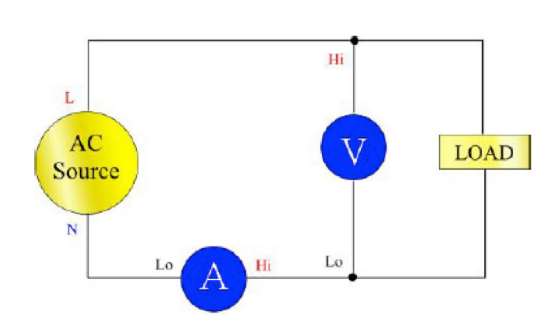
A single power analyzer wattmeter input channel consists of a voltage input pair (VHI and VLO) and a current input pair (AHI and ALO).
These connections are simplified by use of a break-out box that makes the analyzer connections with 4mm safety connectors and provides a standard AC outlet for connection to the power supply. Make the connections as shown in the Figure 5.
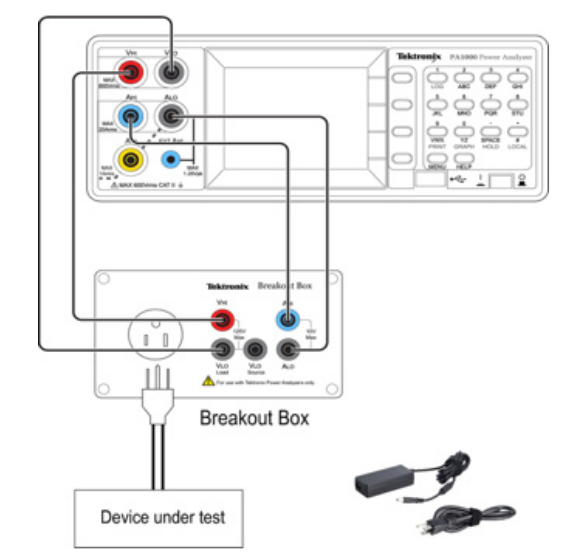
Connect the PA1000 and breakout box using the color coded safety-banana lead set as seen in picture
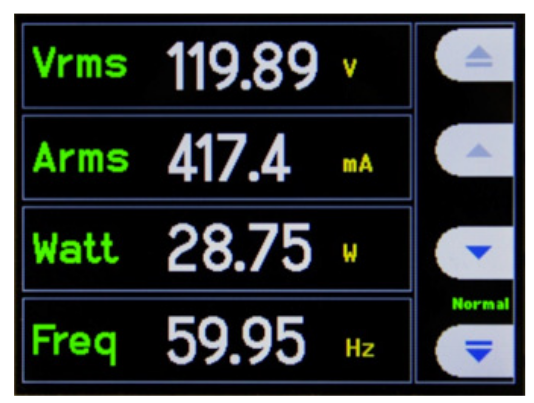
For this example a generic laptop charger was plugged in the AC socket on the breakout box and allowed to charge a laptop
PA1000 will start displaying results as soon as everything is plugged in and powered on as shown in Figure 6
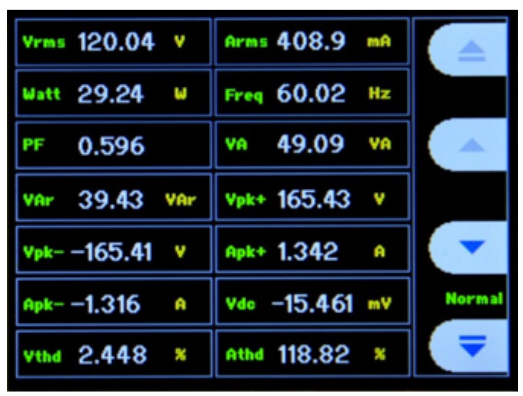
To view more parameters press the "Menu" button on the front panel and navigate to "Measurements" as shown in Figure 8
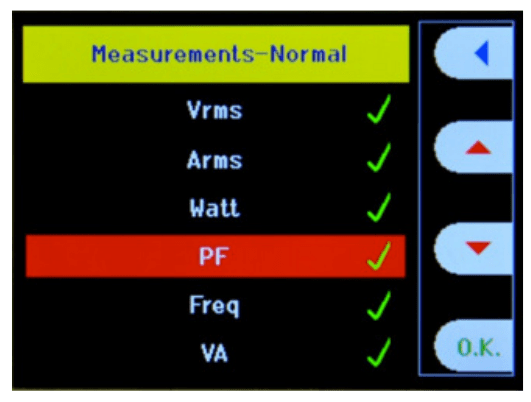
Options available include crest factors, power factor, current and voltage harmonics, THD, active and reactive power and many more. Please refer to the user manual for the list of all available measurements
Figure 9 shows an example of some of these measurements on the display.
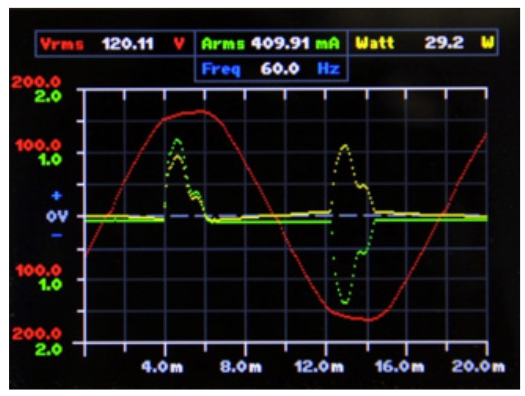
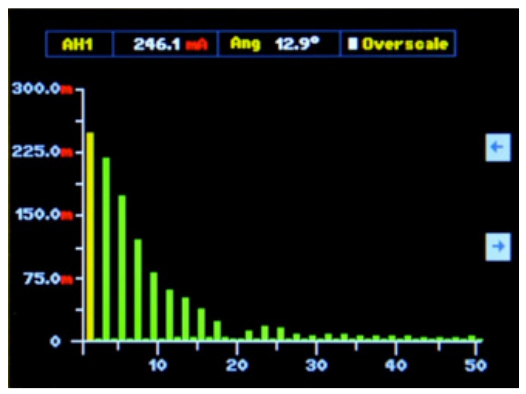
Voltage, current and power waveforms and harmonic bar charts can also be viewed as seen in following Figure 10 and Figure 11 respectively by pressing the Graph button or accessing the Graph Menu.
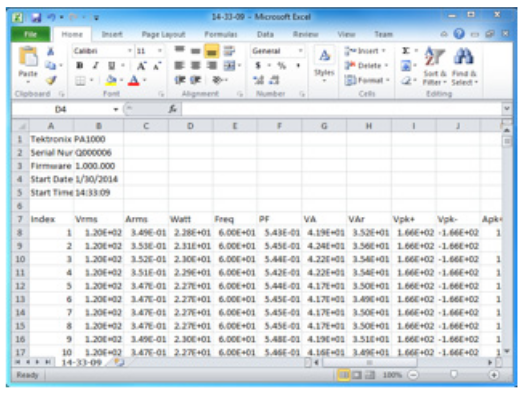
One of the important features that most of the power supply designers and testing labs need is ability to log data efficiently over extended periods of time.
PA1000 provides a standard USB port on the front panel for data logging which can be very handy for performing extended testing.
The test results can be exported as an excel file and used for presentation or analysis as shown in the Figure 12.
The best and the most convenient way to test power supply is to use the included PWRVIEW software.
5. PWRVIEW Software
PWRVIEW software compliments Tektronix Power Analyzers and is available as free download on Tektronix website.
PWRVIEW offers easy, wizard-driven test solutions for power supply, standby power and many other target applications
For download and installation info go to www.tek.com/power-analyzer-series/pa1000
Features:
Tektronix Power Analyzers remote operation
Transfer, view, analyze, record and export measurement data in real-time from the instrument, including waveforms, harmonic bar charts, and stand power trend charts.
Default applications and standard compliance tests
Figure 13 shows the screen shot of PWRVIEW PC software
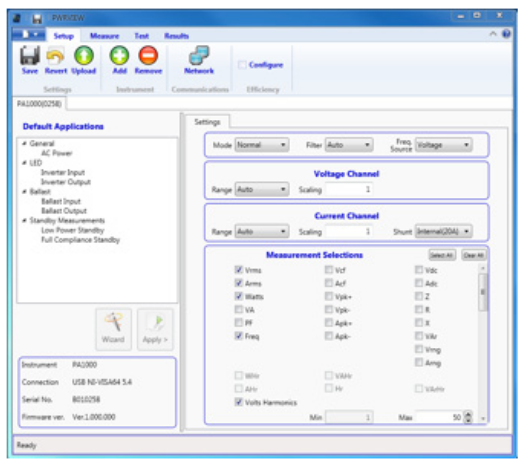
PWRVIEW makes is very easy to monitor, record and analyze the critical power measurement that have been discussed earlier
The following section will demonstrate how to make efficiency measurements using two PA1000 using PWRVIEW software.
6. Power Supply Efficiency Measurements
Two wattmeter channels are required for performing the efficiency measurements. Either a multichannel Power Analyzer like PA4000 or two PA1000 connected with PWRVIEW can do the job. Two PA1000’s are used for this example to demonstrate efficiency measurements on a power supply.

Connect two PA1000’s, one on input and one on output of the power supply under test making connections as demonstrated earlier.
Connect both PA’s to the computer via USB, Ethernet or GPIB and add them to PWRVIEW.
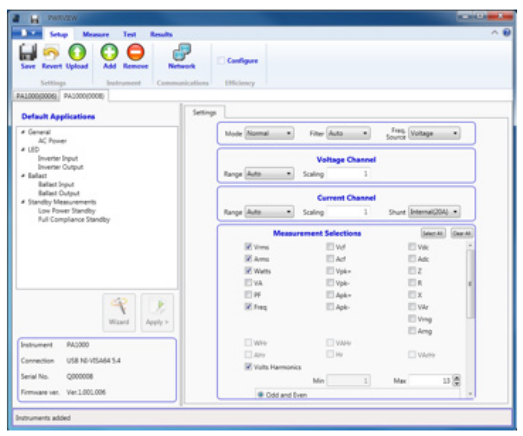
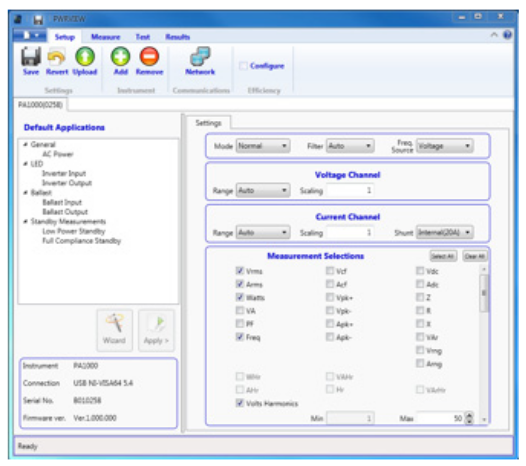
Once added, PWRVIEW will display two tabs for two Power Analyzers connected as shown in Figure 14.
For calculating efficiency, just click on the Configure radio tab on the top ribbon.
This will open a new tab for input and output selection as shown in Figure 15.
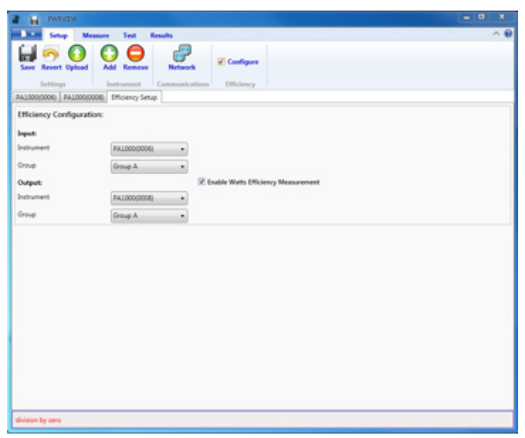
Once proper groups are selected for input and output just click on the radio button – Enable Watts Efficiency Measurements.
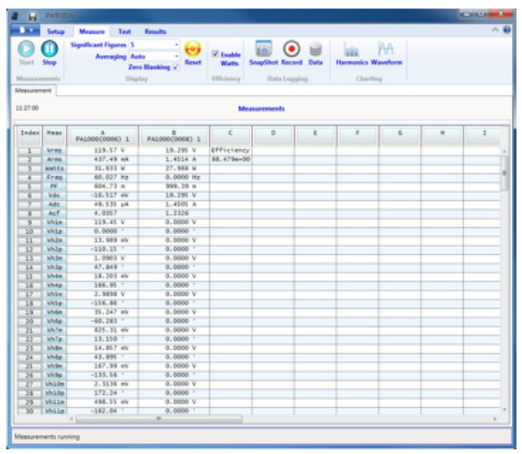
Once done, click on the Measure tab on the top and then click start on the Measure page.
The Measurement grid will start making efficiency measurement based on the input and output wattage as seen in the Figure 16.
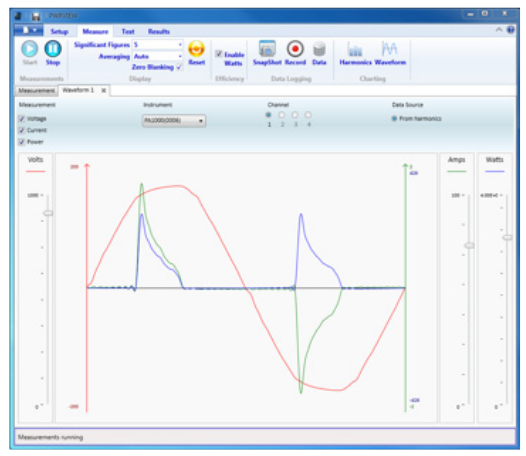
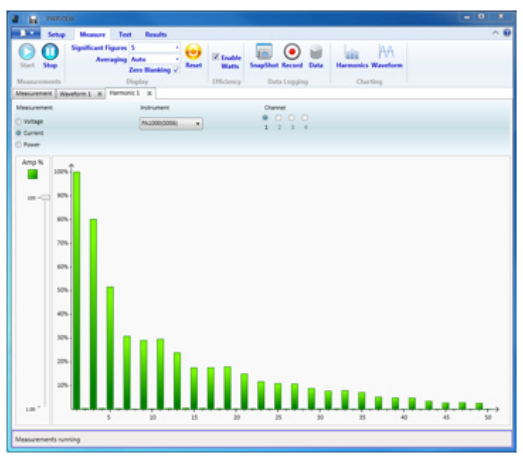
PWRVIEW can also be used to view waveforms and bar charts as shown in following Figure 17 and Figure 18 respectively.
7. Standby Power Compliance Tests
The power consumed by power supply while they are not loaded is called standby power.
The standby power is trivial when considered for individual power supplies but when equated as a whole over a longer period of time and considering the number of power supplies plugged in to sockets all the time, becomes a significant waste of energy
Many programs are already in place to reduce standby power including ENERGY STAR and the EU Eco Directive. The scope of these programs continues to grow and the level of standby power in Watts necessary to achieve compliance steadily falls.
PWRVIEW software offers engineers a straight forward and accurate tool to conduct a full-compliance standby power test and get to the market faster and cheaper.
Figure 19 shows a snapshot of a full compliance standby test in action.
For more details on standby power and full compliance stand by test, please refer to Standby Power app note on
Harmonics Limits
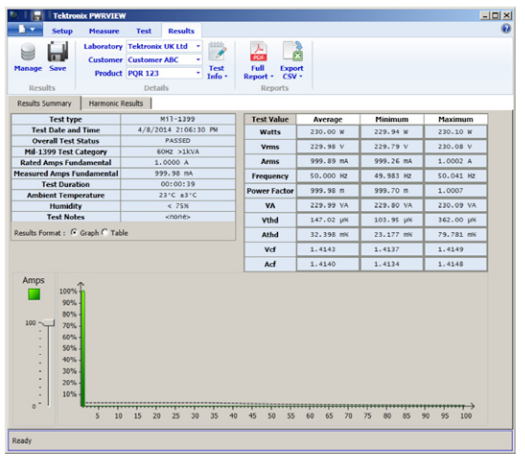
Using PC software coupled to the power analyzer, harmonics measurements may be quickly and conveniently recorded and compared to the limits of IEC61000-3-2 and others.
Software features such as PDF report export provide complete reporting functions for power supply conformance measurements.
8. Definitions
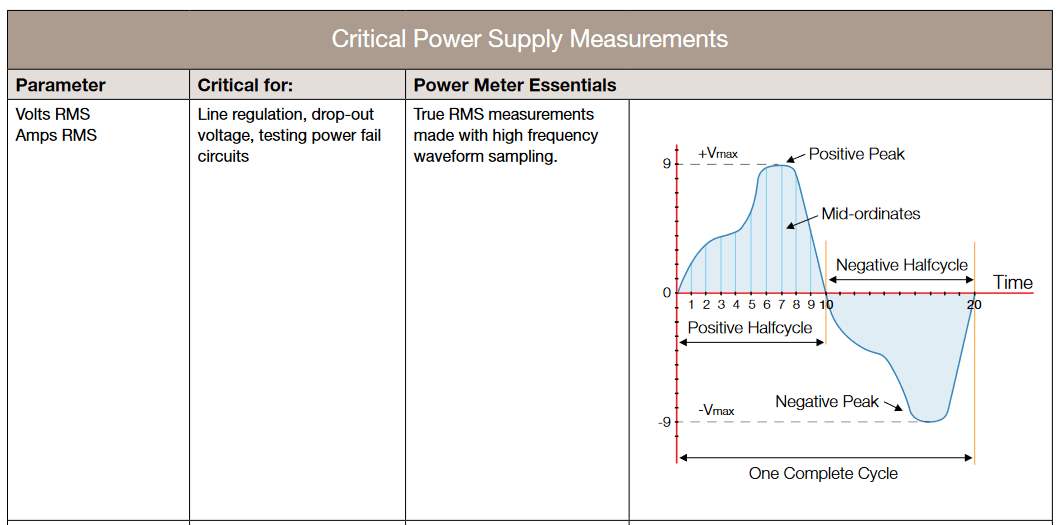
8.1. RMS (Root Mean Squared Value)
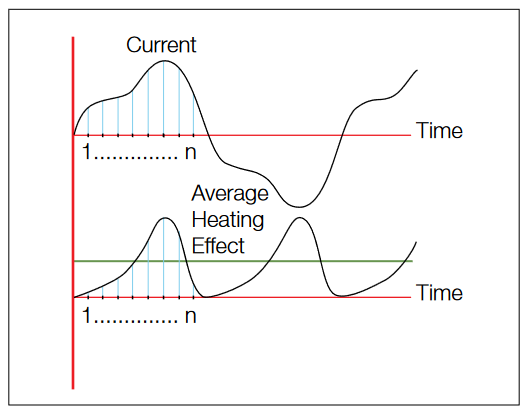
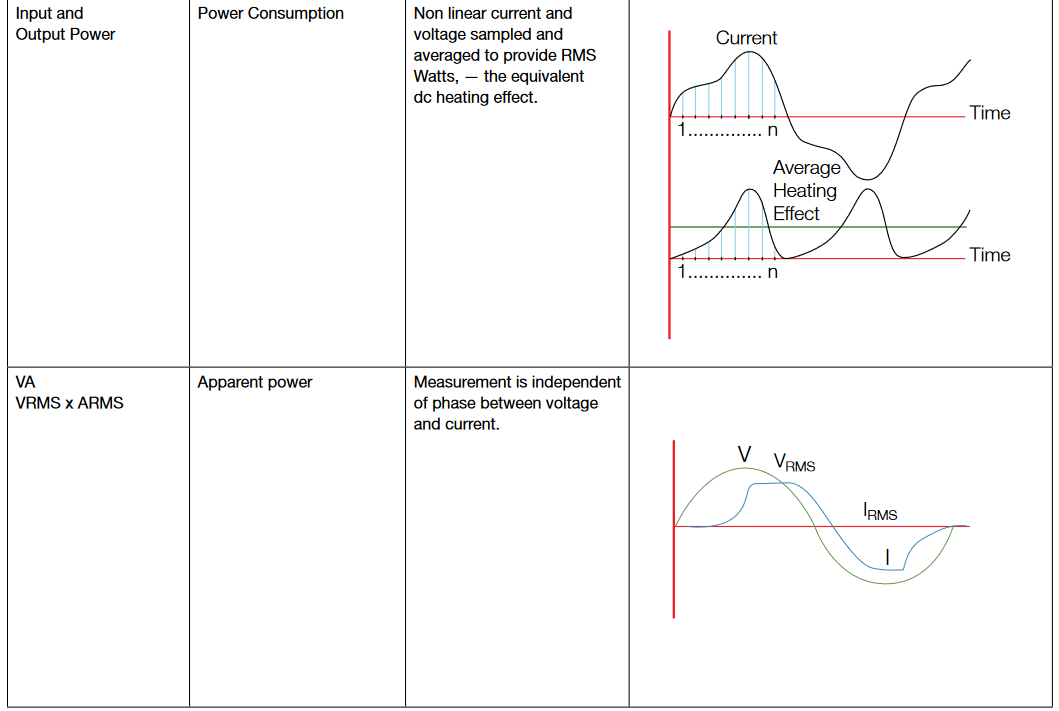
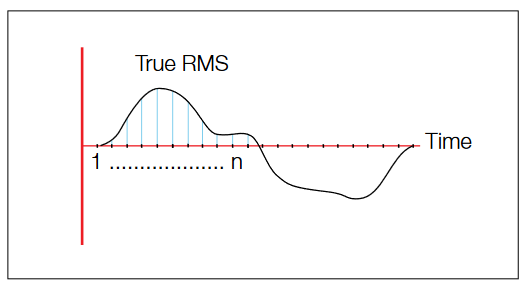
The RMS value is the most commonly used and useful means of specifying the value of both AC voltage and current. The RMS value of an AC waveform indicates the level of power that is available from that waveform and is equivalent DC at the same voltage. This is one of the most important attributes of any AC source. The calculation of an RMS value can best be described by considering an AC current waveform and its associated heating effect such as that shown in Figure 21.
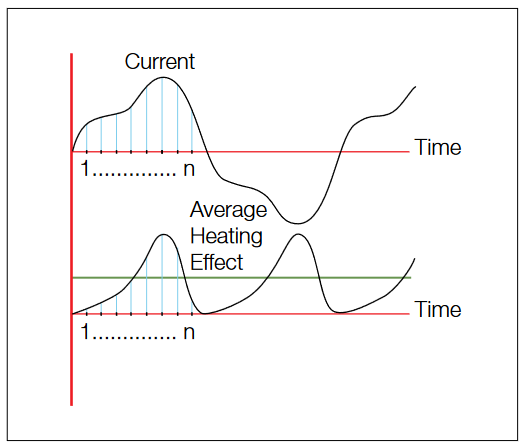
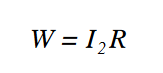
The current (Amp) is considered to be flowing through a resistance; the heating effect at any instant is given by the equation:
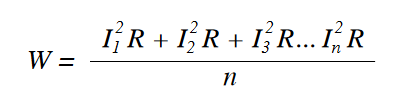
By dividing the current cycle into equally spaced coordinates (samples), the variation of the heating effect with time can be determined as shown in Figure 2 above. The average heating effect (power) is given by:
To determine the equivalent value of current that would produce the average heating effect value shown above, then the following applies:
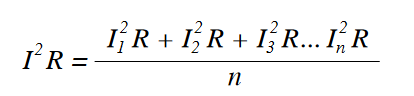
Therefore:
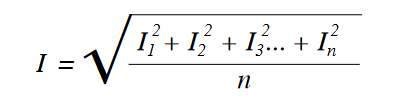
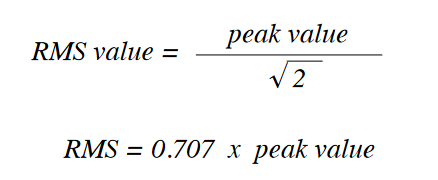
The RMS value of the current = the square root of the mean of the squares of the current. This value is often termed the effective value of the AC waveform, as it is equivalent to the direct current that produces the same heating effect (power) in the resistive load. It is worth noting that for a sinusoidal waveform:
8.2 Average Value
The average value of a waveform such as that shown in Figure 22 is given by:
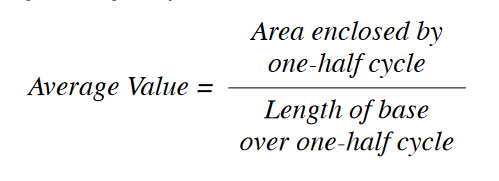
It is clear the average value can only have real meaning over one half cycle of the Waveform, for a symmetrical waveform, the mean or average value over a complete cycle is zero. Most simple multi-meters determine AC values by full-wave rectification of the AC waveform, followed by a calculation of the mean value. Such meters; however, will be calibrated in RMS and will make use of the known relationship between RMS and average for a sinusoidal waveform, i.e.
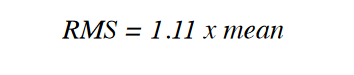
However, for waveforms other than a pure sine wave, the readings from such meters will be invalid. RMS values will need to be calculated using techniques shown in Figure 22.
8.3 Real and Apparent Power (W & VA)
A sinusoidal voltage source of, say, 100V RMS is connected to a resistive load of, say, 100Ω, then the voltage and current can be depicted as in Figure 23 and are said to be "in phase". The power that flows from the supply to the load at any instant is given by the value of the product of the voltage and the current at that instant, as illustrated in Figure 23.
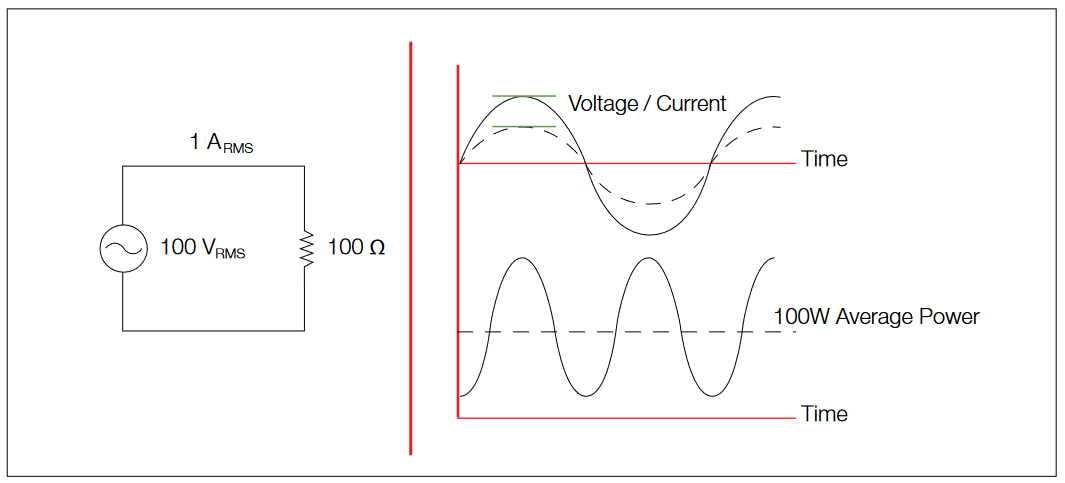
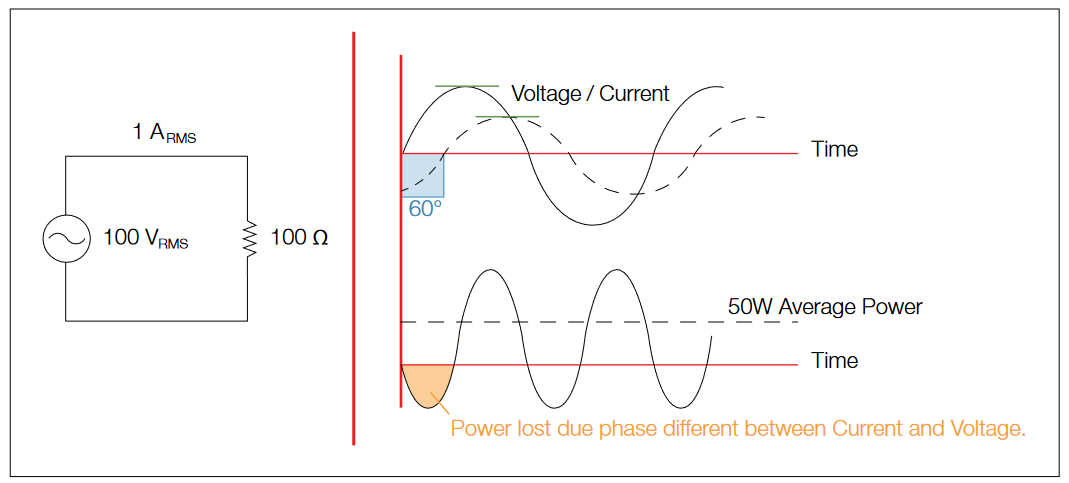
From this, it can be seen that the power flowing into the load fluctuates (at twice the supply frequency) between 0 and 200W and that the average power delivered to the load equals 100W which is what one might expect from 100V RMS and a resistance of 100 Ω. However, if the load is reactive (i.e. contains inductance or capacitance as well as resistance) with an impedance of 100 Ω, then the current that flows will still be 1A RMS but will no longer be in-phase with the voltage. This is shown in Figure 24 for an inductive load with the current lagging by 60 degrees. Although the power flow continues to fluctuate at twice the supply frequency, it now flows from the supply to the load during only a part of each half cycle—during the remaining part, it actually flows from the load to the supply. The average net flow into the load, therefore, is much smaller than in the case of a resistive load as shown in Figure 23— with only 50W of useful powering delivered into the inductive load.
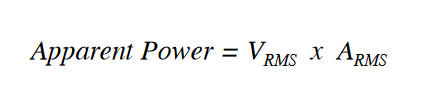
In both of the above cases the RMS voltage was equal to 100V RMS and the current was 1A RMS. The product of these two values is the apparent power delivered into the load and is measured in VA as follows:
The real power delivered has been shown to depend on the nature of the load. It is not possible to determine the value of real power from the knowledge of RMS voltage and the use of a true AC power meter, capable of computing the product of the instantaneous voltage and current values and displaying the mean of the result is required. VA is often measured to ensure that the ac supply has sufficient capacity.
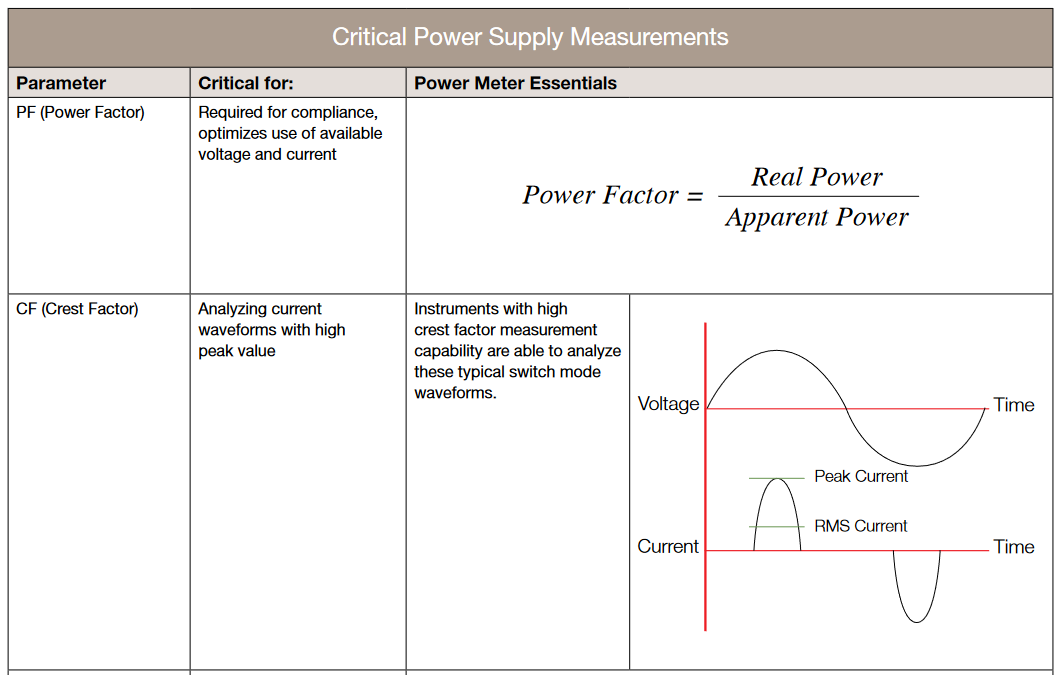
8.4 Power Factor
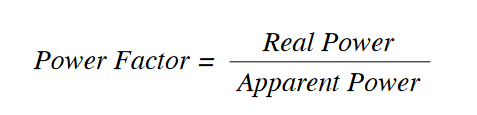
It is clear that, in comparison with DC systems, the transferred AC power is not simply the product of the voltage and current values. A further element, known as the power factor must also be taken into consideration. In the previous example (real and apparent power) with an inductive load, the power factor is 0.5 because the useful power is exactly one half of the apparent power. We can therefore define power factor as:
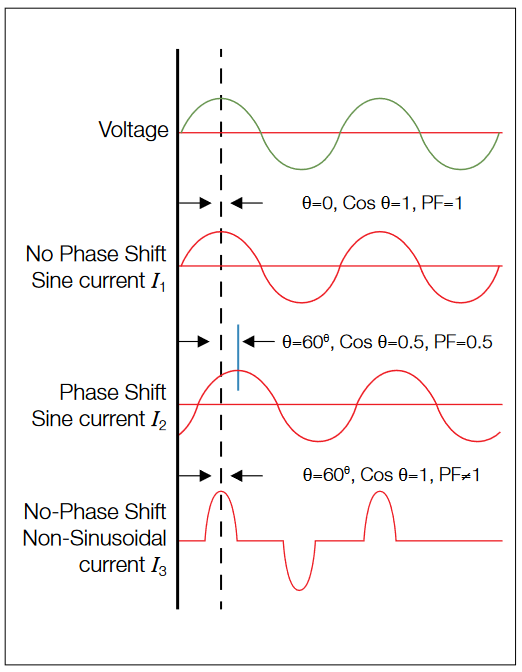
In the case of sinusoidal voltage and current waveforms, the power factor is actually equal to the cosine of the phase angle (q) between the voltage and current waveforms. For example, with the inductive load described earlier, the current lags the voltage by 60 degrees.
Therefore:
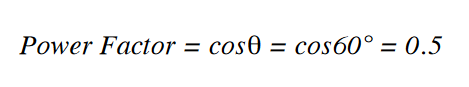
It is for this reason that power factor is often referred to as cosq. However, it is important to remember that this is only the case when both voltage and current are sinusoidal [Figure 24 (I1 and I2)] and that power factor is not equal to cosq in any other case [Figure 24 (I3)]. This must be remembered when using a power factor meter that reads cosq, as the reading will not be valid except for pure sinusoidal voltage and current waveforms. A true power factor meter will compute the ratio of real to apparent power as described in section discussing real and apparent power.
Tektronix power analyzer retains high accuracy even at very low power factor, which is very important for product characterization and development.
8.5 Crest Factor
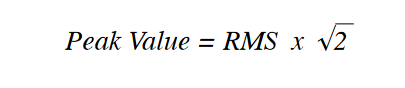
Tektronix power analyzers can measure a high Crest Factor (~10). This is critical for characterization of switched mode power supplies, which usually have high peak current draw. It has already been shown that for a sinusoidal waveform:
The relationship between peak and RMS is known as the crest factor and is defined as:
Thus, for a sinusoid:

Many items of modern equipment connected to the AC supply take non-sinusoidal current waveforms. These include power supplies, lamp dimmers, and even fluorescent lamps. Power supplies can often exhibit a current crest factor of around 4 and up to 10.
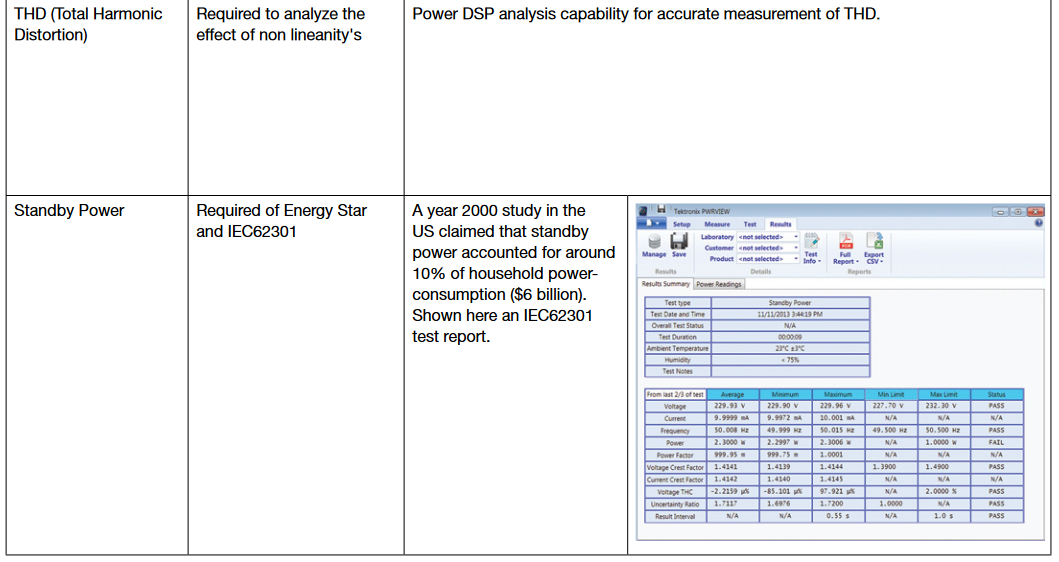
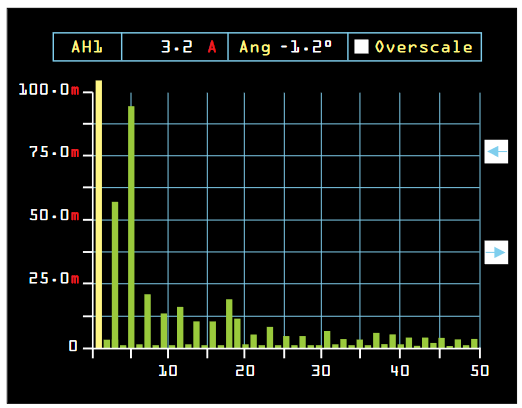
8.6 Harmonic Distortion
If a load introduces distortion of the current waveform, it is useful, in addition to knowing the crest factor, to quantify the level of distortion of the wave shape. Observation on an oscilloscope will indicate distortion but not the level of distortion. It can be shown by Fourier analysis that a nonsinusoidal current waveform consists of a fundamental component at the supply frequency plus a series of harmonics (i.e.) components at frequencies that are integral multiples of the supply frequency). For example, a SMPS, a lamp dimmer or even a speed-controlled washing machine motor can contain harmonics of even greater significance as shown in Figure 25.
The only useful current is the fundamental component of current, as it is only this that can generate useful power. The additional harmonic current not only flows within the power supply itself, but in all of the distribution cables, transformers and switchgear associated with the power supply and will thus cause additional loss. There is an increasing awareness of the need to limit the level of harmonics that equipment can produce. Controls exist in many territories to provide mandatory limits on the level of harmonic current permitted for certain types of load. Such regulatory controls are becoming more widespread with the use of internationally recognized standards such as EN61000-3-2. Thus, there is a need for an increased awareness amongst equipment designers as to whether their products generate harmonics and at what level. It is only the fundamental which generates power, harmonics in general do not.
8.7 Standby Power
Standby power is the power drawn by a power supply when its load is not performing its full function. This may be the power consumed just by the clock on a microwave oven or the power drawn by a laptop charger when the battery is fully charged.
To make the measurement requires not only very low measurement ranges, but special techniques to overcome the problems of power supplies operating in burst mode.
Tektronix power analyzers have both a quick 1-button standby mode for the designer and, together with PWRVIEW pc software will perform full compliance ENERGY STAR and IEC62310 Ed.2 standby power measurements. Please see our detailed application note on this subject.
9. Conclusion
Power and power related measurements on power supplies require sophisticated and accurate instrumentation to ensure that the power supply performs to its specification.
The Tektronix PA1000 power analyzer incorporates a wide range of advanced features that provide class-leading accuracy from mW to kW. With the PA1000, Power supply designers faced with the challenges of ever increasing efficiency and lower standby power requirements can always be confident that their designs meet specifications.