Introduction
The future of the Internet or the Internet of Things (IoT) is an interconnection of uniquely identifiable embedded devices often referred as IoT smart devices and sensors. A large number of sensor nodes each capable of sensing and wireless communication installed in an area of interest makes a wireless sensor network. Billions of smart sensors push data to the IoT through diverse applications, including home security systems; lighting and HVAC control; utility monitoring; industrial control and automation; bridge, railway, traffic light monitoring; and various other infrastructure and environmental uses. Despite the wide difference in applications, these sensor nodes share architecture similar to wireless IoT smart devices, such as those used in the medical, health, and fitness domains.
One of the most common challenges in all sensor node design is power management. Wireless sensor nodes are often placed in hard-to-reach locations where sourcing from mains power is either inconvenient or impossible. Designers need to closely examine the power consumption associated with different operational states of the microcontroller (MCU) and the transceiver of the wireless sensor node. In a typical sensor node application, a node might sit idle for long periods of time between peak periods of activity for sensor data acquisition and wireless transmission. In other words, the power profile consists of active peaks, that are represented by tens of milliamps at maximum transmit or receive power, and long idle periods, that are characterized by quiescent current as low as tens of nanoamps.
Power = I × V
Energy = I × V × Time
Until recently, no single instrument offered the combination of low current measurement range, resolution, and speed capability necessary for these applications. The Keithley Model DMM7510 7½-Digit Graphical Sampling Multimeter will fulfill this need. The Model DMM7510 has an 18-bit sampling A-to-D converter dedicated for digitizing current and voltage at 1Megasample per second. The digitizing functions cover the same measurement ranges as the DMM's traditional DC voltage and current functions. In other words, the instrument offers exceptional current measurement capability from 100pA to 10A with a 100kHz analog bandwidth that is suitable for both deep sleep as well as active current measurements. Although voltage is typically regulated in these applications, the Model DMM7510 is also capable of digitizing voltage from 1µV to 1000V and has a higher analog bandwidth of 600kHz. Combining the advanced waveform triggering mechanism, such as edge triggering, pulse triggering, and window triggering, you can easily capture, view, and interact with these dynamic signals on the Model DMM7510's multi-touch display
This application note provides an overview on how to characterize the ultra-low power consumption of a typical wireless sensor node application on the front panel of the Keithley Model DMM7510.
Evaluate a Single Current Pulse Profile
An accurate capture of the current waveform is critical for power consumption calculation and can be easily accomplished on the Model DMM7510. The first step is identifying a single trigger event associated with the current pulse waveform of interest. You can then use the built-in analog edge triggering mechanism on the Graph user interface to set up the trigger span, trigger slope, trigger level, trigger position, and sampling rate. With only a handful of keystrokes to establish these acquisition criteria, you can quickly view the desired waveform on the DMM's graphical display
Figure 1 illustrates a typical multi-level active mode current pulse captured by the Model DMM7510. The active mode typically contains current levels as high as tens of milliamps. These multiple current levels represent events such as start-up and shut-down sequences, transmit and receive modes, sensor data conversion, etc.
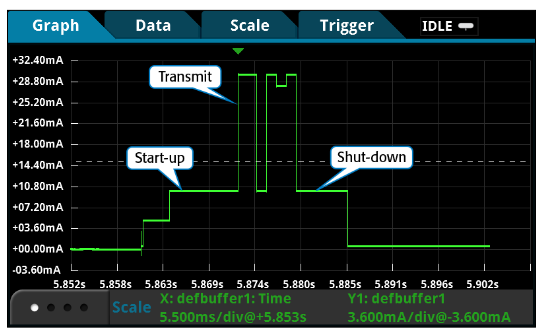
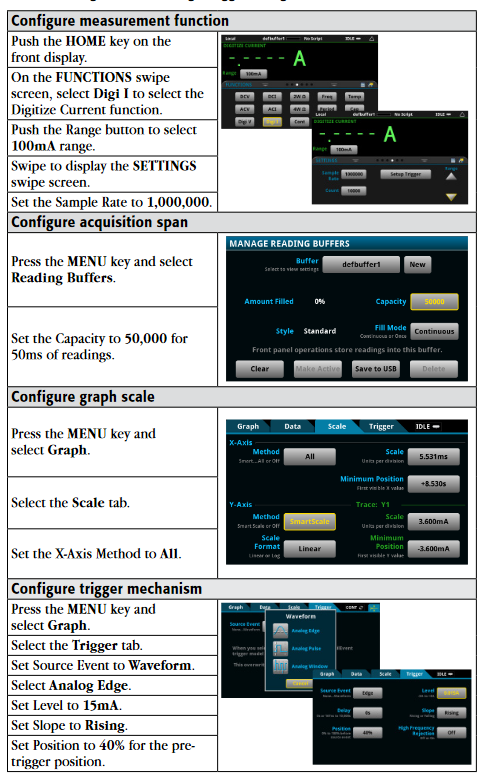
Table 1 summarizes the acquisition criteria involved in capturing the waveform in Figure 1. With the exception of the trigger mechanism configuration, which is only available when the measurement function is set to Digitize Current, you are not required to follow the exact sequence of operations listed in the table.
Press the front panel TRIGGER key to begin a single acquisition once all configurations are complete. The pre-trigger data acquisition starts immediately and is displayed on the graph. When the DMM detects a current level that satisfies the trigger condition, the acquisition continues until the completion of posttrigger readings.
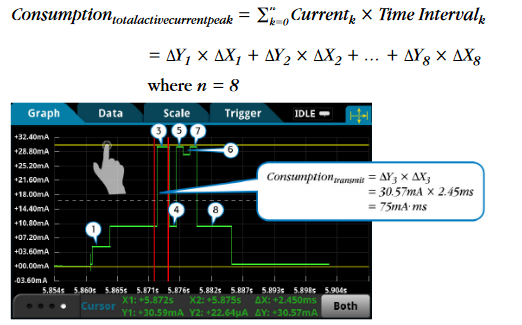
You can enable horizontal and vertical cursors to obtain the current over various time intervals. Figure 2 illustrates the cursor feature on the Model DMM7510. Press the MENU key and select Graph. Swipe the bottom of the graph screen until the Cursor enable button is displayed. Push the Cursor button repeatedly until Both is displayed. Push and drag the horizontal or vertical cursors across the waveform to measure current (∆Y) and the corresponding interval (∆X). As with most touchscreen technology, you can easily zoom and pan to any area on the display to position the cursors more accurately on the waveform. The total active current peak consumption in Figure 2 consists of eight segments. It can be calculated as:
Figures 1 and 2 both show a trigger position indicator (▼) and a trigger level control line. You can slide this dashed line up or down to adjust the trigger level and start another acquisition.
New developments in ultra-low power management have introduced a wide range of ultra-low power MCU families that implement more sophisticated strategies for limiting power consumption with several levels of low power modes. This results in finer levels of granularity beyond simply run or idle modes. For example, there are modes such as standby mode, doze mode, sleep mode, deep sleep mode, etc, with current levels often ranging from tens of microamps to as low as tens of nanoamps.
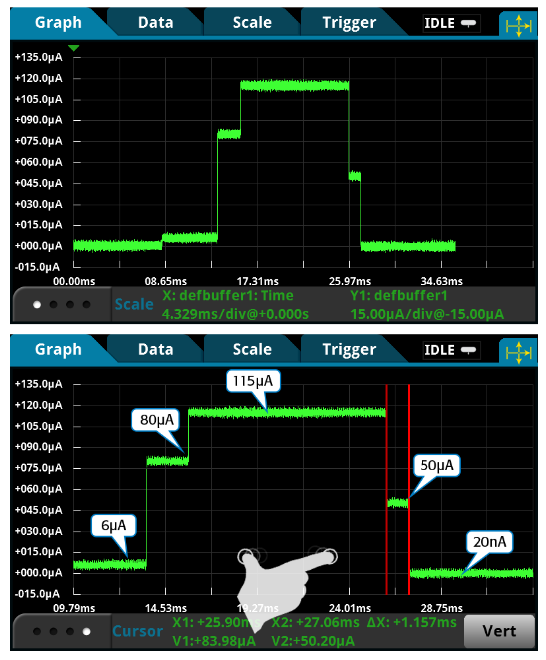
Figure 3 is an example of a multi-level idle mode current pulse waveform captured on the 100µA range. The Model DMM7510 is capable of resolving current below a few microamps.
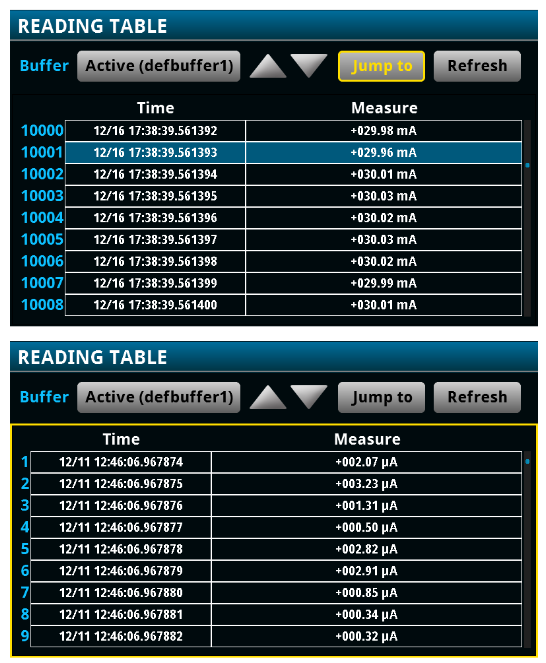
All readings and timestamps are easily accessible through the Reading Table under the main MENU. See Figure 4. To save these readings to a thumbdrive, insert a USB thumbdrive in the USB port on the front panel. Press the MENU key. Select Reading Buffers, press the desired buffer, and then press Save to USB. The data will be saved in the .csv format so it can later be downloaded and imported into a spreadsheet. TIP: Press the HOME and the ENTER keys on the front panel at the same time to save a screen capture to a USB thumb drive.
Observe Power Profile over a Period of Time
The Model DMM7510 is equipped with a large reading buffer that can store up to 27.5 million time-stamped readings. This is equivalent to 27.5 seconds of data acquired at 1Mega-sample per second. The large buffer allows you to view the sensor node operation over an extended period of time with multiple occurrences of active and idle events. You can simply change the acquisition span or the buffer capacity in the Reading Buffers under MENU, as shown in Figure 5.
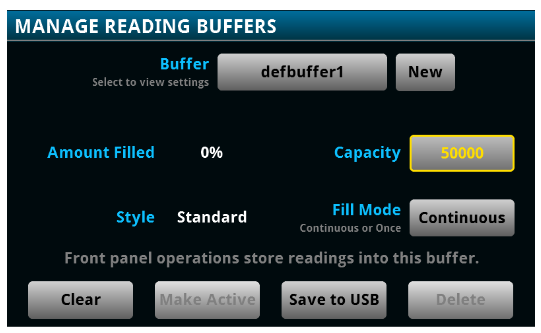

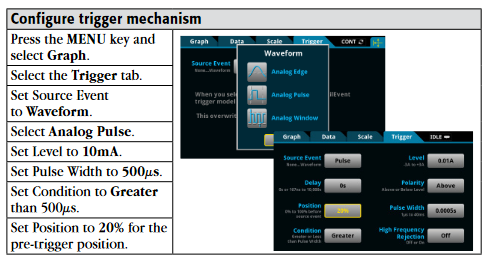
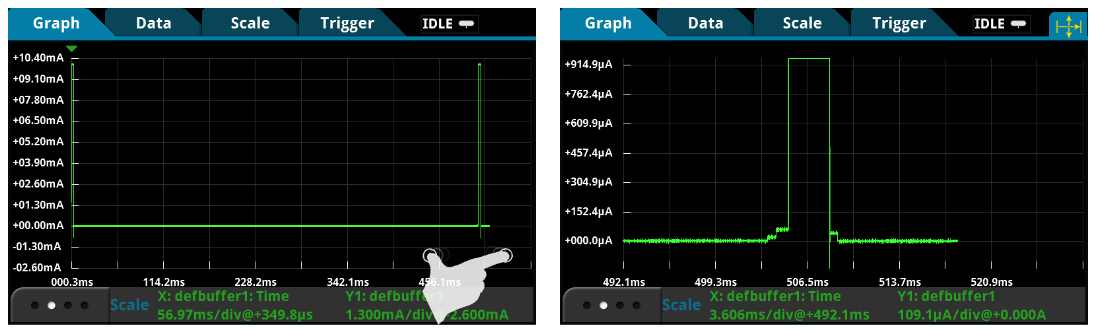
Figure 6 displays an example of active transmission, represented by four 3ms, 10mA peak current pulses each separated by a 100ms idle period. In addition to the analog edge trigger mechanism discussed previously, you can use the built-in analog pulse trigger mechanism to initiate an acquisition when a specific profile of current pulse occurs. Table 2 lists the pulse trigger configuration for the waveform captured in Figure 6.
You are able to zoom into a current pulse to show small changes associated with different sensor node activities with a reasonable level of resolution as shown in Figure 7. For example, on the 100mA range, the 18-bit digitizer will produce readings at 1100µA. However, the effective resolution will be tens of microamps. Refer to the instrument specifications from Keithley’s website (www.keithley.com) for detailed accuracy information for different current and voltage ranges.
Conclusion
The Model DMM7510 is a must-have instrument for analyzing ultra-low power consumption in wireless sensor nodes and IoT smart device applications. It offers low level and high speed current and voltage measurement capabilities that are unmatched on the market. Combining the touchscreen technology, you can view, analyze and interact with your waveform right on the front panel display. It is compact, simple-to-set-up and packed with powerful features that will meet your ultra-low-power measurement needs.
Find more valuable resources at TEK.COM
Copyright © Tektronix. All rights reserved. Tektronix products are covered by U.S. and foreign patents, issued and pending. Information in this publication supersedes that in all previously published material. Specification and price change privileges reserved. TEKTRONIX and TEK are registered trademarks of Tektronix, Inc. All other trade names referenced are the service marks, trademarks or registered trademarks of their respective companies.
1KA-1019771-0 1.20.15