Introduction
Solar or photovoltaic (PV) cells are devices that absorb photons from a light source and then release electrons, causing an electric current to flow when the cell is connected to a load. Solar panels are just a collection of solar cells connected in series and parallel that provide more power than just a single, smaller cell. Researchers and manufacturers of PV cells and panels strive to achieve the highest possible efficiency with minimal losses. As a result, electrical characterization of the cell as well as PV materials is performed as part of research and development and during the manufacturing process. The current-voltage (I-V) characterization of the cell is performed to derive important parameters about the cell’s performance, including its maximum current (Imax) and voltage (Vmax), open circuit voltage (Voc), short circuit current (ISC), and its efficiency (η).
These I-V characteristics can easily be generated using a Keithley 2450 or 2460 SourceMeter SMU Instrument, which can source and measure both current and voltage. Because both SourceMeter instruments have fourquadrant source capability, they can sink the cell current as a function of an applied voltage. Table 1 shows the power envelope of both the 2450 and 2460.

This application note explains how to simplify I-V characterization of solar cells and panels by using the 2450 or 2460, shown in Figure 1. In particular, this application note explains how to perform I-V testing from the front panel of the instrument, including how to generate graphs and save data to a USB drive. It also details how to automate the measurements over a communication bus.

The Solar Cell
The solar cell may be represented by the equivalent circuit model shown in Figure 2, which consists of a light-induced current source (IL), a diode that generates a saturation current [IS(eqV/kT - 1)], series resistance (rs), and shunt resistance (rsh). The series resistance is due to the resistance of the metal contacts, ohmic losses in the front surface of the cell, impurity concentrations, and junction depth. The series resistance is an important parameter because it reduces both the cell’s shortcircuit current and its maximum power output. Ideally, the series resistance should be zero ohms. The shunt resistance represents the loss due to surface leakage along the edge of the cell or to crystal defects. Ideally, the shunt resistance should be infinite.

If a load resistor (RL) is connected to an illuminated solar cell, then the total current becomes:
I = IS(eqV/kT - 1) - IL
where: IS = current due to diode saturation
IL = current due to optical generation
Several parameters are used to characterize the efficiency of the solar cell, including the maximum power point (Pmax), the short circuit current (Isc), and the open circuit voltage (Voc). These points are illustrated in Figure 3, which shows a typical forward bias I-V curve of an illuminated solar cell. The maximum power point (Pmax) is the product of the maximum cell current (Imax) and the voltage (Vmax) where the power output of the cell is greatest. This point is located at the "knee" of the curve.

Using the SourceMeter SMU Instrument as an Electronic Load
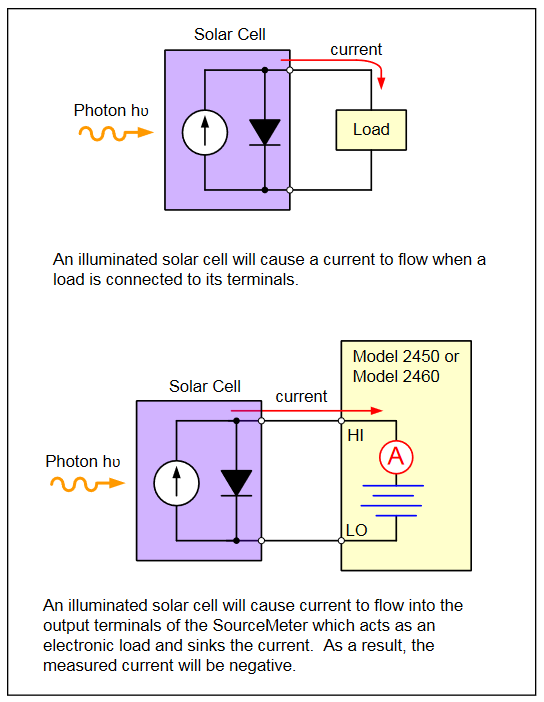
As illustrated in Figure 4, when a load is connected to the output of an illuminated solar cell, a current will flow.
When the illuminated PV cell is connected to the output terminals of the 2450 or 2460, the SourceMeter instrument will sink the current. In other words, the SourceMeter instrument becomes the load. As a result, the measured current is negative.
Making Connections to the Solar Cell or Solar Panel
The solar cell or panel is connected to the 2450 or 2460 as shown in Figure 5. A four-wire connection is made to eliminate the effects of the lead resistance. When connecting the leads to the solar cell, the Force LO and Sense LO connections are made to the cathode terminal. The Force HI and Sense HI connections are made to the anode. Make the connections as close as possible to the cell to prevent the resistance of the solar cell’s terminals from affecting the measurement accuracy.

Generating, Plotting, and Saving I-V Sweeps Using the User Interface in Three Easy Steps
The I-V sweep of a PV cell or panel can be accomplished from either the front panel or over the bus. Just a few key strokes are needed to generate, graph, and save the data to a USB drive. Here are the three easy steps to generate and graph a voltage sweep and then save the data to a USB drive.
Step 1. Creating and Executing an I-V Sweep

Step 2. Viewing the Graph
To view the data graphically, press the MENU key and then the Graph button. The graph of the I-V sweep will automatically be displayed. To repeat the graph, just press the TRIGGER key.
Figure 6 shows the I-V curve of an illuminated PV panel generated by the 2460.

Step 3. Saving the Data to a USB Drive
To save the I-V data to a USB drive, just insert a USB drive, press the MENU key, select Data Buffers, press the desired buffer, and then SAVE TO USB. Enter the name of the file. The data will be saved in a .csv format so it can later be downloaded to a spreadsheet and analyzed.

Automating I-V Measurements with Remote Programming
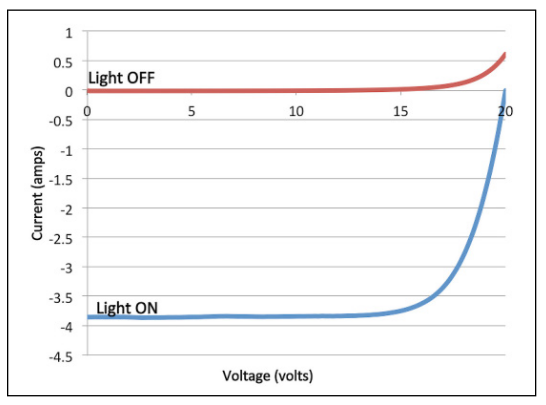
Both the 2450 and 2460 can be remotely controlled by using either SCPI or TSP commands with the flexibility of a LAN, USB, or GPIB interface. An example of how to program the 2460 to automate I-V characteristics on a PV panel was performed using a polycrystalline silicon solar panel. For this particular test, the 2460 was programmed to sweep voltage from 0 V to 20 V in 115 steps and to measure the resulting current in a four-wire configuration. The TSP code to perform this test is listed in Appendix A and the SCPI code is listed in Appendix B. The results of graphing the I-V characteristics of this cell are shown in Figure 8. Notice the test on the solar panel was executed with light (Light ON) and in the dark (Light OFF). As previously discussed, the measured current in the "Light ON" graph is negative because the 2460 is sinking current. If desired, the curve can easily be inverted in the spreadsheet.
In addition to automating the I-V measurements over the bus, the 2450 and 2460 can display the derived maximum power (Pmax), short circuit current (Isc), open circuit voltage (Voc), or other user-derived calculations on its user interface. Figure 9 shows the results of programming the 2450 to display the parameters of a solar cell on its large, easy-to-read display.

Appendix A: Example TSP Code
The following example TSP code is designed to be run from Keithley Instruments Test Script Builder (TSB) software. TSB is a software tool that can be used with both the 2450 and 2460. To use other programming environments, you will need to change the example TSP code. In this particular example for the 2460, the voltage is swept from 0 V to 20 V in 115 steps. The current and voltage readings are stored in the default buffer, defbuffer1. The maximum power, short circuit current, and open circuit voltage are determined and displayed on the 2460 front panel. To use this code with the 2450, you will need to change the current and voltage levels.
The default command set for the 2450 and 2460 is set to SCPI. To change the command set to TSP commands, press MENU -> Settings -> Command Set. Select TSP commands.


Appendix B: Example SCPI Code
The example sequence of SCPI commands is designed to generate an I-V sweep on a solar cell. You must make the appropriate changes so it will run in your programming environment. In this particular example, the voltage is swept from 0 V to 0.55 V in 56 steps and the resulting PV cell current is measured. The current and voltage readings are stored in the buffer, defbuffer1.
