Contactez-nous
Chat en direct avec un représentant Tek. Service disponible de 9 h à 17 h, CET jours ouvrables.
Téléphone
Appelez-nous au
Disponible de 9 h à 17 h CET jours ouvrables.
Télécharger
Télécharger des manuels, des fiches techniques, des logiciels, etc. :
Feedback
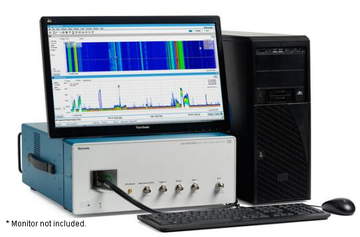
RSA7100B
Fiche technique de l'analyseur de spectre RSA7100B
Les produits figurant sur cette fiche technique ne sont plus vendus par Tektronix.
Plus d’informations
- RSA7100B
- Assistance produit
- Découvrez d'autres modèles Analyseur de spectre : comment choisir son modèle ?