Contactez-nous
Chat en direct avec un représentant Tek. Service disponible de 9 h à 17 h, CET jours ouvrables.
Appelez-nous au
Disponible de 9 h à 17 h CET jours ouvrables.
Télécharger
Télécharger des manuels, des fiches techniques, des logiciels, etc. :
Feedback
Try software tailored to your oscilloscope: 4 Series MSO, 5 Series MSO, and 6 Series MSO.
Advanced Jitter Analysis
5, 6, and 7 Series Oscilloscope Application Datasheet
Plus d’informations
- Assistance produit
- Le MSO profil bas de Série 5
- MSO Série 5B
- Oscilloscope à signaux mixtes MSO 64B, 66B, et 68B
- Oscilloscope à phosphore numérique DPO Série 7
- Découvrez d'autres modèles Logiciel pour oscilloscopes, produits keithley, et RF
Lire en ligne :
Based on the industry-standard Tektronix DPOJET eye-diagram, jitter, noise, and timing analysis package, the Advanced Jitter and Eye Diagram Analysis option provides the highest sensitivity and accuracy available in real-time instruments. Unlike competitive jitter analysis applications, this application integrates the comprehensive jitter and eye-diagram analysis into the oscilloscope's automatic measurement system user interface. The automatic measurements, measurement plots, and advanced jitter decomposition algorithms simplify discovering signal integrity concerns and jitter and their related sources in today's high-speed serial, digital, and communication system designs.
Key standard measurement features
- Basic timing parametric measurements such as period, frequency, rise/fall times, pulse width, and duty cycle
- Time Interval Error (TIE)
- Phase Noise
- Many graphical tools such as Histograms, Time Trends, and Spectrums
- Programmable software clock recovery including software PLL (Patented USPTO #6,812,688)
- Selectable high-limit and low-limit measurement bounds
Key optional Jitter Analysis features
- Jitter and Timing Analysis for analog and digital clock and data signals
- Real-time Eye-diagram (RT-Eye®) Analysis (Patented USPTO #6,836,738)
- Automatic bit rate and pattern length detection eases measurement configuration
- Selectable high-pass and low-pass measurement filters
- Multiple plot types to view and analyze jitter: Time Trend, Eye Diagram, Histogram, Spectrum, Bathtub Curve, and SSC Profile
- Composite jitter histograms for faster root-cause insight
- Accurate jitter analysis using the spectral and Q-scale methods for detailed decomposition of jitter components, including the extraction of industry-standard dual-Dirac model parameters
- Jitter separation algorithms accurately measure the effects of bounded uncorrelated jitter (BUJ) which enables precise TJ measurements
- Eye diagram mask testing with margin analysis for clear pass/fail results
Applications
- Quantify signal amplitude and timing parameters and margins
- Debug complex embedded systems
- Characterize performance of high-speed serial and parallel bus designs
- Characterize clock and data jitter/noise and signal integrity
- Characterize PLL dynamic performance
- Characterize modulation of spread spectrum clock circuits
- Characterize jitter generation, transfer, and tolerance
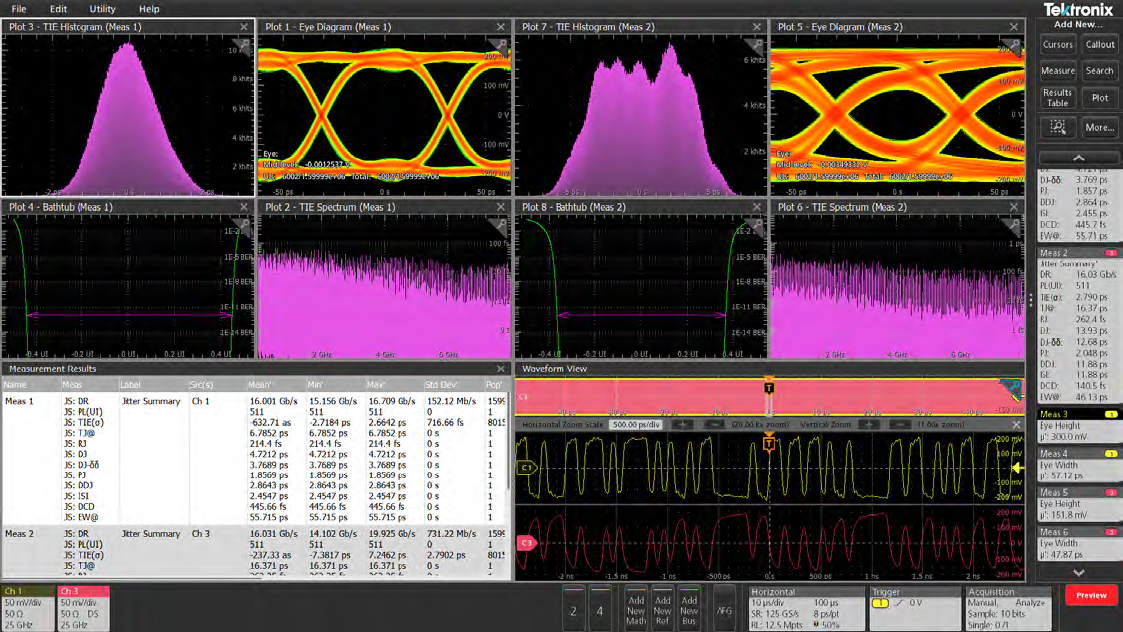
Jitter and eye-diagram measurements
The Advanced Jitter and Eye-diagram Analysis tools extend the capability of Tektronix real-time oscilloscopes, performing complex measurements and analysis of clock, serial, and parallel data signals captured in continuous or single-shot acquisition modes. The jitter and eye-diagram analysis measurements can be made on any of the analog FlexChannel® inputs, any active math waveforms, or any active reference waveforms.
Advanced Jitter and Eye-diagram Analysis is integrated into the oscilloscope's automatic measurement system, allowing essentially unlimited combinations of standard and jitter measurements to be enabled and displayed. Within the Add New Measure configuration menu, the standard amplitude and timing measurements are on the Standard tab and the jitter measurements are on the Jitter tab.
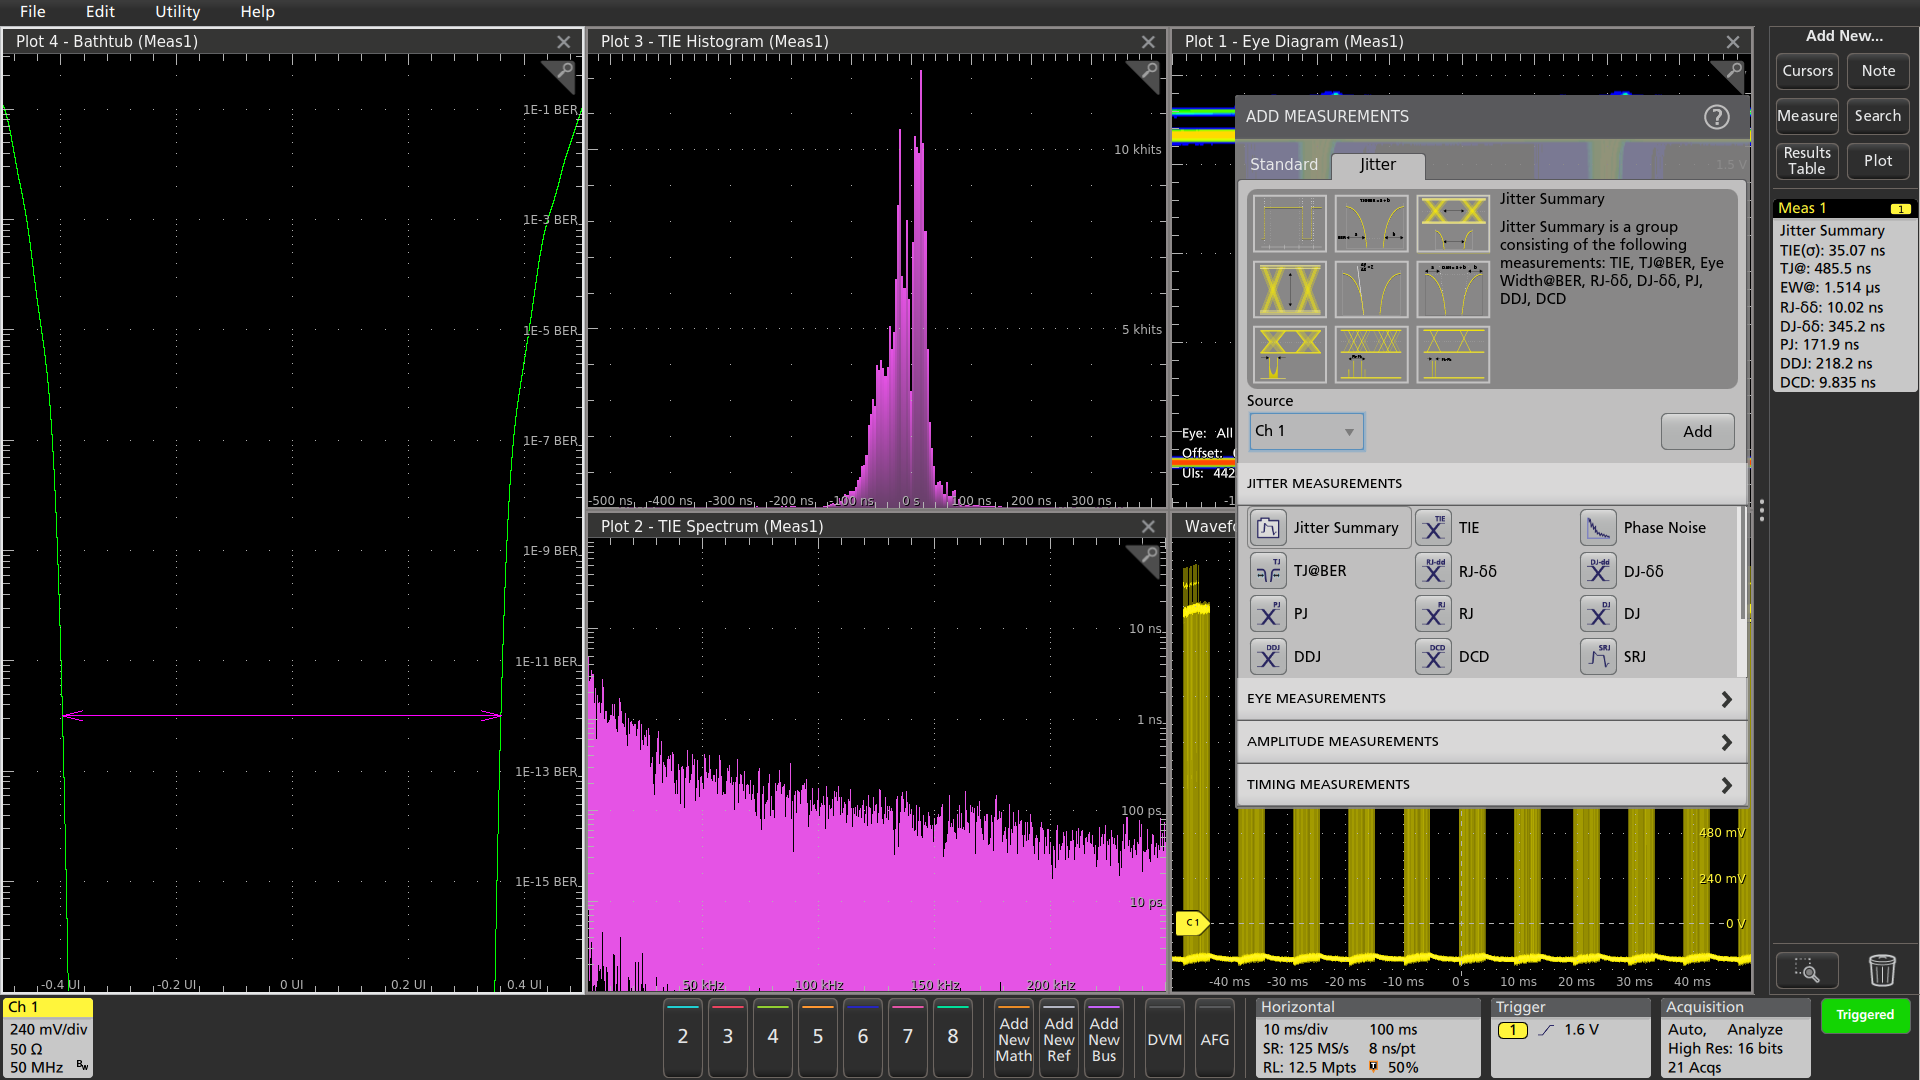
The JITTER MEASUREMENTS panel in the ADD MEASUREMENTS configuration menu on the Jitter tab contains:
| Jitter measurement | Description |
|---|---|
| Jitter Summary | Jitter Summary consists of a group of measurements: TIE, TJ@BER, Eye Width@BER, RJ-δδ, DJ-δδ, PJ, DDJ, and DCD. |
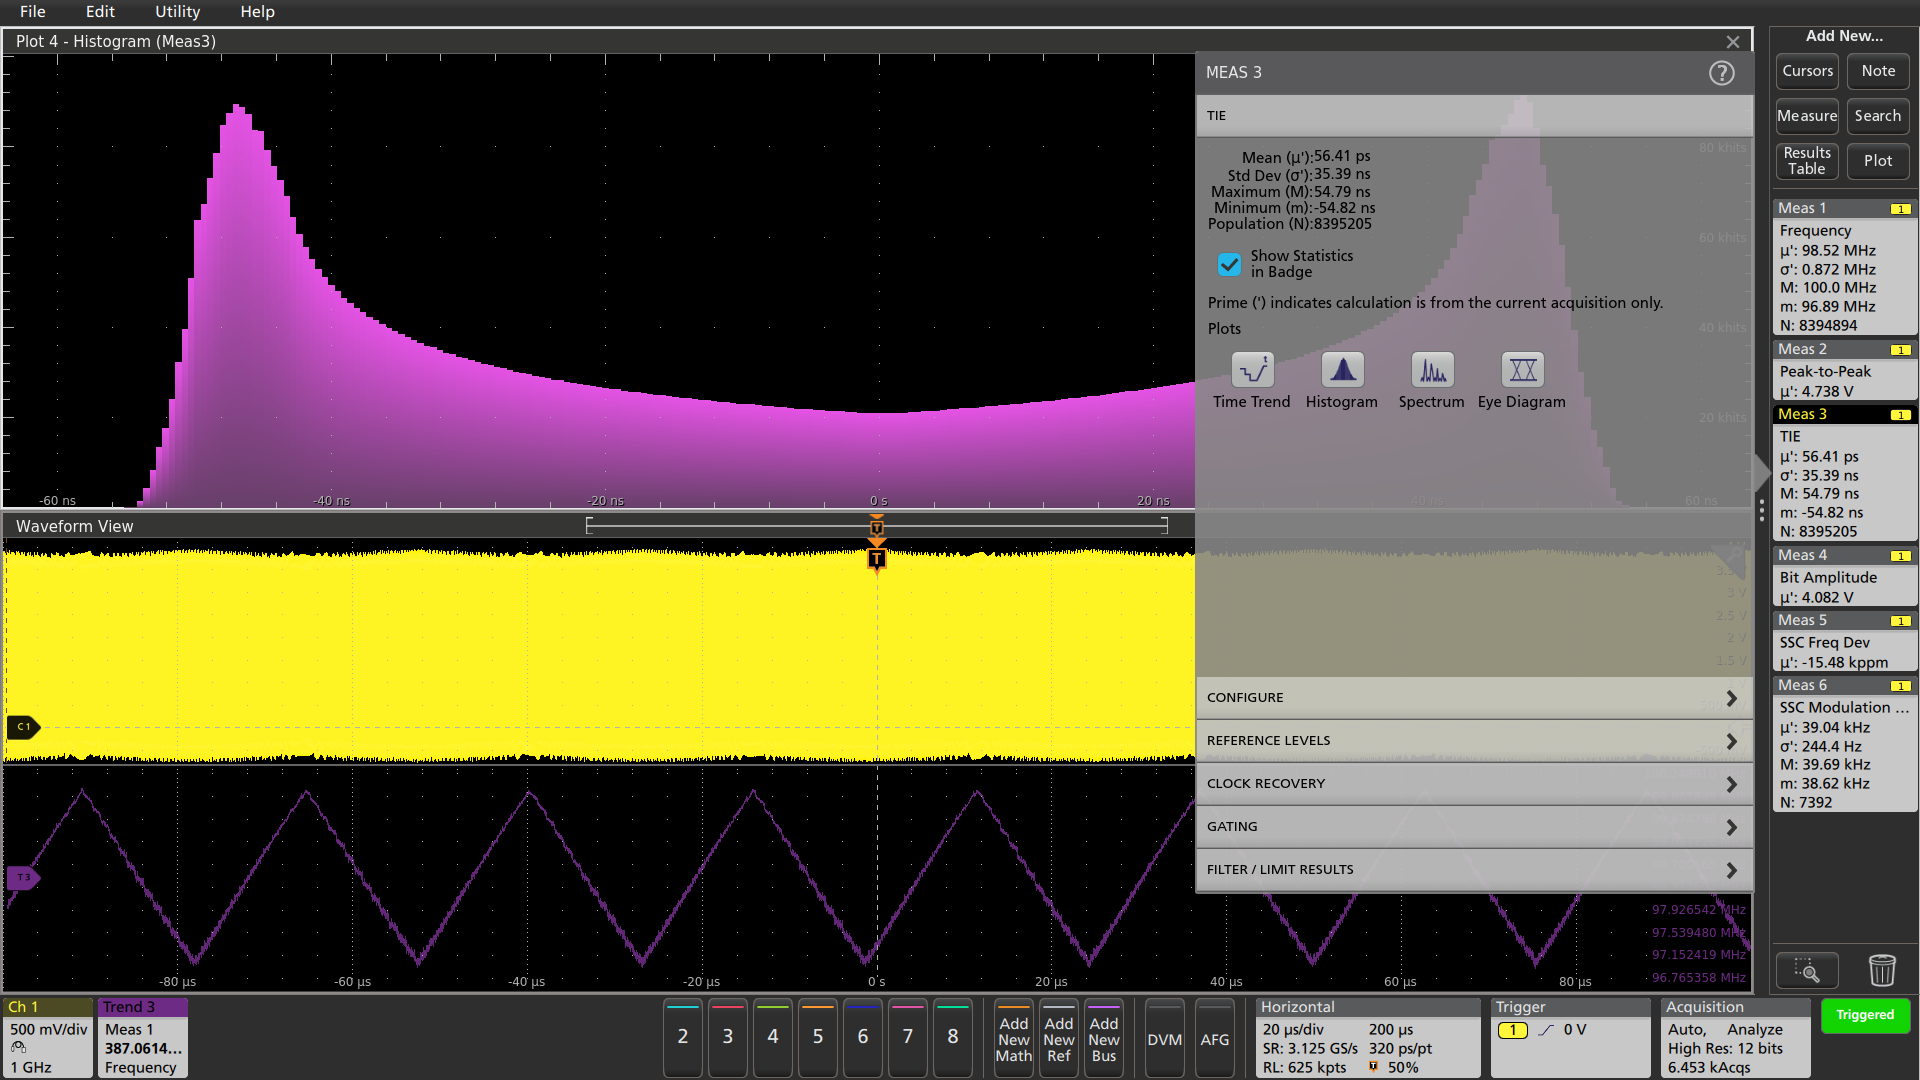
| TIE | Time Interval Error is the time difference between an edge in the source waveform and the corresponding edge in a recovered reference clock. |
| Phase Noise | Phase Noise is the RMS magnitude of all integrated jitter falling within a user-specified offset range of the fundamental clock frequency. |
| TJ@BER | Total Jitter at a specified Bit Error Rate is the predicted peak-to-peak amplitude of the jitter that will only be exceeded with a probability equal to the bit error rate. |
| RJ-δδ | Dual-Dirac Random Jitter is random jitter based on a simplifying assumption that the histogram of all deterministic jitter can be modeled as a pair of equal-magnitude Dirac functions. |
| DJ-δδ | Dual-Dirac Deterministic Jitter is deterministic jitter based on a simplifying assumption that the histogram of all deterministic jitter can be modeled as a pair of equal-magnitude Dirac functions. |
| PJ | Periodic Jitter is the peak-to-peak amplitude of the uncorrelated sinusoidal components of the deterministic jitter. |
| RJ | Random Jitter is the RMS magnitude of all random timing errors following a Gaussian distribution. |
| DJ | Deterministic Jitter is the peak-to-peak amplitude of all timing errors that exhibit deterministic behavior. |
| DDJ | Data Dependent Jitter is the peak-to-peak amplitude of the component of the deterministic jitter correlated with the data pattern in the waveform. |
| ISI | Intersymbol Interference is the difference between the maximum and minimum Data-Dependent Jitter (DDJ) per edge, measured across all rising edges or all falling edges, whichever range is greater. |
| DCD | Duty Cycle Distortion is the peak-to-peak amplitude of the component of the deterministic jitter correlated with the signal polarity. |
| SRJ | Sub-Rate Jitter is the composite jitter due to periodic components at 1/2, 1/4, and 1/8 of the data rate. |
| J2 | J2 is the total jitter at a bit error rate of 2.5e-3. |
| J9 | J9 is the total jitter at a bit error rate of 2.5e-10. |
| NPJ | Non-Periodic Jitter is the portion of the Bounded Uncorrelated Jitter (BUJ) that is random. BUJ excludes DDJ, DCD, and RJ. |
| F/2 | F/2 is the peak-to-peak amplitude of the periodic jitter occurring at 1/2 of the data rate. |
| F/4 | F/4 is the peak-to-peak amplitude of the periodic jitter occurring at 1/4 of the data rate. |
| F/8 | F/8 is the peak-to-peak amplitude of the periodic jitter occurring at 1/8 of the data rate. |
The EYE MEASUREMENTS panel in the ADD MEASUREMENTS configuration menu on the Jitter tab contains:
| Eye measurement | Description |
|---|---|
| Eye Height | Eye Height is the minimum vertical eye opening at the center of the recovered unit interval. |
| Eye Width | Eye Width is the minimum horizontal eye opening at the user-specified reference level. |
| Eye High | Eye High is the amplitude of a high ("1") bit measured at a user-specified location within the recovered unit interval. |
| Eye Height@BER | Eye Height@BER is the predicted vertical eye opening that will be violated with a probability equal to the bit error rate. |
| Eye Width@BER | Eye Width@BER is the predicted horizontal eye opening that will be violated with a probability equal to the bit error rate. |
| Eye Low | Eye Low is the amplitude of a low ("0") bit measured at a user-specified location within the recovered unit interval. |
| Q-Factor | Q-Factor is the ratio of the vertical eye opening to the RMS vertical noise measured at a user-specified location within the recovered unit interval. |
| Eye Mask Autofit | Automatically adjusts the position of the Eye Mask to minimize the number of mask hits. |
The AMPLITUDE MEASUREMENTS panel in the ADD MEASUREMENTS configuration menu on the Jitter tab contains:
| Amplitude measurement | Description |
|---|---|
| Bit High | Bit High is the amplitude of a "1" bit. The amplitude is measured over a user-specified portion at the center of the recovered unit interval. |
| Bit Low | Bit Low is the amplitude of a "0" bit. The amplitude is measured over a user-specified portion at the center of the recovered unit interval. |
| Bit Amplitude | Bit Amplitude is the difference between the amplitudes of the "1" bit and the "0" bit surrounding a transition. The amplitude is measured over a user-specified portion at the center of the recovered unit interval. |
| DC Common Mode | DC Common Mode is the arithmetic mean of the common mode voltage of two sources. |
| AC Common Mode (Pk-Pk) | AC Common Mode (Pk-Pk) is the peak-to-peak difference between the two sources' common mode voltages. |
| Differential Crossover | Differential Crossover is the voltage level of a differential signal pair at the crossover point(s). |
| T/nT Ratio | T/nT Ratio is the ratio of non-transition bit voltage (second and subsequent bit voltage after a transition) to its nearest preceding transition bit voltage (first bit voltage after the transition). Bit voltages are measured at the interpolated midpoint of the recovered unit interval. |
The TIMING MEASUREMENTS panel in the ADD MEASUREMENTS configuration menu on the Jitter tab contains:
| Timing measurement | Description |
|---|---|
| SSC Freq Dev | SSC Frequency Deviation is the Spread Spectrum Clock frequency deviation. This measurement enables a time trend plot of the spread spectrum clock modulation profile. |
| SSC Modulation Rate | SSC Modulation rate is the modulating frequency of a Spread Spectrum Clock. |
| SSC Slew Rate | SSC Slew Rate is the rate of change of the clock frequency due to spread spectrum modulation. |
| Pattern Length | Pattern Length measures the number of symbols in the smallest repeating sequence. |
Multi-measurement configuration
As a measurement is enabled, the mean value of the measurement appears in a badge at the right side of the display. Double-tapping the badge opens the configuration menu for that measurement, enabling the user to display a summary of the measurement statistics in the badge, display the measurement values in one or more relevant plot formats, and configure the automatic measurement parameters (including signal type, reference levels, clock recovery method, gating, filtering, and limits). These measurement parameters can be applied globally to all measurements, or just to individual measurements.
As an example, jitter measurements on a spread spectrum clock are based on a reference phased locked loop (PLL) for clock recovery. Typically, the PLL is defined to filter out high-frequencies and track the effects of intentional low-frequency jitter. The result is a more open eye diagram. However, in cases where it is desired to see the effects of clock jitter on the device under test, constant clock recovery can be used. These measurements can be made at the same time using the flexible measurement configuration features.
Data visualization
Numerical jitter and eye-diagram analysis measurement results are critical to verifying that the design meets or exceed its specifications. However, deep understanding and successful system debug requires insight beyond a simple parametric measurement result. What are the statistical variations in the measurement? How does the parameter vary over time? How do these variations correlate with other activity within the design?
For example, analysis of a spread spectrum clock signal may show the average clock frequency and maximum frequency deviation. The frequency variation should be a controlled, low-frequency jitter. Is the frequency actually varying as designed? The Advanced Jitter Analysis application can plot the frequency and Time Interval Error (TIE) measurement time trends along with the clock waveform, and plot the histograms and spectrums of the measurements, providing insight into the circuit behavior in multiple domains.

By default, the spectral plot shows the entire jitter content of the signal. To examine the low-frequency jitter components, the spectrum can be zoomed and measured with cursors. While zoomed, the overview window always provides context of the zoomed area in relation to the entire plot.
Advanced Jitter and Eye-diagram Analysis provides customizable displays, showing measurement values and statistics in measurement badges or results tables, as well as eye diagrams, trend plots, histograms, bathtub plots, and spectral plots.
Composite Jitter Histograms overlay Total, Periodic, Random-plus-BUJ, and Data-Dependent jitter in a single plot, enabling direct comparison and faster root-cause identification.
Trend analysis quickly shows engineers how timing parameters change over time, like frequency drift, PLL startup transients, or a circuit's response to power supply changes.
Spectrum analysis quickly shows the precise frequency and amplitude of jitter and modulation sources for easy, rapid identification.
Finding sources like adjacent oscillators and clocks, power supply noise, or signal crosstalk is no longer a tedious chore. The plots are all interactive, allowing the user to zoom in on interesting details and make cursor measurements on the plot. And waveforms and plots can be annotated and saved, enabling collaboration with the design team and suppliers.
Eye diagram mask testing
Eye diagrams are powerful representations of serial signals. Coupled with the automated pass/fail eye diagram mask testing capability of the jitter analysis application, this graphical measurement technique allows you to use a single test to verify signal amplitudes and noise, timing jitter, rise-times, and fall-times.
As with so many features, the number of segments in the mask test is essentially unlimited. When you add segments to the mask, the mask results badge at the right side of the display expands to indicate the mask violations (hits) for each segment.
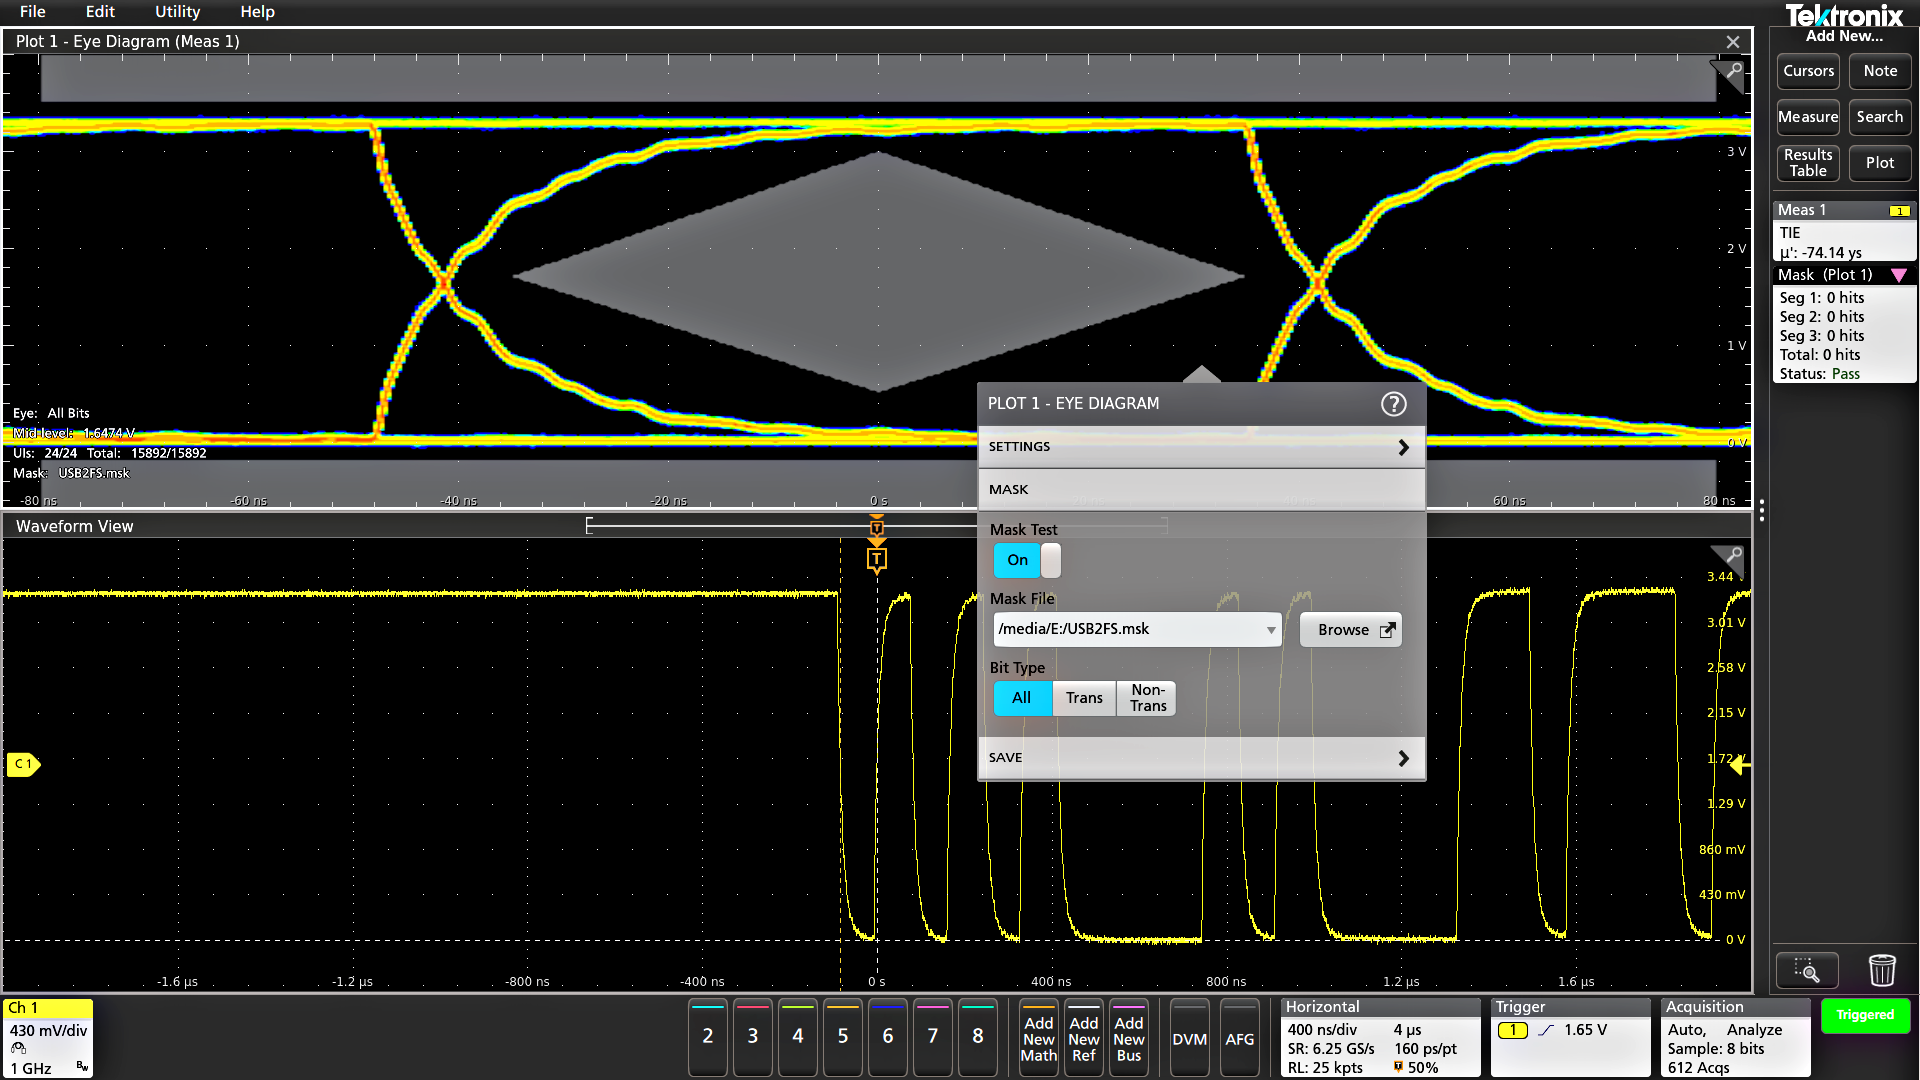
Eye diagram masks are composed of graphical areas on the display which are defined by simple text or XML files. For example, the following three-line text file, with each line containing four X-Y time and voltage coordinates, defines the mask shown above:
- :MASK:USER:SEG1:POINTS -80E-9,3.5,80E-9, 3.5,80E-9,4,-80E-9,4;
- :MASK:USER:SEG2:POINTS -35E-9,1.7,0.0,0.5,35E-9,1.7,0.0,3.0;
- :MASK:USER:SEG3:POINTS -80E-9,-0.7,80E-9,-0.7,80E-9,-0.2,-80E-9,-0.2;
Whether the mask test is run continuously, such as over the weekend, or for a specified number of acquisitions, all mask hits are accumulated. The hits are shown as white pixels in the gray mask areas, and are displayed in the results badge. At the end of the test, the total number of hits is compared to the user-selectable threshold and the test is clearly marked as Pass or Fail.
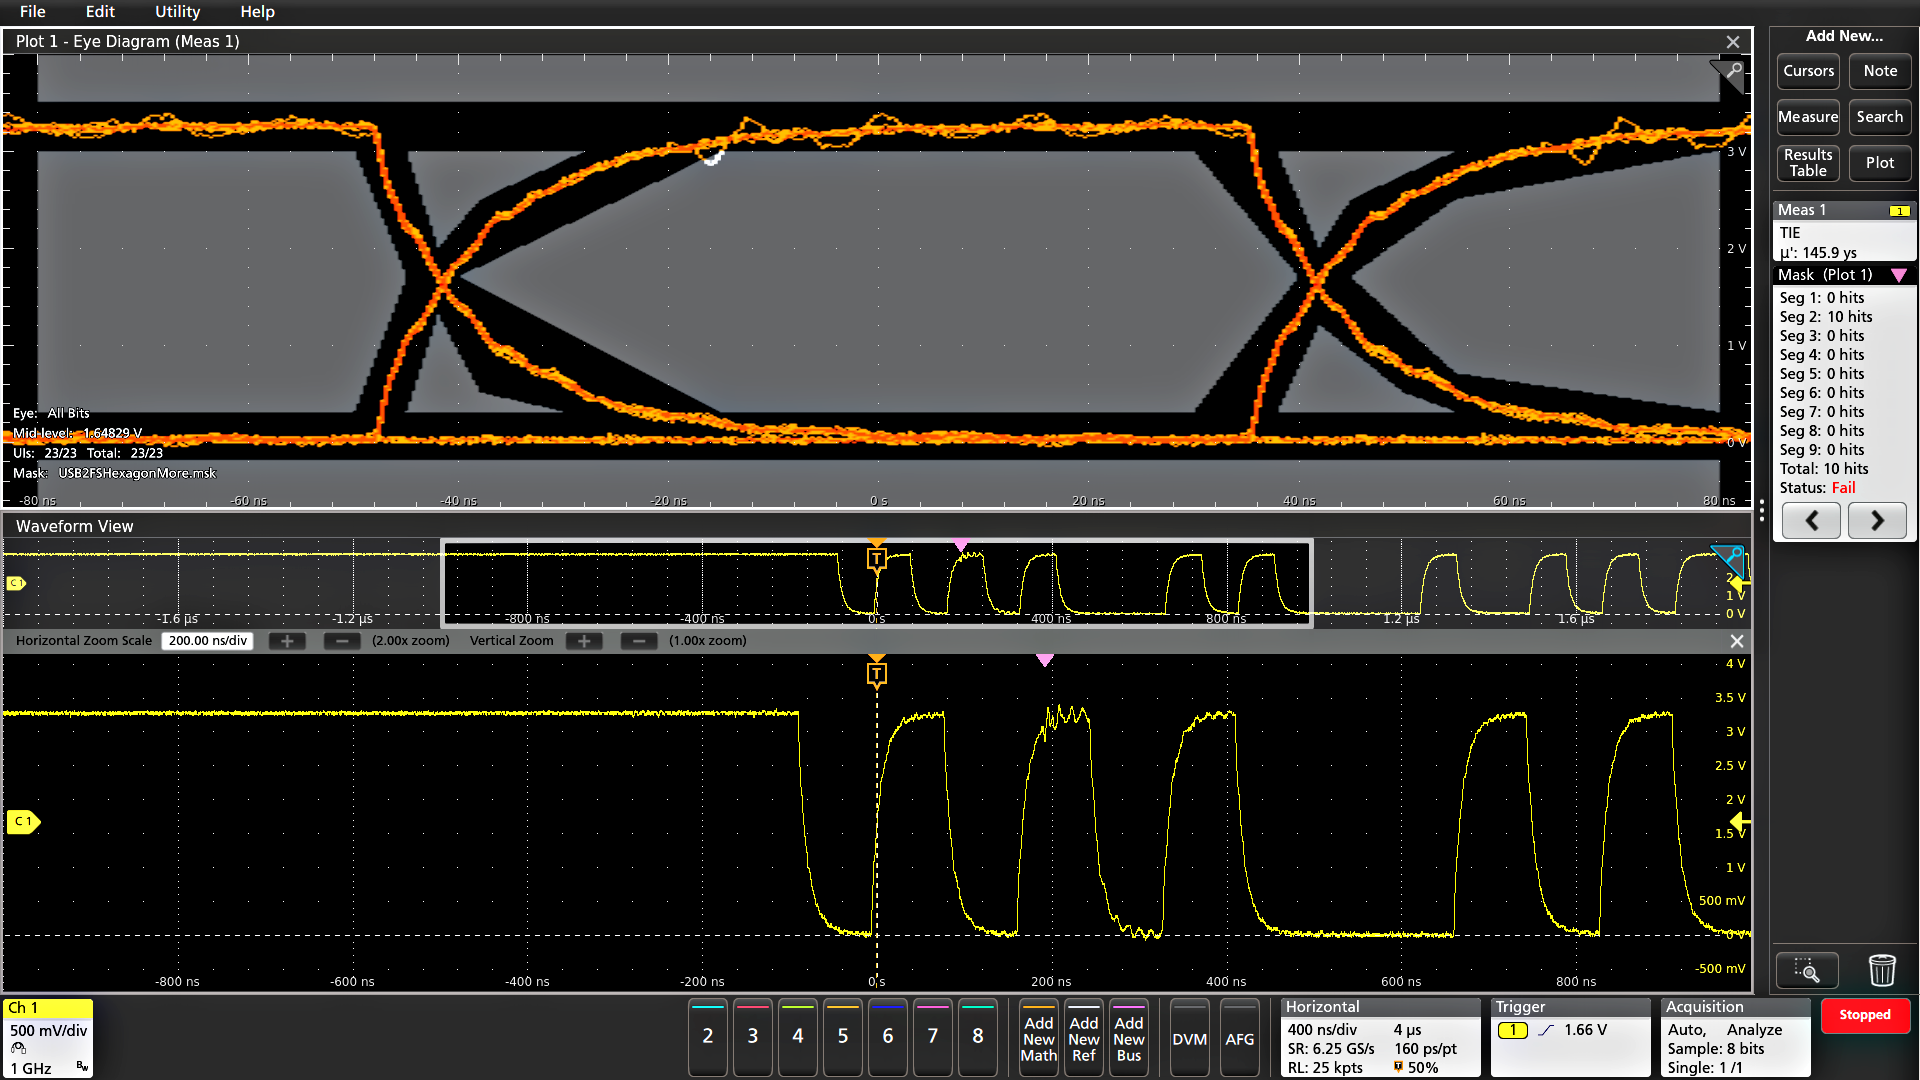
When mask hits occur in the eye diagram plot, the corresponding points in the time-domain waveform are marked with a purple triangle search mark. When acquisitions are stopped, you can use the navigation arrows in the results badge to search in the current acquisition for the locations that caused the mask violations. If mask hits are excessive on long duration acquisition, an Eye Mask Autofit function can be enabled to automatically adjust the position of the Eye Mask while retaining the size and shape of the mask relative to the waveform. This can dramatically speed up analysis of timing and amplitude errors that undermine serial signal performance.
Mask margin provides a quantitative measure of how closely a signal approaches the defined eye mask limits. By calculating the tolerance area around the mask, mask margin shows how much the eye opening can shrink, shift, or distort before a violation occurs. This analysis not only determines strict pass/fail compliance, but also reveals the degree of margin available, giving engineers deeper insight into signal robustness and design reliability.
For further analysis and documentation, after a mask test has completed, you can also export the plot display, the eye diagram data, and the mask hits results to your computer.
Ordering information
- Opt. 5-DJA
- Advanced Jitter Analysis application preinstalled on a new 5 Series B MSO instrument.
- Opt. 6-DJA
- Advanced Jitter Analysis application preinstalled on a new 6 Series B MSO instrument.
- Opt. 7-DJA
- Advanced Jitter Analysis application preinstalled on a new 7 Series DPO instrument.
Upgrade to existing instrument
| 5 Series B MSO Node-Locked license | 5 Series B MSO Floating license | 6 Series B MSO Node-Locked license | 6 Series B MSO Floating license | Description |
|---|---|---|---|---|
| SUP5-DJA | SUP5-DJA-FL | SUP6-DJA | SUP6-DJA-FL | Advanced Jitter Analysis application license to upgrade an existing instrument |
| 7 Series DPO Node-Locked license | 7 Series DPO Floating license |
|---|---|
| 7-DJA | 7-DJA-FL |