Kontaktaufnahme
Live-Chat mit Tektronix-Vertretern. Verfügbar von 9 bis 17 Uhr CET Geschäftstage.
Kontaktieren Sie uns telefonisch unter
Verfügbar von 9 bis 17 Uhr CET Geschäftstage.
Download
Laden Sie Handbücher, Datenblätter, Software und vieles mehr herunter:
Feedback
Mixed Signal Oscilloscopes
MSO2000B Series, DPO2000B Series Datasheet
The products on this datasheet are no longer being sold by Tektronix.
View Tektronix Encore for reconditioned test equipment.
Check support and warranty status for these products.
Die Produkte dieses Datenblatts gehören nicht mehr zum Angebot von Tektronix.
Tektronix Encore nach aufgearbeiteten Testgeräten durchsuchen.
Garantie- und Supportstatus dieser Produkte überprüfen.
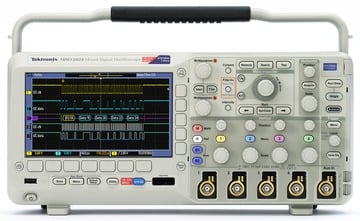
Offering up to 200 MHz bandwidth and 1 GS/s sample rate, the MSO/DPO2000B Mixed Signal Oscilloscope Series from Tektronix delivers advanced debug features at an entry-level price. Quickly find and diagnose problems in complex designs with up to 20 channels for analyzing analog and digital signals. With a deep record length of 1 Mpoints standard on all channels, the MSO/DPO2000B lets you capture long windows of signal activity while maintaining fine timing resolution.
Key features
- Wave Inspector® controls provide easy navigation and automated search of waveform data
- FilterVu™ variable low-pass filter allows for removal of unwanted signal noise while still capturing high-frequency events
- 29 automated measurements, and FFT analysis for simplified waveform analysis
- TekVPI® probe interface supports active, differential, and current probes for automatic scaling and units
- 7 in. (180 mm) wide-screen TFT-LCD color display
- Small footprint and lightweight - only 5.3 in. (134 mm) deep and 7 lb. 14 oz. (3.6 kg)
- Five-year warranty
Key performance specifications
- 200, 100, 70 MHz bandwidth models
- 2 and 4 analog channel models
- 16 digital channels (MSO series)
- 1 GS/s sample rate on all channels
- 1 megapoint record length on all channels
- 5,000 wfm/s maximum waveform capture rate
- Suite of advanced triggers
Connectivity
- USB 2.0 host port on the front panel for quick and easy data storage
- USB 2.0 device port on rear panel for easy connection to a PC or direct printing to a PictBridge®-compatible printer
- Optional 10/100 Ethernet port for network connection and video-out port to export the oscilloscope display to a monitor or projector
Optional serial triggering and analysis
- Automated serial triggering, decode, and search options for I2C, SPI, CAN, LIN, and RS-232/422/485/UART
Feature-rich tools for debugging mixed signal designs
Simplify and speed up debugging your complex design with feature-rich tools including Wave Inspector® controls for rapid waveform navigation and automated serial and parallel bus analysis.
Comprehensive features speed every stage of debug
The MSO/DPO2000B Series offers a robust set of features to speed every stage of debugging your design - from quickly discovering an anomaly and capturing it, to searching your waveform record for the event and analyzing its characteristics and your device's behavior.
Discover
To debug a design problem, first you must know it exists. Every design engineer spends time looking for problems in their design, a time-consuming and frustrating task without the right debug tools.
The MSO/DPO2000B Series offers complete visualization of signals, providing fast insight into the real operation of your device. A waveform capture rate of 5,000 waveforms per second enables you to see glitches and other infrequent transients quickly, revealing the true nature of device faults. A digital phosphor display with intensity grading shows the history of a signal's activity by intensifying areas of the signal that occur more frequently, providing a visual display of just how often anomalies occur.
Capture
Discovering a device fault is only the first step. Next, you must capture the event of interest to identify root cause.
The MSO/DPO2000B Series provides a complete set of triggers - including runt, logic, pulse width/glitch, setup/hold violation, serial packet, and parallel data - to help quickly find your event. With up to a 1 Mpoint record length, you can capture many events of interest, even thousands of serial packets, in a single acquisition for further analysis while maintaining high resolution to zoom in on fine signal details.
From triggering on specific packet content to automatic decode in multiple data formats, the MSO/DPO2000B Series provides integrated support for a broad range of serial buses - I2C, SPI, CAN, LIN, and RS-232/422/485/UART. The ability to decode up to two serial and/or parallel buses simultaneously means you gain insight into system-level problems quickly.
To further help troubleshoot system-level interactions in complex embedded systems, the MSO2000B Series offers 16 digital channels in addition to its analog channels. Since the digital channels are fully integrated into the oscilloscope, you can trigger across all input channels, automatically time-correlating all analog, digital, and serial signals.
Search
Finding your event of interest in a long waveform record can be time consuming without the right search tools. With today's record lengths pushing to a million data points, locating your event can mean scrolling through thousands of screens of signal activity.
The MSO/DPO2000B Series offers the industry's most comprehensive search and waveform navigation with its innovative Wave Inspector® controls. These controls speed panning and zooming through your record. A unique force-feedback system lets you move from one end of your record to the other in just seconds. You can mark any location you may want to reference later for further investigation, and automatically search the record using criteria that you define. Wave Inspector will instantly search your entire record, including analog, digital, and serial bus data. Along the way, it will automatically mark every occurrence of your defined event so you can quickly move between events.
Analyze
Verifying that your prototype's performance matches simulations and meets the project's design goals requires analyzing its behavior. Tasks can range from simple checks of rise times and pulse widths to sophisticated power loss analysis and investigation of noise sources.
The MSO/DPO2000B Series offers a comprehensive set of integrated analysis tools including waveform- and screen-based cursors, 29 automated measurements, and FFT analysis. Specialized application support for serial bus analysis is also available.
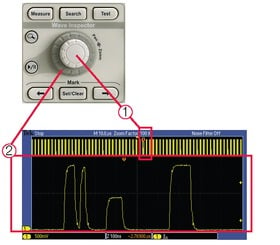
Wave Inspector® navigation and search
A 1 M point record length represents thousands of screens of information. The MSO/DPO2000B Series enables you to search through it all and find your event in seconds with Wave Inspector, the industry's best tool for navigation and search.
Wave Inspector offers the following innovative controls:
Zoom/pan
A dedicated, two-tier front-panel control provides intuitive control of both zooming and panning. The inner control adjusts the zoom factor (or zoom scale); turning it clockwise activates zoom and goes to progressively higher zoom factors, while turning it counterclockwise results in lower zoom factors and eventually turning zoom off. No longer do you need to navigate through multiple menus to adjust your zoom view. The outer control pans the zoom box across the waveform to quickly get to the portion of waveform you are interested in. The outer control also utilizes force-feedback to determine how fast to pan on the waveform. The farther you turn the outer control, the faster the zoom box moves. Pan direction is changed by simply turning the control the other way.
Play/pause
A dedicated play/pause front-panel button scrolls the waveform across the display automatically while you look for anomalies or an event of interest. Playback speed and direction are controlled using the intuitive pan control. Once again, turning the control further makes the waveform scroll faster and changing direction is as simple as turning the control the other way.
User marks
Press the Set Mark front-panel button to place one or more marks on the waveform. Navigating between marks is as simple as pressing the Previous (←) and Next (→) buttons on the front panel.
Search marks
The Search button allows you to automatically search through your long acquisition looking for user-defined events. All occurrences of the event are highlighted with search marks and are easily navigated to, using the front-panel Previous (←) and Next (→) buttons. Search types include edge, pulse width/glitch, runt, logic, setup and hold, rise/fall time parallel bus, and I2C, SPI, CAN, LIN, and RS-232/422/485/UART packet content.
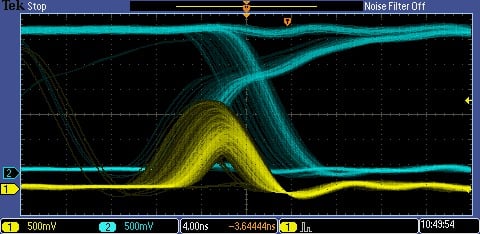
Digital phosphor technology
The MSO/DPO2000B Series' digital phosphor technology provides you with fast insight into the real operation of your device. Its waveform capture rate of 5,000 wfm/s gives you a high probability of quickly seeing the infrequent problems common in digital systems: runt pulses, glitches, timing issues, and more.
Waveforms are superimposed with one another and waveform points that occur more frequently are intensified. This quickly highlights the events that over time occur more often or, in the case of infrequent anomalies, occur less often.
With the MSO/DPO2000B Series, you can choose infinite persistence or variable persistence, determining how long the previous waveform acquisitions stay on-screen. This allows you to determine how often an anomaly is occurring.
Mixed signal design and analysis (MSO series)
The MSO2000B Series Mixed Signal Oscilloscopes provide 16 digital channels. These channels are tightly integrated into the oscilloscope's user interface, simplifying operation and making it possible to solve mixed-signal issues easily.
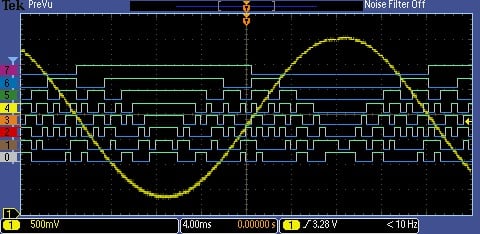
Color-coded digital waveform display
The MSO2000B Series has redefined the way you view digital waveforms. One common problem shared by both logic analyzers and mixed-signal oscilloscopes is determining if data is a one or a zero when zoomed in far enough that the digital trace stays flat all the way across the display. The MSO2000B Series has color-coded digital traces, displaying ones in green and zeros in blue.
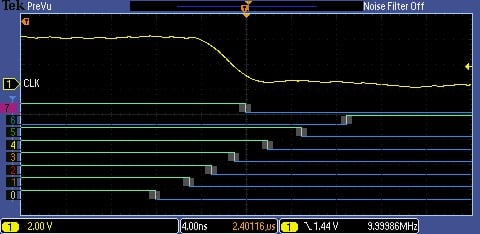
The multiple transition detection hardware of the MSO2000B Series will show you a white edge on the display when the system detects multiple transitions. This acts as a visual reminder that increasing the sample rate on the next acquisition will reveal higher frequency information than your previous settings could acquire.
The MSO2000B Series simplifies channel setup by allowing you to group digital waveforms and enter waveform labels by using a USB keyboard. By simply placing digital waveforms next to each other, they form a group. Once a group is formed, you can position all the channels contained in that group collectively. This greatly reduces the normal setup time associated with positioning channels individually.
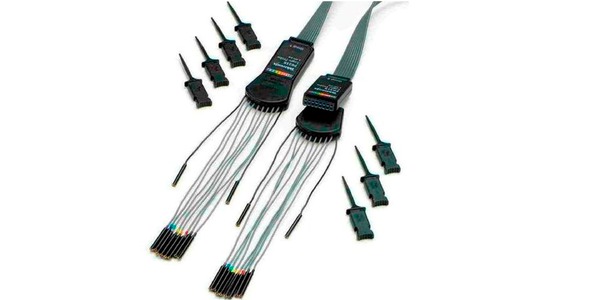
P6316 MSO probe
This unique probe design offers two eight-channel pods, simplifying the process of connecting to the device-under-test. When connecting to square pins, the P6316 can connect directly to 8×2 square pin headers spaced on tenth-inch centers. When more attachment flexibility is required, you can use the included flying lead sets and grabbers to clip onto surface mount devices or test points. The P6316 offers outstanding electrical characteristics applying only 8 pF of capacitive loading with 101 kΩ input impedance.
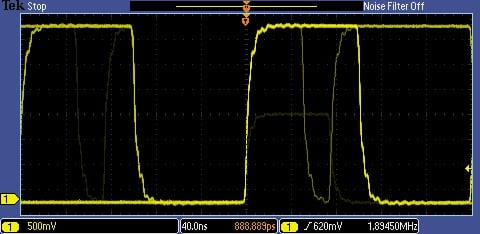
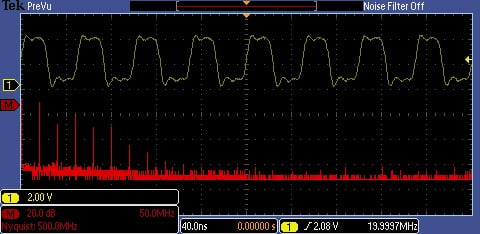
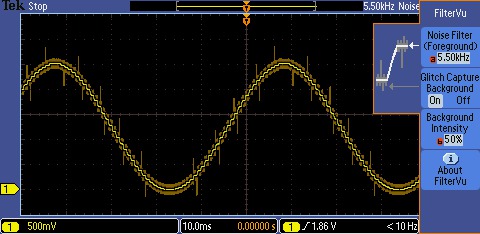
FilterVu™ variable low-pass filter
Tired of being limited to a 20 MHz bandwidth filter in your oscilloscope? Simply turn on FilterVu and adjust the variable low-pass noise filter. Unlike other variable low-pass filters, FilterVu filters out the unwanted noise from your signal while still capturing glitches and other signal details up to the full bandwidth of the oscilloscope. It does this by showing two waveforms: a waveform that can be filtered (foreground waveform) and a glitch capture waveform (background waveform).
The filtered waveform uses a variable low-pass filter to block out noise, yielding a cleaner waveform to more precisely locate signal edges and amplitude levels. The result is improved confidence in you cursor measurements and cleaner documentation of important signal attributes. When the noise filter is adjusted to the lowest available noise-cutoff frequency, no more than 1% of high-frequency content that could cause the oscilloscope to alias will pass through the filter.
The glitch capture waveform shows signal details up to the full bandwidth of the oscilloscope. The oscilloscope captures pulses as narrow as 5 ns, using peak-detect min/max sampling, protecting you from missing unexpected glitches or other high-frequency events.
FilterVu is ideal for repetitive, nonrepetitive, and single-shot events.
Serial triggering and analysis (optional)
On a serial bus, a single signal often includes address, control, data, and clock information. This can make isolating events of interest difficult. Automatic trigger, decode, and search on bus events and conditions gives you a robust set of tools for debugging serial buses. The optional serial protocol triggering and analysis functionality is offered free for a 30-day trial period. This free trial period starts automatically when the instrument is powered on for the first time.
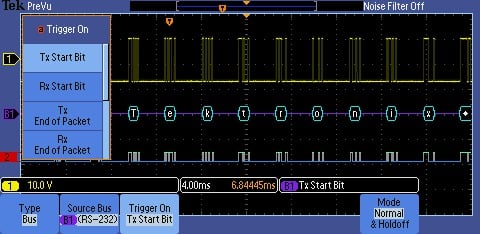
Serial triggering
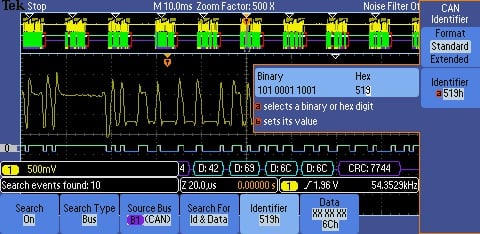
Trigger on packet content such as start of packet, specific addresses, specific data content, unique identifiers, etc. on popular serial interfaces such as I2C, SPI, CAN, LIN, and RS-232/422/485/UART.
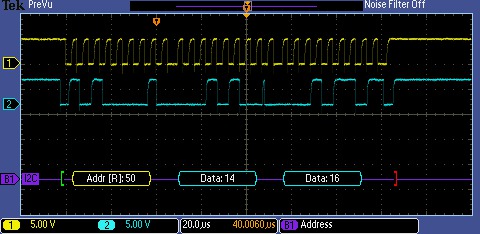
Bus display
Provides a higher-level, combined view of the individual signals (clock, data, chip enable, etc.) that make up your bus, making it easy to identify where packets begin and end and identifying subpacket components such as address, data, identifier, CRC, etc.
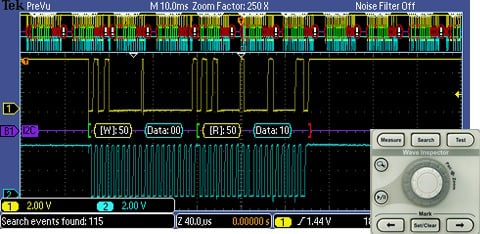
Bus decoding
Tired of having to visually inspect the waveform to count clocks, determine if each bit is a 1 or a 0, combine bits into bytes, and determine the hex value? Let the oscilloscope do it for you! Once you've set up a bus, the MSO/DPO2000B Series will decode each packet on the bus, and display the value in hex, binary, decimal (LIN only), or ASCII (RS-232/422/485/UART only) in the bus waveform.
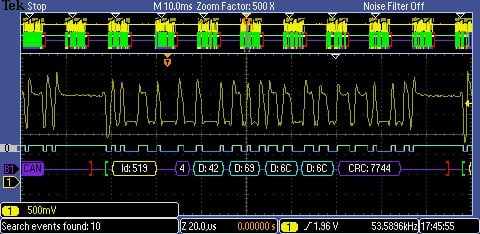
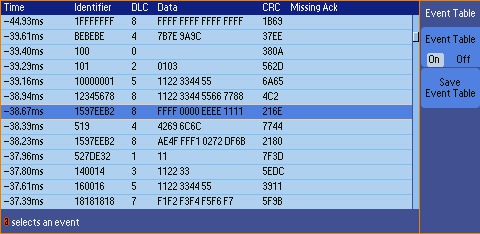
Event table
In addition to seeing decoded packet data on the bus waveform itself, you can view all captured packets in a tabular view much like you would see in a software listing. Packets are time stamped and listed consecutively with columns for each component (Address, Data, etc.).
Search
Serial triggering is very useful for isolating the event of interest, but once you've captured it and need to analyze the surrounding data, what do you do? In the past, users had to manually scroll through the waveform counting and converting bits and looking for what caused the event. With the MSO/DPO2000B Series, you can have the oscilloscope automatically search through the acquired data for user-defined criteria including serial packet content. Each occurrence is highlighted by a search mark. Rapid navigation between marks is as simple as pressing the Previous (←) and Next (→) buttons on the front panel.
Designed to make your work easier
The MSO/DPO2000B is designed to make your work easier. The bright, widescreen display shows a long time window. Dedicated front-panel controls simplify operation. A USB host port on the front panel allows you to easily transfer screenshots, instrument settings, and waveform data to a USB flash drive.
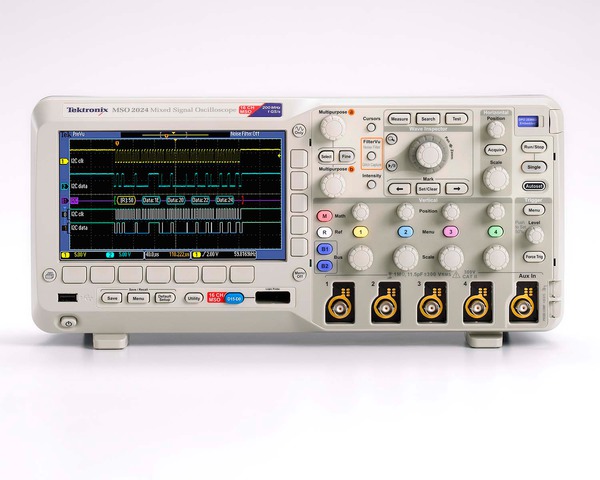
Bright, widescreen display
The MSO/DPO2000B Series features a 7 inch (180 mm) widescreen, TFT-LCD display for seeing intricate signal details.
Dedicated front-panel controls
Per-channel vertical controls provide simple and intuitive operation. No longer do you need to share one set of vertical controls across all four channels.
Connectivity
A USB host port on the front panel enables easy transfer of screenshots, instrument settings, and waveform data to a USB thumb drive. The rear panel contains a USB device port for controlling the oscilloscope remotely from a PC or for connecting a USB keyboard. The USB device port can also be used to print directly to a PictBridge®-compatible printer. An optional 10/100 Ethernet port enables easy connection to networks and an optional Video Out port allows the oscilloscope display to be exported to an external monitor or projector.
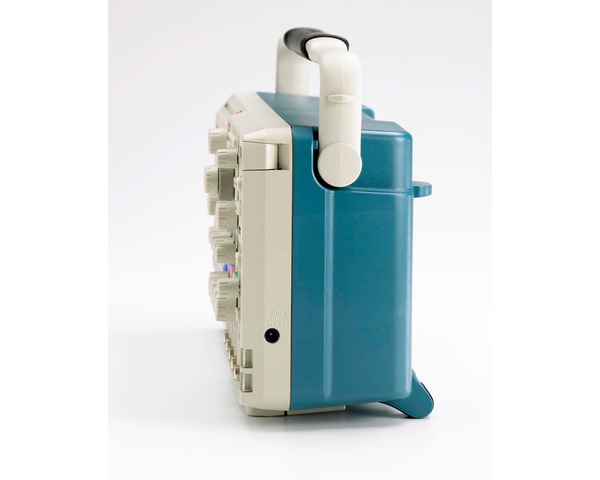
Compact form factor
A compact, portable form factor allows the MSO/DPO2000B Series to be easily moved between labs and, with a depth of just 5.3 inches (134 mm), it saves you valuable space on your test bench.
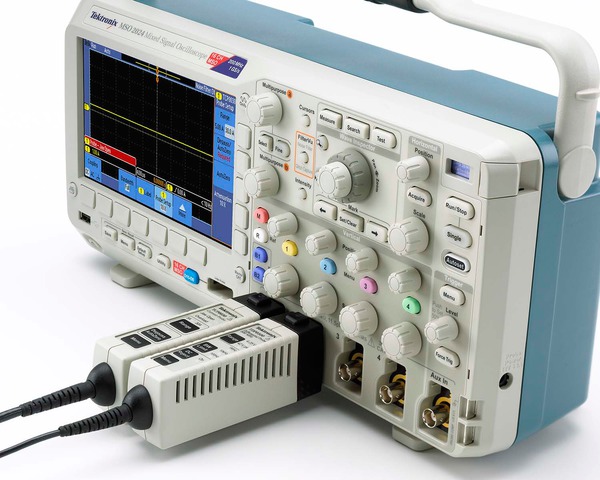
TekVPI® probe interface
The TekVPI probe interface sets the standard for ease of use in probing. TekVPI probes feature status indicators and controls, as well as a probe menu button right on the comp box itself. This button brings up a probe menu on the oscilloscope display with all relevant settings and controls for the probe. TekVPI probes can be controlled remotely through USB, GPIB, or Ethernet, enabling more versatile solutions in ATE environments.
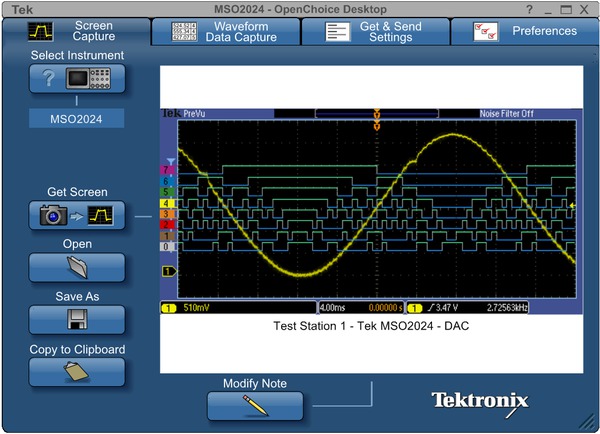
Extended analysis
Acquiring data and measurements from the MSO/DPO2000B Series is as simple as connecting a USB cable from the oscilloscope to your PC. Key software applications - OpenChoice® Desktop, and Microsoft Excel and Word toolbars - are included standard with each oscilloscope to enable fast and easy direct communication with your Windows PC.
For simple tasks, the included OpenChoice Desktop enables fast and easy communication between the oscilloscope and your PC through USB, GPIB, or LAN for transferring settings, waveforms, and screen images.
Specifications
All specifications are guaranteed unless noted otherwise. All specifications apply to all models unless noted otherwise.
Model overview
| MSO2002B and DPO2002B | MSO2004B and DPO2004B | MSO2012B and DPO2012B | MSO2014B and DPO2014B | MSO2022B and DPO2022B | MSO2024B and DPO2024B | |
|---|---|---|---|---|---|---|
| Analog channels | 2 | 4 | 2 | 4 | 2 | 4 |
| Bandwidth 3 | 70 MHz | 70 MHz | 100 MHz | 100 MHz | 200 MHz | 200 MHz |
| Rise time | 5 ns | 5 ns | 3.5 ns | 3.5 ns | 2.1 ns | 2.1 ns |
| Sample rate | 1 GS/s | 1 GS/s | 1 GS/s | 1 GS/s | 1 GS/s | 1 GS/s |
| Record length | 1 M points | 1 M points | 1 M points | 1 M points | 1 M points | 1 M points |
| Digital channels | MSO models - add 16 digital channels to the corresponding DPO model | |||||
Vertical system analog channels
- Hardware bandwidth limits
- 20 MHz
- Input coupling
- AC, DC, GND
- Input impedance
- 1 MΩ ±2%, 11.5 pF ±2 pF
- Input sensitivity range
- 2 mV/div to 5 V/div
- Vertical resolution
- 8 bits
- Maximum input voltage, 1 MΩ
- 300 VRMS with peaks ≤ ±450 V
- DC gain accuracy (with offset set to 0 V)
±3% for 10 mV/div to 5 V/div
±4% for 2 mV/div to 5 mV/div
- Channel-to-channel isolation
- (Any two channels at equal vertical scale)
MSO2002B, DPO2002B, MSO2004B, DPO2004B MSO2012B, DPO2012B, MSO2014B, DPO2014B MSO2022B, DPO2022B, MSO2024B, DPO2024B ≥100:1 at ≤70 MHz ≥100:1 at ≤100 MHz 100:1 at ≤200 MHz
- Offset range
Volts/div setting Offset range for 1 MΩ input 2 mV/div to 200 mV/div ±1 V >200 mV/div to 5 V/div ±25 V
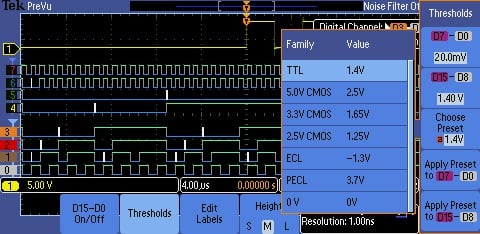
Vertical system digital channels
- Input channels
- 16 digital (D15 to D0)
- Thresholds
- Threshold per set of 8 channels
- Threshold selections
- TTL, CMOS, ECL, PECL, User-defined
- User-defined threshold range
- ± 20 V
- Threshold accuracy
- ±[100 mV + 3% of threshold setting]
- Maximum input voltage
- ± 40 V
- Input dynamic range
- 80 Vpk-pk (threshold setting dependent)
- Minimum voltage swing
- 500 mVp-p
- Input resistance
- 101 kΩ
- Probe loading
- 8 pF
- Vertical resolution
- 1 bit
Horizontal system analog channels
- Maximum duration of time captured at highest sample rate (all channels)
- 1 ms
- Time base range
200 MHz models: 2ns to 100s
70, 100 MHz models: 4ns to 100s
- Time-base delay time range
- -10 divisions to 5000 s
- Channel-to-channel deskew range
- ±100 ns
- Time base accuracy
- ±25 ppm over any ≥1 ms interval
Horizontal system digital channels
- Maximum sample rate (main)
When using any of channels D7 - D0
When using any of channels D8 - D15
1 GS/s (1 ns resolution) 500 MS/s (2 ns resolution)
- Maximum record length (main, all channels)
- 1 M points
- Minimum detectible pulse width
- 5 ns
- Channel-to-channel skew
- 2 ns typical
Trigger system
- Trigger modes
- Auto, Normal, and Single
- Trigger coupling
- DC, HF reject (attenuates >85 kHz), LF reject (attenuates <65 kHz), noise reject (reduces sensitivity)
- Trigger holdoff range
- 20 ns to 8 s
- Trigger sensitivity, typical
Trigger source Sensitivity Internal DC coupled 0.4 div from DC to 50 MHz
0.6 div > 50 MHz to 100 MHz
0.8 div > 100 MHz to 200 MHz
External (aux input) 200 mV from DC to 100 MHz, 1X attenuation
- Trigger level ranges
- Any input channel
- ±4.92 divisions from center of screen
- Aux Input (external trigger)
±6.25 V, 1X attenuation
±12.5 V, 10X attenuation
- Trigger types
- Edge
- Positive or negative slope on any channel or front-panel auxiliary input. Coupling includes DC, AC, HF reject, LF reject, and noise reject.
- Pulse Width
- Trigger on width of positive or negative pulses that are >, <, =, ≠, or inside/outside a specified period of time.
- Runt
- Trigger on a pulse that crosses one threshold but fails to cross a second threshold before crossing the first again.
- Logic
- Trigger when any logical pattern of channels goes false or stays true for specified period of time. Any input can be used as a clock to look for the pattern on a clock edge. Pattern (AND, NAND) specified for all input channels defined as High, Low, or Don’t Care.
- Setup and Hold
- Trigger on violations of both setup time and hold time between clock and data present on any of the analog and digital input channels.
- Rise/Fall Time
- Trigger on pulse edge rates that are faster or slower than specified. Slope may be positive, negative, or either.
- Video
- Trigger on all lines, odd, even, or all fields on NTSC, PAL, and SECAM video signals.
- I2C (optional)
- Trigger on Start, Repeated Start, Stop, Missing ACK, Address (7 or 10 bit), Data, or Address and Data on I2C buses up to 3.4 Mb/s.
- SPI (optional)
- Trigger on SS, MOSI, MISO, or MOSI and MISO on SPI buses up to 10.0 Mb/s.
- RS-232/422/485/UART (optional)
- Trigger on Tx Start Bit, Rx Start Bit, Tx End of Packet, Rx End of Packet, Tx Data, Rx Data, Tx Parity Error, and Rx Parity Error up to 10 Mb/s.
- CAN (optional)
- Trigger on Start of Frame, Frame Type (data, remote, error, overload), Identifier (standard or extended), Data, Identifier and Data, End of Frame, Missing ACK, or Bit Stuffing Error on CAN signals up to 1 Mb/s. Data can be further specified to trigger on ≤, <, =, >, ≥, or ≠ a specific data value. User-adjustable sample point is set to 50% by default.
- LIN (optional)
- Trigger on Sync, Identifier, Data, Identifier and Data, Wakeup Frame, Sleep Frame, Errors such as Sync, Parity, or Checksum Errors.
- Parallel (available on MSO models only)
- Trigger on a parallel bus data value.
Acquisition system
- Acquisition Modes
- Sample
- Acquire sampled values.
- Peak Detect
- Captures glitches as narrow as 3.5 ns at all sweep speeds.
- Averaging
- From 2 to 512 waveforms included in average.
- Roll
- Scrolls waveforms right to left across the screen at sweep speeds slower than or equal to 40 ms/div.
Waveform measurements
- Cursors
- Waveform and Screen.
- Automatic measurements
- 29, of which up to four can be displayed on-screen at any one time. Measurements include: Period, Frequency, Delay, Rise Time, Fall Time, Positive Duty Cycle, Negative Duty Cycle, Positive Pulse Width, Negative Pulse Width, Burst Width, Phase, Positive Overshoot, Negative Overshoot, Peak to Peak, Amplitude, High, Low, Max, Min, Mean, Cycle Mean, RMS, Cycle RMS, Positive Pulse Count, Negative Pulse Count, Rising Edge Count, Falling Edge Count, Area and Cycle Area.
- Gating
- Isolate the specific occurrence within an acquisition to take measurements on, using either the screen, or waveform cursors.
Waveform math
- Arithmetic
- Add, subtract, and multiply waveforms.
- FFT
- Spectral magnitude. Set FFT Vertical Scale to Linear RMS or dBV RMS, and FFT Window to Rectangular, Hamming, Hanning, or Blackman-Harris.
Software
- OpenChoice® Desktop
- Enables fast and easy communication between a Windows PC and your oscilloscope using USB or LAN. Transfer and save settings, waveforms, measurements, and screen images. Included Word and Excel toolbars automate the transfer of acquisition data and screen images from the oscilloscope into Word and Excel for quick reporting or further analysis.
- IVI driver
- Provides a standard instrument programming interface for common applications such as LabVIEW, LabWindows/CVI, Microsoft .NET, and MATLAB.
- e*Scope® Web-based remote control
- Enables control of the oscilloscope over a network connection through a standard web browser. Simply enter the IP address or network name of the oscilloscope and a web page will be served to the browser. Transfer and save settings, waveforms, measurements, and screen images or make live control changes to settings on the oscilloscope directly from the web browser.
Display system
- Display type
- 7 inch (180 mm) wide format liquid crystal TFT color display.
- Display resolution
- 480 horizontal × 234 vertical pixels (WQVGA).
- Waveform styles
- Vectors, Dots, Variable Persistence, Infinite Persistence.
- Graticules
- Full, Grid, Cross Hair, Frame.
- Format
- YT and XY.
- Maximum waveform capture rate
- Up to 5,000 wfm/s.
Input/output ports
- USB 2.0 high-speed host port
- Supports USB mass storage devices, printers, and keyboards. One port available on rear panel and one on front panel.
- USB 2.0 high-speed device port
- Rear-panel connector allows for communication/control of oscilloscope through USBTMC or GPIB with a TEK-USB-488, and direct printing to all PictBridge®-compatible printers.
- LAN port (Ethernet)
- RJ-45 connector, supports 10/100BASE-T (requires DPO2CONN).
- Video out port
- DB-15 female connector, connect to show the oscilloscope display on an external monitor or projector (requires DPO2CONN).
- Auxiliary input
- Front-panel BNC connector. Input Impedance 1 MΩ ±2%. Max input 300 VRMS CAT II with peaks ≤ ±450 V.
- Probe compensator output voltage and frequency
- Front-panel pins
- Amplitude
- 5 V
- Frequency
- 1 kHz
- Kensington-style lock
- Rear-panel security slot connects to standard Kensington-style lock.
Power source
- Power source voltage
- 100 to 240 V ±10%
- Power source frequency
45 to 65 Hz (90 to 264 V)
360 to 440 Hz (100 to 132 V)
- Power consumption
- 80 W maximum
- Optional TekVPI® external power supply
- Output voltage
- 12 V
- Output current
- 5 A
- Power consumption
- 50 W
Physical characteristics
- Dimensions
mm in. Height 180 7.1 Width 377 14.9 Depth 134 5.3
- Weight
kg lb. Net 3.6 7.9 Shipping 6.2 13.7
- Rackmount configuration
- 4U
- Cooling clearance
- 2 in. (50 mm) required on left side and rear of instrument
EMC, environment, and safety
- Temperature
- Operating
- 0 ºC to +50 ºC (+32 ºF to 122 ºF)
- Nonoperating
- -40 ºC to +71 ºC (-40 ºF to 160 ºF)
- Humidity
- Operating
High: 30 ºC to 50 ºC, 5% to 60% relative humidity
Low: 0 ºC to 30 ºC, 5% to 95% relative humidity
- Nonoperating
High: 30 ºC to 55 ºC, 5%to 60% relative humidity
Low: 0 ºC to 30 ºC, 5% to 95% relative humidity
- Altitude
- Operating
- 3,000 meters (9,843 feet)
- Nonoperating
- 12,000 meters (39,370 feet)
- Random vibration
- Operating
- 0.31 GRMS from 5 to 500 Hz, 10 minutes each axis, 3 axes, 30 minutes total
- Nonoperating
- 2.46 GRMS from 5 to 500 Hz, 10 minutes each axis, 3 axes, 30 minutes total
- Regulatory
- Electromagnetic compatibility
- EC Council Directive 2004/108/EC
- Safety
- UL61010-1:2004; CAN/CSA-C22.2 No. 61010.1: 2004; EN61010-1:2001; complies with the Low Voltage Directive 2004/108/EC for Product Safety.
Ordering information
MSO/DPO2000B family
- DPO2002B
- 70 MHz, 1 GS/s, 1 M record length, 2-channel digital phosphor oscilloscope
- DPO2004B
- 70 MHz, 1 GS/s, 1 M record length, 4-channel digital phosphor oscilloscope
- DPO2012B
- 100 MHz, 1 GS/s, 1 M record length, 2-channel digital phosphor oscilloscope
- DPO2014B
- 100 MHz, 1 GS/s, 1 M record length, 4-channel digital phosphor oscilloscope
- DPO2022B
- 200 MHz, 1GS/s, 1 M record length, 2-channel digital phosphor oscilloscope
- DPO2024B
- 200 MHz, 1 GS/s, 1 M record length, 4-channel digital phosphor oscilloscope
- MSO2002B
- 70 MHz, 1 GS/s, 1 M record length, 2+16 channel mixed-signal oscilloscope
- MSO2004B
- 70 MHz, 1 GS/s, 1M record length, 4+16 channel mixed-signal oscilloscope
- MSO2012B
- 100 MHz, 1 GS/s, 1M record length, 2+16 channel mixed-signal oscilloscope
- MSO2014B
- 100 MHz, 1GS/s, 1M record length, 4+16 channel mixed-signal oscilloscope
- MSO2022B
- 200 MHz, 1 GS/s, 1M record length, 2+16 channel mixed-signal oscilloscope
- MSO2024B
- 200 MHz, 1 GS/s, 1 M record length, 4+16 channel mixed-signal oscilloscope
Standard accessories
Probes
- TPP0200
- 200 MHz, 10x passive probe (one per analog channel) for 100 and 200 MHz models
- TPP0100
- 100 MHz, 10x passive probe (one per analog channel) for 70 MHz models
- P6316 (MSO models only)
- 16-channel logic probe and accessory kit (one per instrument)
Accessories
- 063-4472-xx
- Documentation CD
- 016-2008-xx (MSO models only)
- Accessory pouch
- 071-3078 -xx
- Installation and safety manual
- —
- Power cord
- —
- OpenChoice Desktop software
- —
- Calibration certificate documenting traceability to National Metrology Institute(s) and ISO9001 quality system registration
Warranty
Five-year warranty covering all parts and labor, excluding probes.
Application modules
- DPO2BND
- Application bundle module option that contains the DPO2AUTO, DPO2COMP, DPO2EMBD application modules. Save money when multiple serial bus debug and analysis application modules are required.
- DPO2AUTO4
- Automotive Serial Triggering and Analysis Module. Enables triggering on packet-level information on CAN bus and LIN bus as well as analytical tools such as digital views of the signal, bus views, packet decoding, search tools, and packet decode tables with time stamp information.
- DPO2COMP4
- Computer Serial Triggering and Analysis Module. Enables triggering on packet-level information on RS-232/422/485/UART buses as well as analytical tools such as digital views of the signal, bus views, packet decoding, search tools, and packet decode tables with time stamp information.
- DPO2EMBD
- Embedded Serial Triggering and Analysis Module. Enables triggering on packet-level information on I2C and SPI buses as well as analytical tools such as digital views of the signal, bus views, packet decoding, search tools, and packet decode tables with time stamp information. Only two-wire SPI support is available on two-channel models.
Instrument options
Power cord and plug options
Please specify power plug version when ordering.
- Opt. A0
- North America power plug (115 V, 60 Hz)
- Opt. A1
- Universal Euro power plug (220 V, 50 Hz)
- Opt. A2
- United Kingdom power plug (240 V, 50 Hz)
- Opt. A3
- Australia power plug (240 V, 50 Hz)
- Opt. A5
- Switzerland power plug (220 V, 50 Hz)
- Opt. A6
- Japan power plug (100 V, 50/60 Hz)
- Opt. A10
- China power plug (50 Hz)
- Opt. A11
- India power plug (50 Hz)
- Opt. A12
- Brazil power plug (60 Hz)
- Opt. A99
- No power cord
Language options4, 5
- Opt. L0
- English front panel overlay
- Opt. L1
- French front panel overlay
- Opt. L2
- Italian front panel overlay
- Opt. L3
- German front panel overlay
- Opt. L4
- Spanish front panel overlay
- Opt. L5
- Japanese front panel overlay
- Opt. L6
- Portuguese front panel overlay
- Opt. L7
- Simplified Chinese front panel overlay
- Opt. L8
- Traditional Chinese front panel overlay
- Opt. L9
- Korean front panel overlay
- Opt. L10
- Russian front panel overlay
- Opt. L99
- No manual
Language options include translated front-panel overlay for the selected language(s).
Service options
- Opt. D1
- Calibration Data Report
Recommended accessories
Probes
Tektronix offers over 100 different probes to meet your application needs. For a comprehensive listing of available probes, please visit www.tek.com/probes.
- ADA400A
- 100X, 10X, 1X, 0.1X high-gain differential amplifier7, 8
- P5100A
- 2.5 kV, 500 MHz, 100X high-voltage passive probe
- TAP1500
- 1.5 GHz TekVPI active voltage probe 8
- TCP0020
- 50 MHz TekVPI 20 Ampere AC/DC current probe8
- TCP0030A
- 120 MHz TekVPI 30 Ampere AC/DC current probe8
- TCP0150
- 20 MHz TekVPI 150 Ampere AC/DC current probe8
- TCP2020
- 50 MHz 20 Ampere AC/DC current probe
- TCPA300/400
- Current measurement systems amplifier 9
- TCP305A
- DC to 50 MHz 50 Ampere current probe for use with TCPA300
- TCP404XL
- DC to 2 MHz 500 Ampere current probe for use with TCPA400
- TDP0500
- 500 MHz TekVPI differential voltage probe with ±42 V differential input voltage810
- THDP0200
- ±1.5 kV 200 MHz high-voltage differential probe8
- THDP0100
- ±6 kV 100 MHz high-voltage differential probe8
- TMDP0200
- ±750 V 200 MHz high-voltage differential probe8
Accessories
- DPO2CONN
- Adds Ethernet (10/100Base-T) and video out port
- 077-0737-xx
- Service manual (English only) PDF-only, downloadable from www.tek.com/manual/downloads
- TPA-BNC
- TekVPI to TekProbe BNC adapter
- TEK-DPG
- TekVPI Deskew pulse generator signal source
- 067-1686-xx
- Power measurement deskew and calibration fixture
- 196-3508-xx
- Digital Probe Leadset (8 channels)
- 119-8726-xx
- TekVPI external power supply (power cord not included; an appropriate power cord for the country of use must be ordered separately.)
- TEK-USB-488
- GPIB-to-USB adapter
- ACD2000
- Soft transit case
- 200-5045-xx
- Front protective cover
- HCTEK4321
- Hard transit case (requires ACD2000)
3 Bandwidth is 20 MHz at 2 mV/div, all models.
4 The DPO2AUTO and DPO2COMP applications modules are available only as part of the DPO2BND package.
5 User manuals (PDF) in 11 languages are available on the CD and for download from http://www.tek.com/manual/downloads. There are no printed user manuals.
6 The English option includes a front-panel label on the instrument. The other language options include a front-panel overlay.
7 Requires TPA-BNC adapter.
8 To use this probe on a MSO/DPO2000B, the oscilloscope requires an TekVPI external power supply (119-8726-xx), one per oscilloscope, and an appropriate power cord for county of use.
9 Requires 50 Ω feed through termination between the oscilloscope input and the BNC cable.
10 Probes terminate into 50 Ω but oscilloscope will automatically adjust to account for 1 MΩ input.

Tektronix is ISO 14001:2015 and ISO 9001:2015 certified by DEKRA. Product(s) complies with IEEE Standard 488.1-1987, RS-232-C, and with Tektronix Standard Codes and Formats. 3GW-28413-9

