What is a Spectrogram?
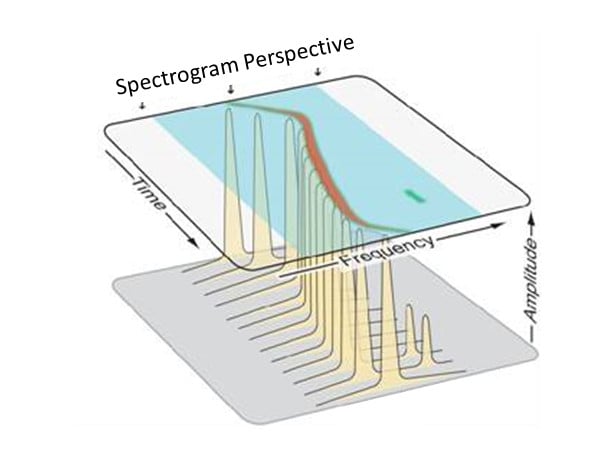
A spectrogram is a graphic that shows the viewer how the frequency domain content (spectral content) of a signal or signals is changing or progressing over time. It consists of a collection of spectrum traces that are collected/processed over time and stacked next to each other, much like slices of bread in a loaf. While each individual spectrum trace would be on the “butter side” of each slice, the viewer’s perspective for the spectrogram is looking down at the top of the loaf. The top “crust” of each slice is color coded from end to end to represent the amplitude/magnitude variations across the frequency span of the spectrum trace. With the slices stacked together, and the color-coded amplitude across the span, it is easy to observe the static, dynamic and transient nature of the spectral activity over time (from the first slice through to the last).
The spectrogram is drawn as a two-dimensional plot where the horizontal axis represents the frequency span of the spectral content, and the vertical axis represents time. The plot is filled with rows of colored pixels, with each row representing a spectrum “slice”, and the individual pixel color representing the magnitude of the trace at each point across the frequency span of the trace. The vertical time-domain axis can be configured such that the most recent spectral trace (slice) occurs at the top of the display and the “older” slices cascade below it. This is often called a waterfall display since new spectral traces appear at the top and then scroll down towards the bottom as time marches on. When the time axis is reversed, with the newest spectral traces appear at the bottom, this is called a reverse-waterfall configuration.
How a Spectrogram is Processed
Most all spectrograms are composed of spectrum traces that are based on raw data collected over time and computed using some form of discrete Fourier Transform – often a Fast Fourier Transform (FFT) or Chirp-Z Transform (CZT). Regardless of the transform used, the time-duration of acquired data used for each FFT/CZT is called the “spectrum-time”. The spectrum-time is inversely proportional to the frequency resolution, or Resolution Bandwidth (RBW) of the spectrum traces. Narrower RBW settings lead to longer spectrum times. For example, a spectrum trace with a 100 kHz RBW may require a spectrum-time (acquisition length) of 22.3 mS, while an RBW of 10 kHz would require a spectrum time of 223 mS. It is helpful to understand the concept of spectrum-time when it comes to looking at how spectrograms are built.
Spectrogram Types
There are two main types of spectrograms – the discontinuous type, and the continuous type. These two types refer to how the data is acquired, processed and displayed in the spectrogram.
Discontinuous Type
The first type of spectrogram is the discontinuous type. The spectrum “slices” in a discontinuous spectrogram are added one at a time, with each “slice” coming from a new acquisition of data. Essentially, a “spectrum-time’s” worth of data is acquired, an FFT is performed to create the spectrum trace, and it is added to the spectrogram. This process is repeated to eventually add more and more slices to the spectrogram. The discontinuous type of spectrogram may best be described as a “strip-chart recording” of the spectral history. There will be time-gaps between each of the spectrum slices in the spectrogram. The duration of the time gap will be a function of many things, including trigger interval, acquisition length, processing time, RBW setting, etc. A discontinuous spectrogram is best suited to observing relatively long-term trends and changes in spectral activity.
Continuous Type
The second type of spectrogram is the continuous type. This type of spectrogram is built from a single, time-seamless acquisition record rather than from multiple consecutive acquisitions. The continuous spectrogram is only available when the acquisition length exceeds the spectrum length (or spectrum time). Once this condition is met, the spectrogram slices are generated by moving the FFT spectrum-time through the seamless acquisition record, computing spectrums at regular intervals along the way to fill in the slices in the spectrogram. In most cases, this means that consecutive FFT results may be computed from time-domain data that was included in the adjacent FFT results. This is known as “overlap”. As the amount of overlap is increased, the number of individual spectrum slices within a given time period is also increased. In some implementations, the amount of overlap used is computed automatically to fill the available spectrogram area. Other implementations give the user the ability to adjust the overlap in order to achieve a desired spectrum slice-to-slice time interval. How often or how quickly the spectral content changes, as well as the overall acquisition length, will dictate what level of overlap might be most useful. More overlap gives you a shorter time interval between each spectrum slice and increases the number of slices in a given time period. The downside with high levels of overlap is “smearing” in the vertical (time domain axis) of the spectrogram, because the same time-domain samples are used in adjacent spectrum slices.
How to Read a Spectrogram
Reading a spectrogram involves understanding how time, frequency, and amplitude are visually represented. Typically, the horizontal axis shows time, the vertical axis shows frequency, and the color intensity indicates amplitude or power. Warmer colors (such as red or yellow) usually represent higher amplitude, while cooler colors (like blue or green) indicate lower amplitude.
To interpret a spectrogram:
- Identify Frequency Components: Look vertically to see what frequencies are present at a specific time.
- Track Changes Over Time: Observe horizontal patterns to see how frequencies evolve or remain constant.
- Amplitude Patterns: Color changes show how strong or weak a signal is at any frequency over time.
- Transient Events: Sudden changes or bursts in frequency appear as brief color shifts, useful for spotting anomalies or short-term events.
Understanding these visual cues allows users to diagnose signal behavior, detect interference, or observe modulation patterns with precision.
Common Applications of Spectrograms
Spectrograms are widely used across various industries due to their ability to visualize complex signal behavior. Some key applications include:
- Telecommunications: Monitor signal quality, detect noise, and analyze spectrum usage.
- Radar and Military: Identify and track objects through signal reflections, detect jamming or stealth behavior.
- Audio Analysis: Visualize speech, music, or environmental sounds for editing, filtering, or speech recognition.
- Biomedical Engineering: Analyze EEG, ECG, or ultrasound signals to detect abnormalities or track physiological patterns.
- Mechanical Diagnostics: Monitor machine vibrations and detect faults in rotating equipment using frequency signatures.
- Education and Research: Teach signal processing concepts, illustrate modulation techniques, or analyze experimental data.
Each application benefits from the ability of spectrograms to provide time-resolved frequency insight, making them essential tools in both research and industry.
Spectrograms on Tektronix Oscilloscopes and Analyzers
Spectrograms are available in a number of different Tektronix hardware and software platforms. Each platform has its own particular characteristics for the spectrograms.
MDO
The MDO, or Mixed Domain Oscilloscopes, include the 3 Series MDO as well as the older MDO3000 and MDO4000 series instruments. In all of these instruments, the spectrogram offered is the discontinuous type (built one slice per acquisition) using the reverse-waterfall configuration (newest spectrum slices at the bottom). Given the discontinuous spectrogram type, there is no ability to correlate spectral activity in the body of the spectrogram with other time-domain events in the acquisition. This spectrogram essentially serves a long-term spectral activity monitoring function.

Tektronix 3 Series MDO Oscilloscope
The Tektronix 3 Series MDO bench oscilloscope is suited for applications from testing your baseband design for IoT or just for simple EMI sniffing.
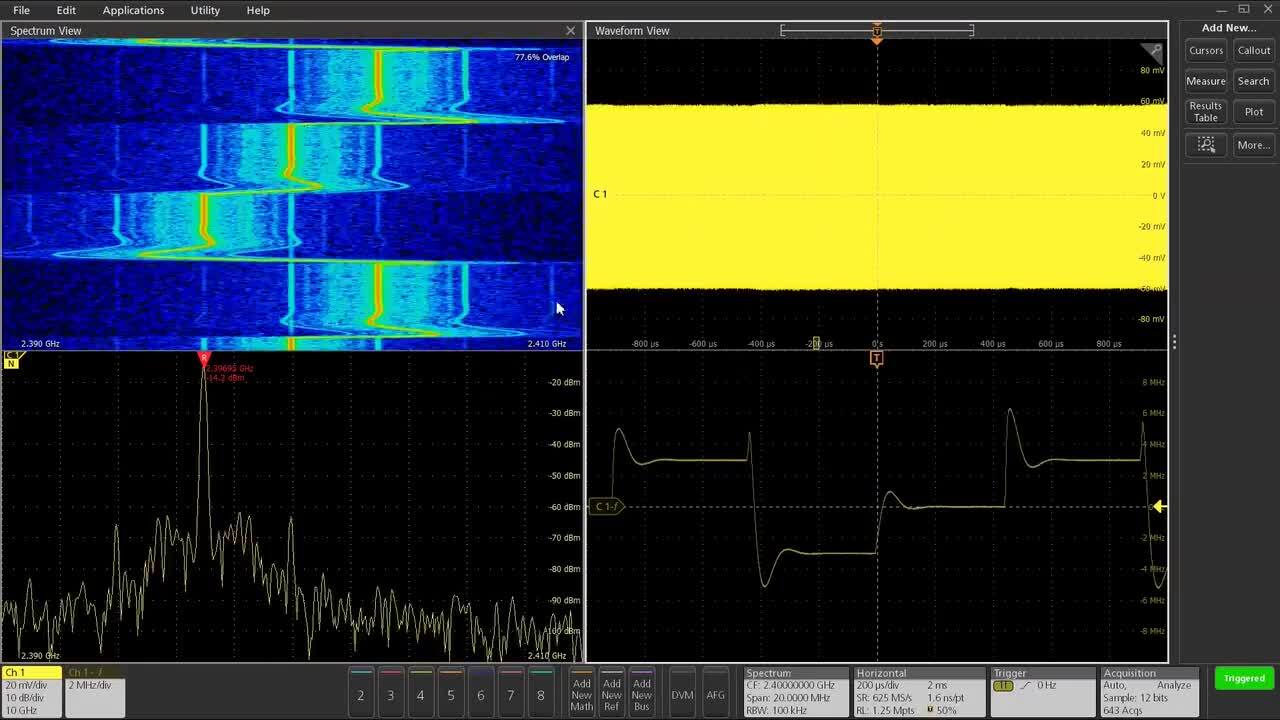
Spectrum View
The 4, 5 and 6 Series MSO instruments include spectrograms as part of the Spectrum View SV-RFVT option (the RF vs. Time option). This spectrogram is the continuous type, using the waterfall configuration (newest slices at the top). The scope acquisition must be longer than the spectrum-time in order for the spectrogram to function. Spectrum View will automatically adjust the FFT overlap so that the spectrogram fills the allocated display area. If the spectrogram display area is adjusted, the overlap will adjust accordingly to fill the new area. Similarly, if the time-domain area is zoomed-in, the spectrogram will automatically adjust the overlap to show the activity in the zoomed area. This implementation ensures that the time-seamless spectrogram is always time correlated to all of the time-domain waveforms and displays, which makes it easy to correlate specific spectral events to other time-domain activity across all channels. Cursor functionality is enhanced, providing the ability to view the spectral “slice” at each of the two cursor locations. Together with the normal spectrum time position, spectral activity from three distinct locations in time can be simultaneously displayed and compared. This functionality is available on every channel.

Tektronix 4 Series B MSO Mixed Signal Oscilloscope
Learn more about the Tektronix 4 Series mixed signal oscilloscope. With the largest display and channel count in its class the 4 Series represents a giant evolution in bench-friendly oscilloscopes.
Tektronix 5 Series B MSO Mixed Signal Oscilloscope
The 5 Series Mixed Signal Oscilloscope (MSO) provides FlexChannel technology enabling each channel input to be used as a single analog channel, eight digital logic inputs or simultaneous analog and spectrum views.
Tetrkonix 6 Series B MSO Mixed Signal Oscilloscope
The 6 Series Mixed Signal Oscilloscope (MSO) has the signal fidelity needed for analyzing and debugging embedded systems together with a touchscreen user interface and up to 8 FlexChannel® inputs that let you measure one analog or eight digital signals per channel.
Watch Spectrogram Feature of Spectrum View
See how you can get more insight to transient and dynamic behavior of the spectral content of your signals. Using the new spectrogram feature, an enhancement of the RF vs time option for Spectrum View in the 4 / 5 / 6 Series MSO oscilloscopes, gives you a seamless view of the spectral changes of your signal over time.
SignalVu/RSA
The Tektronix Realtime Spectrum Analyzers (RSAs), as well as the SignalVu-PC application which can work with the USB-RSAs as well as the MDO4000B/C and 5/6 Series MSOs, all feature a spectrogram display as a standard feature. This spectrogram can function as both discontinuous and continuous type. When the acquisition/analysis length is shorter than 2x the spectrum-time, or the span is greater than the realtime bandwidth, the spectrogram operates in discontinuous mode. When the acquisition/analysis length exceeds twice the spectrum-time, then the continuous mode is added. As more acquisitions are made, the continuous spectrograms from the previous acquisitions are stacked up in the spectrogram, much like the discontinuous type. In other words, these products give you a history record of the continuous spectrograms. The FFT overlap for the continuous spectrogram is under the user’s control in this platform. When large amounts of overlap are used, resulting in the number of spectrum slices exceeding the available display area, a scroll bar is added to allow the user to navigate to any desired area in the spectrogram.

Spectrum Analyzers and Signal Vu
Tektronix Real-time Spectrum Analyzers (RSAs) and SignalVu analysis software enable accurate and reliable real-time RF measurements.
Need help deciding between an oscilloscope with Spectrum View and a real-time analyzer? Let our team guide you to the instrument that best fits your needs.