Several months back, we added a new kind of frequency analysis capability called “Spectrum View” to our 5 and 6 Series Mixed Signal Oscilloscopes. I posted a two-part article called “A New Approach to Frequency Analysis on Oscilloscopes” Part 1 and Part 2, explaining the differences between this approach and run-of-the-mill oscilloscope FFTs. Since then a couple of things have happened.
- Tek released our new 4 Series MSO. It offers a Spectrum View option, bringing this capability into scopes around a $10,000 price point.
- We released new firmware for the 4, 5 and 6 Series, including RF vs. Time waveform capabilities
This blog will explain what these new waveforms are, and what they can do for you.
RF vs. Time Waveforms Defined
In short, RF vs. Time waveforms show how key characteristics of an RF signal vary over the entire acquisition of the oscilloscope. Three types of waveforms are available:
- Magnitude – The instantaneous magnitude of the spectrum vs. time
- Frequency – The instantaneous frequency of the spectrum relative to the center frequency vs. time
- Phase – The instantaneous phase of the spectrum relative to the center frequency vs. time
All three can be displayed at the same time and each of these traces can be turned on and off independently.
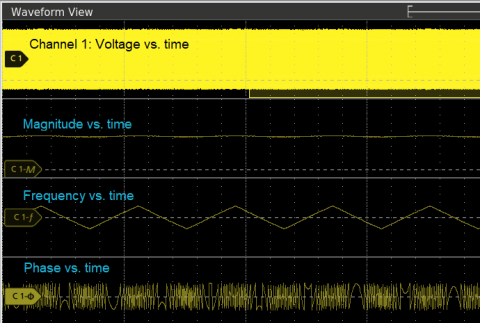
Let’s use the example of a spread-spectrum clock starting up. Each of the screen captures below shows the three traces and how you can dive into the waveforms to gain information about the startup. The Spectrum View is at the top of the screens. There are four time-domain waveforms shown in the Waveform View in each screen capture. From top to bottom:
- Analog view of the clock signal (traditional voltage vs. time trace)
- RF Magnitude vs. Time waveform
- RF Frequency vs. Time waveform
- RF Phase vs. Time waveform
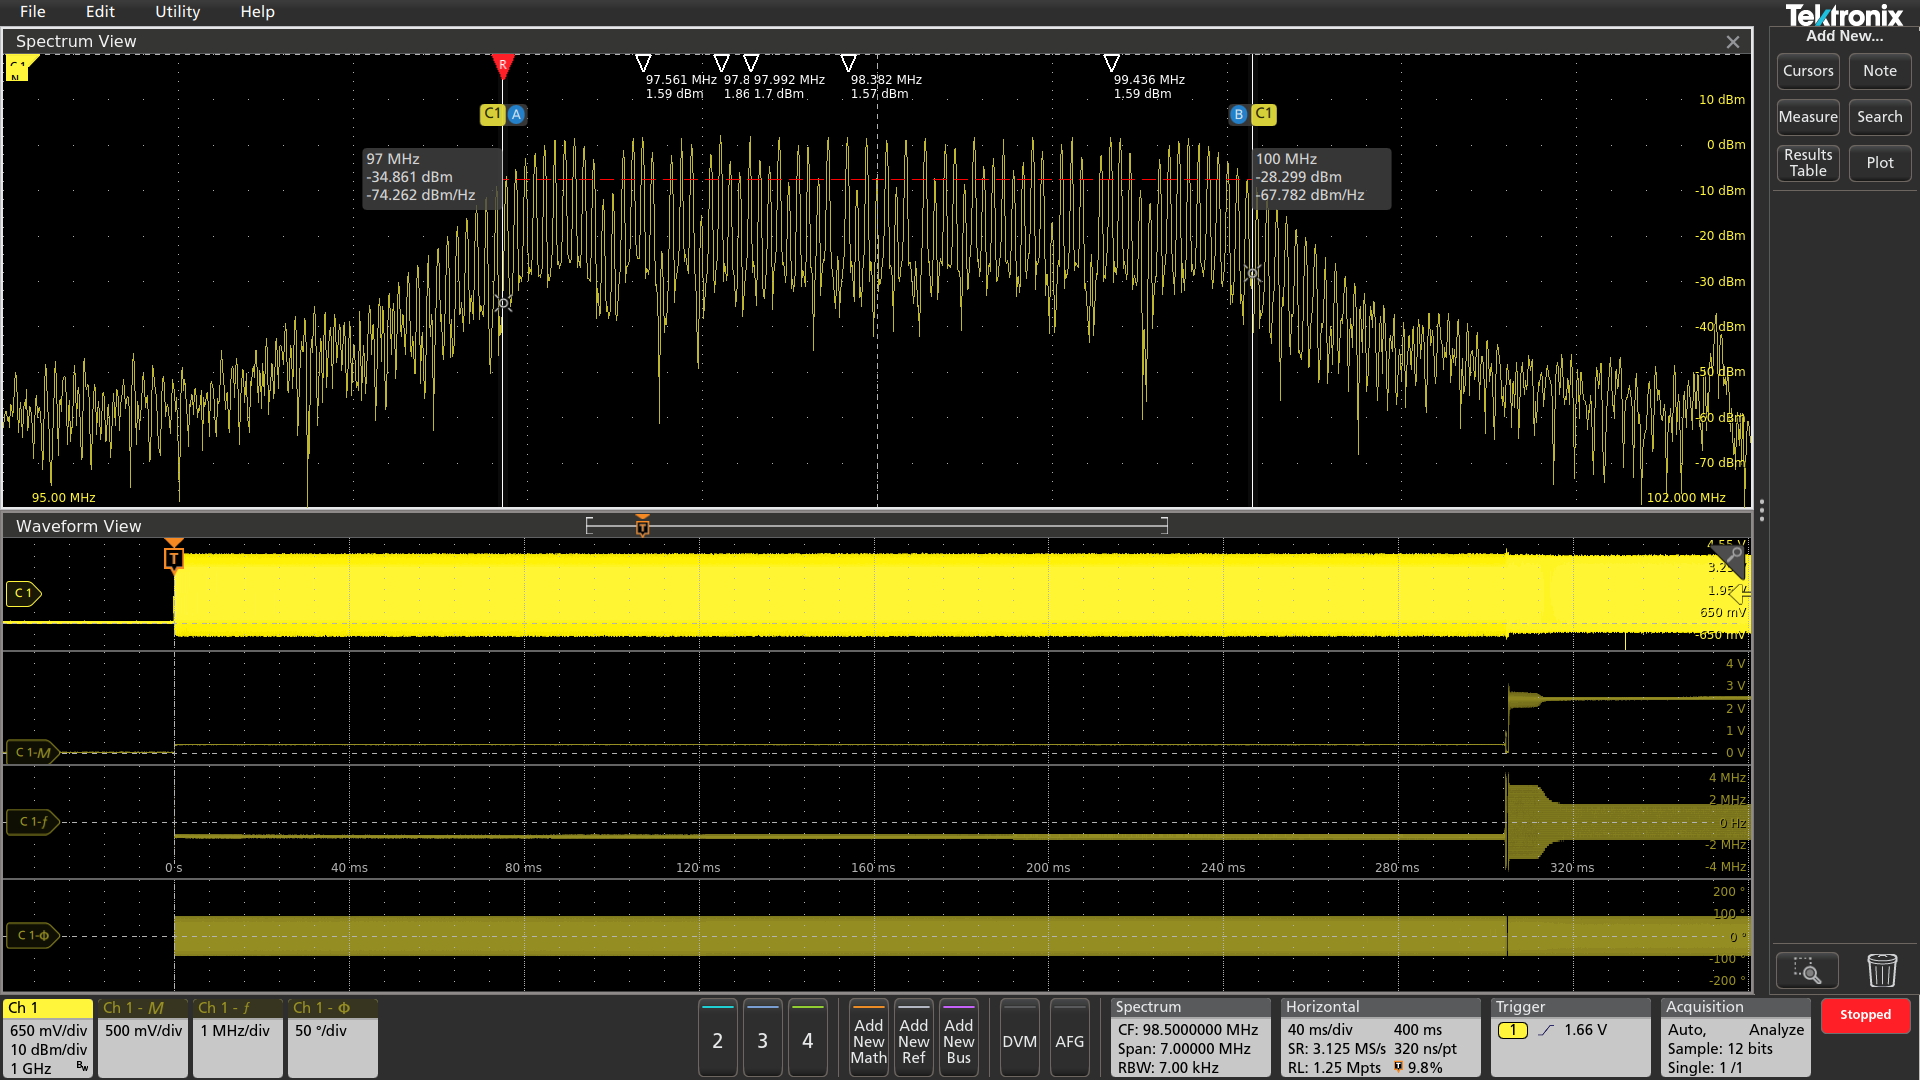
Let’s break down the clock startup sequence. The screen above shows the entire turn- on. Again, from top to bottom:
- The trigger (orange “T”) is based on the voltage vs time trace
- Concurrent with the trigger, the Magnitude vs. Time trace shows the clock turning on at a very low level
- The Frequency vs. Time trace shows the signal staying at a single frequency
- The Phase vs. Time trace is at the bottom, but we’ll focus on the others for this example
At roughly 300 ms after the trigger, we start to see the amplitude of the signal increase significantly and meaningful frequency modulation beginning. Let’s take a closer look.
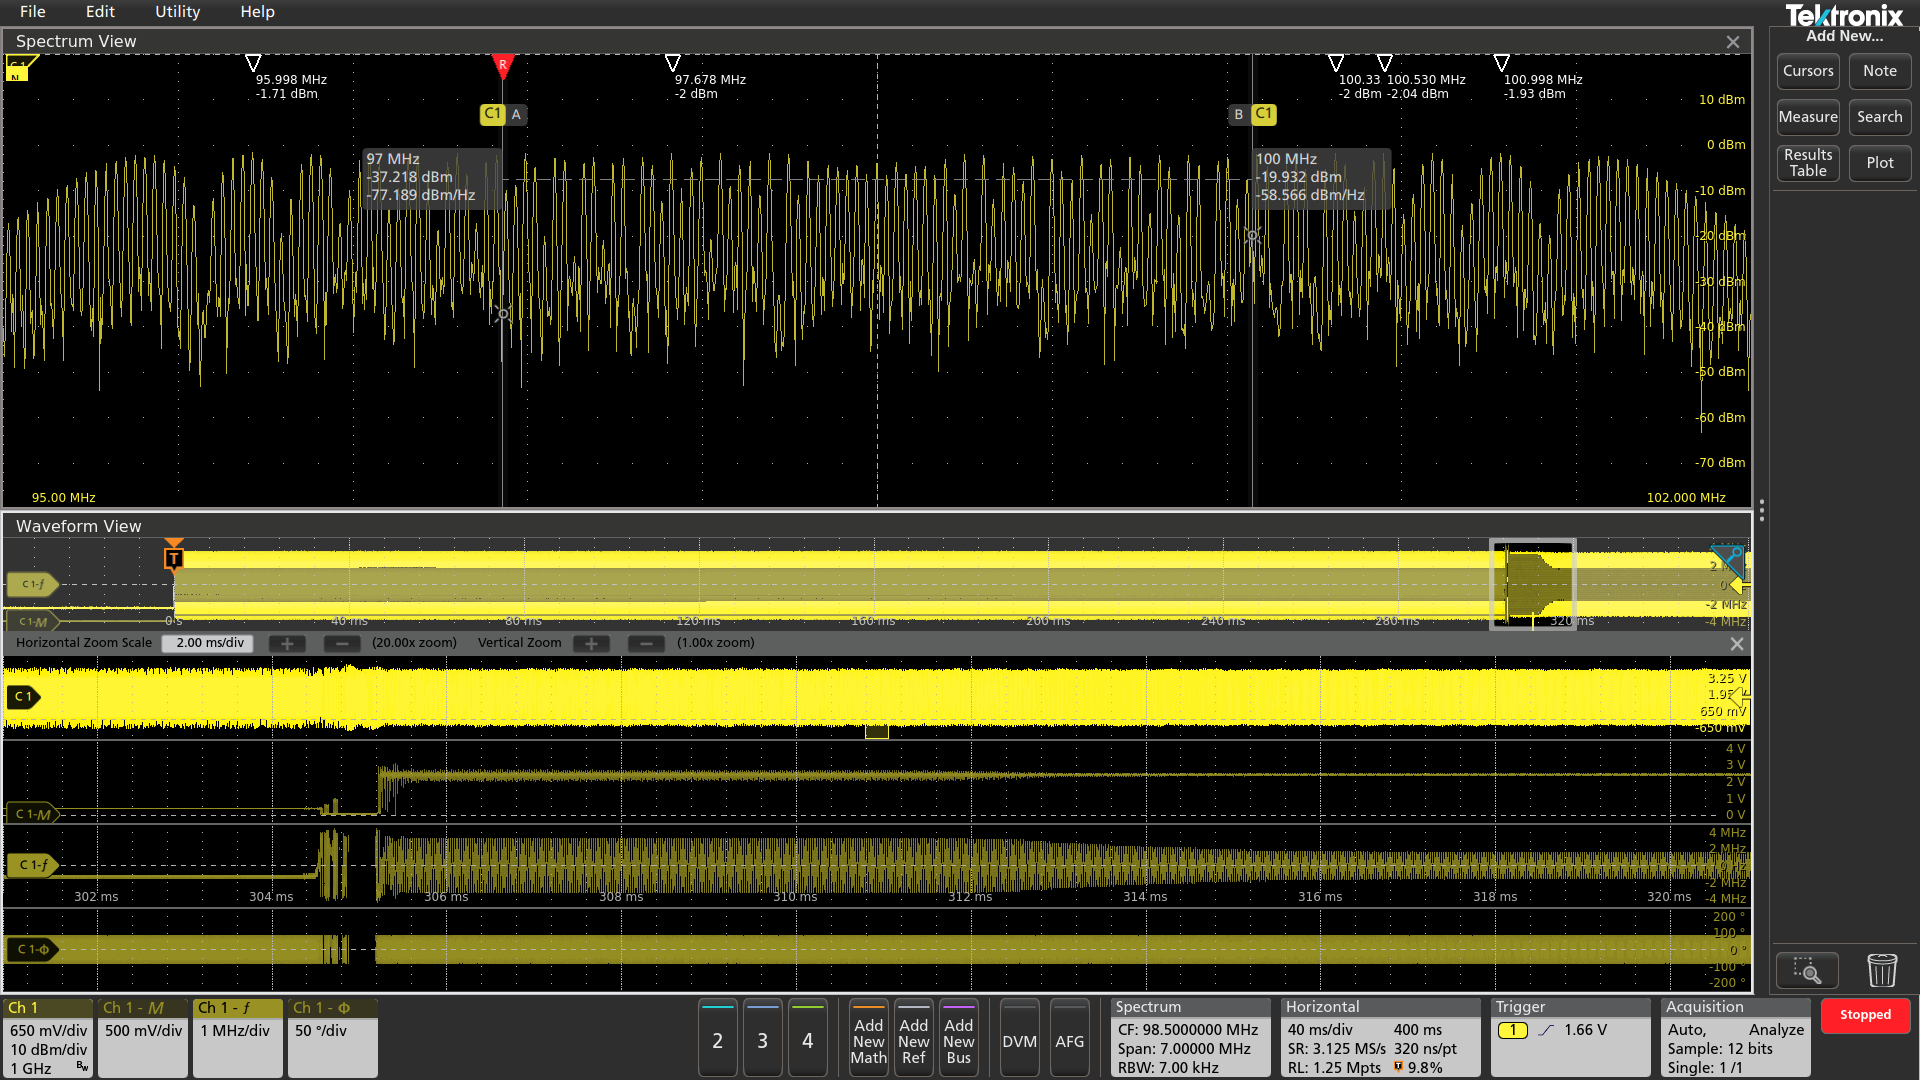
We’ve zoomed in on the period of interest (roughly 300-320 ms after the trigger event). The gray box toward the right side of the Waveform View shows the zoom area. We can clearly see the amplitude fluctuating and the frequency changing over a wide range. The higher-than-nominal frequency modulation is apparent in both the spectrum view at the top of the display, and the frequency vs. time waveform.
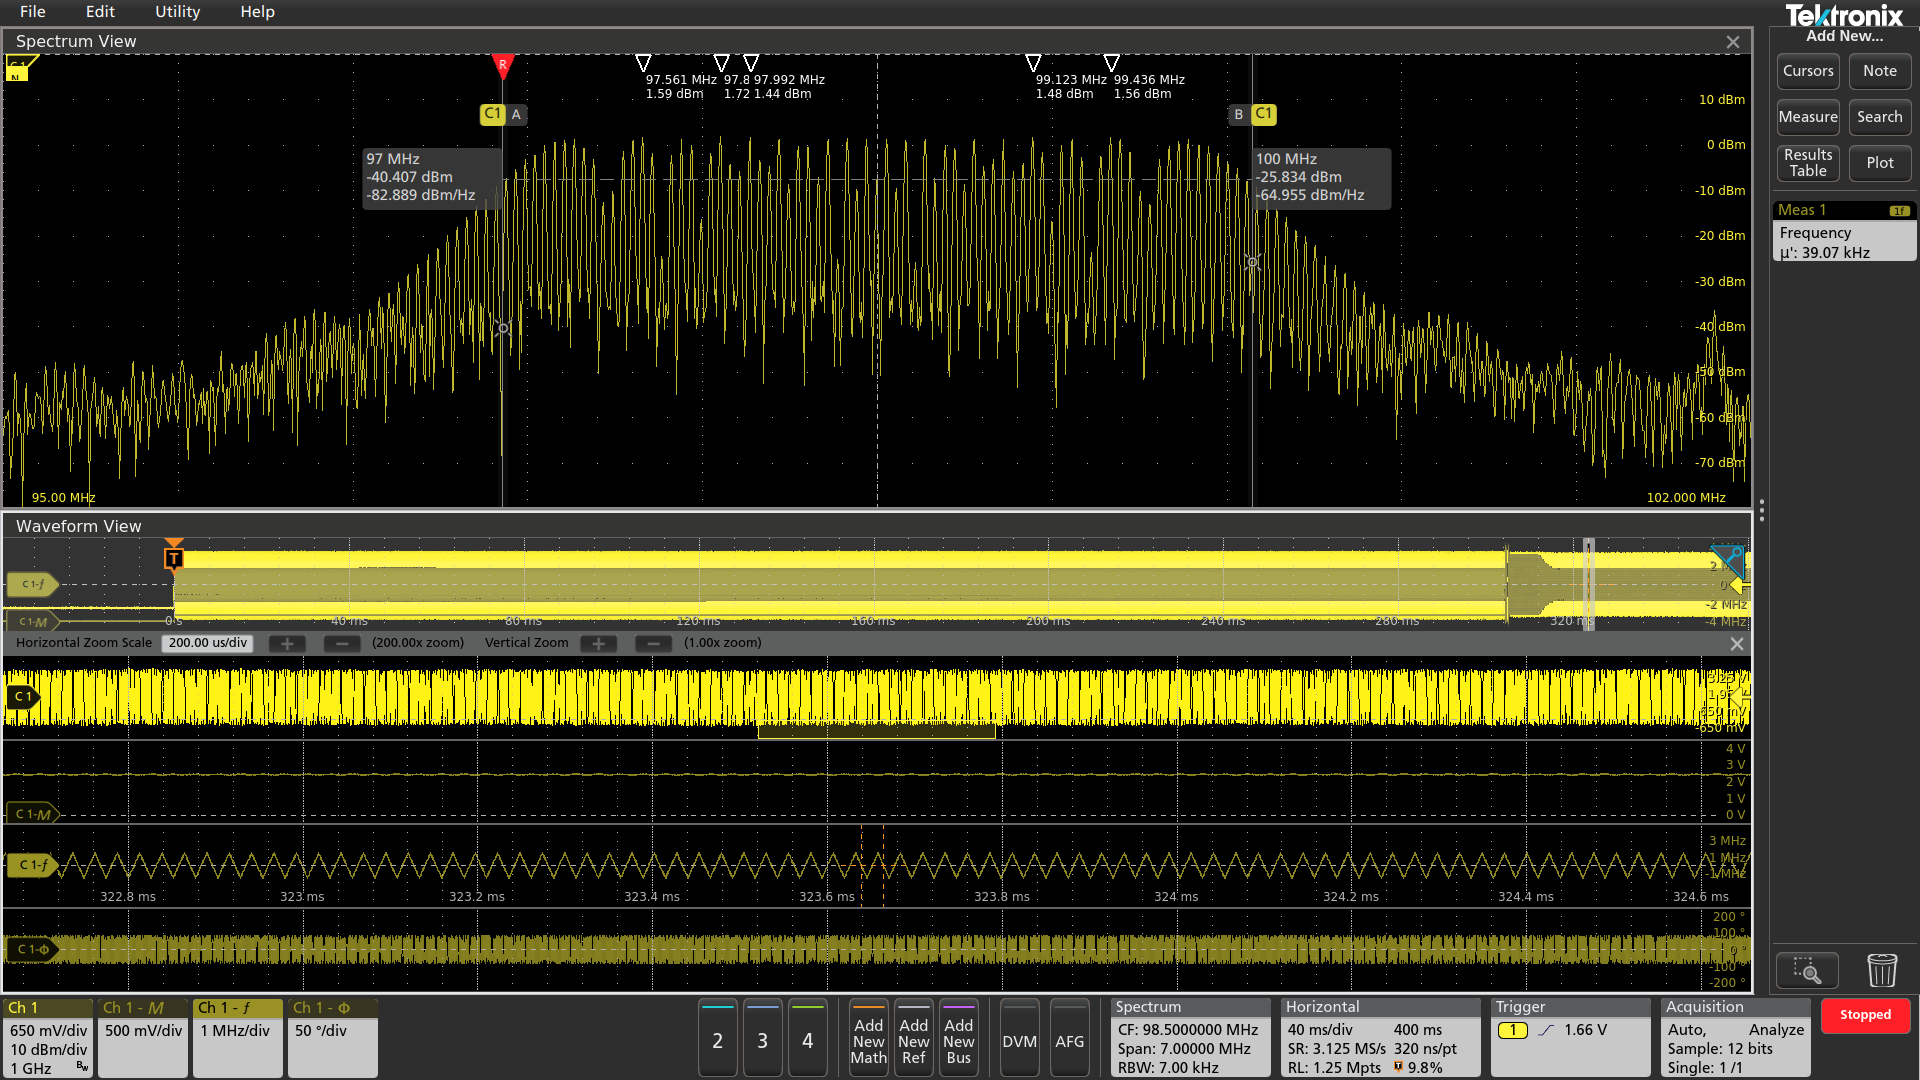
We’ve zoomed in even further in the area where the clock stabilizes, around 324 ms after the trigger. Now we can clearly see the triangular frequency modulation and can add an automatic measurement to determine the modulation rate of 39.07 kHz.
This example shows how these new RF vs. Time waveforms can be used to build a thorough understanding of signal relationships. The waveforms are similar to plots found on the MDO4000C, which was the first oscilloscope to offer synchronized, multi-domain views. Ever since, engineers have been using RF vs. Time plots to understand cause and effect relationships between RF activity, baseband, and processor signals. In other words, they make a big difference for troubleshooting.
For a more thorough explanation of Spectrum View, download the application note, Spectrum View: A New Approach to Frequency Domain Analysis on Oscilloscopes.
To learn about the differences between Spectrum View and traditional oscilloscope FFTs, take a look at Part 1 and Part 2.