As discussed in Part 1 of this blog series, the ability to perform spectral analysis on an oscilloscope is limited due to the inherent tradeoffs of FFTs. Overcoming these tradeoffs was a key design goal for Spectrum View. This new capability was made available on 5 and 6 Series MSOs with a recently released firmware upgrade.
To understand how Spectrum View works, it is important to note that digital oscilloscopes generally run their analog-to-digital converters (ADC) at the maximum sample rate. The stream of ADC samples is then sent to a decimator that keeps every Nth sample. At the fastest sweep speeds, all samples are kept. At slower sweep speeds, it’s assumed the user is looking at slower signals and a fraction of the ADC samples are kept. In short, the purpose of the decimator is to keep the record length as small as possible while still providing adequate sample rate to view signals of interest in the time domain.
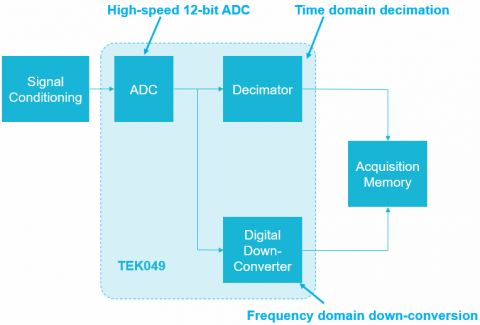
In the 5 and 6 Series MSOs, behind each FlexChannel input is a 12-bit ADC inside a custom ASIC called the TEK049. As shown below 6, each ADC sends high-speed digitized data down two paths. One path leads to hardware decimators which determine the rate at which time domain samples are stored. The second path leads to digital down-converters (DDC) also implemented in hardware. This approach enables independent control of the time domain and frequency domain acquisitions, allowing optimization of both waveform and spectrum views of a given signal. It also makes much more efficient use of the long but finite record length available in these instruments.
Digital down converters implemented on the custom TEK049 ASIC are what enable simultaneous waveform and spectrum views with independent controls in the Tektronix 5 and 6 Series MSOs.
To illustrate the process, let’s consider the 900 MHz measurement scenario discussed in Part 1, but with the hardware digital downconverter added into the acquisition process.
The total time acquired still determines the resolution in the frequency domain. We also still need to apply an FFT window and acquire data for 19 ms. In the TEK049, the ADC sends digitized time domain data to a decimator to create the time domain waveform view, but it also sends the data to the DDC.
As you might expect, the DDC has a profound effect on the required sample rate. The DDC shifts the center frequency of interest from 900 MHz to 0 Hz. Now the 100 kHz span goes from -50 kHz to 50 kHz. To adequately sample a 50 kHz signal, we only need a sample rate of 125 kS/s. Notice that by inserting the DDC into the acquisition process, the sample rate required becomes a function of span, not center frequency.
Record length is governed by the same relationship as before. Record length is now 19 ms * 125 kS/s = 2,375 points. The data is stored as in-phase and quadrature (I&Q) samples and precise synchronization is maintained between the time domain data and the I&Q data. Remember, in the case of a conventional FFT the required record length was 59.375 Mpoints. The down-converted record only requires 2,375 points.
Now we perform an FFT on the 2,375 point I&Q record to get the desired spectrum. This dramatic reduction in the number of data points creates several important advantages:
- Update rate is greatly improved
- Much longer timespans can be processed and thus much better frequency resolution can be achieved in spectrum analysis
- The desired frequency domain view can be captured without changing the time domain view in any way
Efficient embedded system analysis and debugging begins and ends with insight. How can you possibly figure out why a system isn’t working as expected without precise, synchronized insight into both time and frequency domains? The answer is you can’t, and engineers have long recognized this but they have been constrained by limitations in conventional oscilloscope FFTs.
A new oscilloscope architecture enabled by new firmware available on the 5 and 6 Series MSOs points the way to a number of significant advances:
- Gives you all the familiar spectrum analysis controls (Center Frequency, Span and RBW)
- Allows optimization of both time domain and frequency domain displays independently
- Enables a signal to be viewed in both a waveform view and a spectrum view without splitting the signal path
- Enables accurate correlation of time domain events and frequency domain measurements (and vice versa)
- Significantly improves achievable frequency resolution in the frequency domain
- Improves the update rate of the spectrum display
For more information, check out this short demonstration of mixed domain analysis using Spectrum View, comparing it to traditional FFTs. Free firmware downloads are available for Windows OS (5 Series and 6 Series) and non-Windows OS (5 Series and 6 Series).