
By Christopher Skach
Editor’s Note: This 5-part series of posts will walk you through the fundamentals of radar test and measurement. Here’s the lineup
- Part 1: Radar basics, including continuous and pulsed radar, with a deeper dive into pulsed radar.
- Part 2: Lifecycle of radar measurement tasks, including key challenges in verification and production testing as well as a look at transmitter and receiver tests.
- Part 3: Analysis of radar signals including measurement methods and test setups.
- Part 4: Creating signals that look real to radar.
- Part 5: Tools for measuring modern radar systems.
Fundamentally, radar can be characterized as a time domain phenomenon. In its simplest form, it is the time it takes a transmitted signal to illuminate a target and “reflect back” to the receiver. The signal could be a continuous wave or a sequence of pulses with a specific mission goal. However, pulse rise and fall times, the type of modulation used, and the behavior of the transmitter amplifier can create a broad range of responses in the frequency domain. The radar signal also needs to be tested in congested or even contested environments – and a key task is to verify immunity to other signal interference, jamming and clutter effects.
Time domain measurements are traditionally performed with oscilloscopes while spectrum analyzers are best suited for frequency domain measurements. However, advancements in measurement instrumentation architectures have shaken this up a bit: now broadband frequency domain analysis can be performed with an oscilloscope and the time domain behavior of a frequency modulation (FM) signal can be analyzed using a spectrum analyzer.
Traditionally, the oscilloscope has been the primary tool for examining varying voltage versus time. This is key to understanding pulse, or pulse train, behavior. Oscilloscopes today come in various levels of performance; a basic oscilloscope may have a bandwidth of 200 MHz, so using it provides a good tool for analyzing pulses with a frequency response of less than 200 MHz, either unmodulated pulses or lower-frequency pulses with slow modulation. However, the limited bandwidth of entry-level oscilloscopes means that degenerative effects such as intermodulation will be naturally filtered out.
A modern performance oscilloscope can have a range of bandwidths of up to 70 GHz, providing the capability to capture multiple harmonics and other frequency-based distortion mechanisms. And, without using a detector, scopes can capture and analyze the transmit frequency and help you understand the behavior of both short duration pulses/impulses and wideband signal modulation.
For short duration pulses/impulses, further enhancements in architecture have also improved oscilloscope’s ability to analyze these signals using a fast acquisition mode. This mode reduces the dead time between waveform acquisitions, enabling the capture and display of transient events. Fast acquisition combined with persistent waveform features can also display phenomena at varying intensity to reflect their rate-of-occurrence.
A mixed domain oscilloscope can add a further trigger advantage, providing the ability to simultaneously trigger and acquire signals across multiple channels. This results in time-correlated seamless acquisitions in the analog, digital and RF domains, and provides the ability to observe how the spectral and vector properties of the RF signal vary over time along with the analog and digital signals.
The measurement of frequency domain characteristics of a transient/pulse-based system requires a specific type of spectrum analysis. While swept spectrum analyzers offer wide frequency and dynamic ranges, advances in analog-to-digital converters (ADC) and signal processing technology provide many of the same benefits but perform a wide bandwidth time domain acquisition, then post process using a Fast Fourier Transform (FFT). Time domain acquisitions allows for very fast visualization of signals often referred to as real time. The advantage of real-time measurement capability beyond speed are high-quality persistent displays, frequency domain triggering and waveform storage that can provide higher levels of measurement capability and insight.
The figure below shows some fundamental measurements on a pulsed radar signal in the frequency domain. The sin(x)/x response of the pulse in the frequency domain can be seen clearly. Also note longer pulses have smaller lobes, while shorter pulses have wider lobes as discussed earlier. Using real-time and persistence display technologies allow observation of not only the frequency and frequency response, but also enhances the ability to view the PRF.

Because of the inverse relationship between frequency and time, it is possible to determine basic pulse timing parameters using the spectrum analyzer frequency domain display. The pulse repetition time (pulse period) is the inverse of the frequency spacing between the finely-spaced lines within the larger spectrum envelope. The pulse width is the inverse of the frequency spacing between the nulls in the spectrum envelope.
A spectrum analyzer differs from an oscilloscope as the bandwidth of an oscilloscope is usually a function of the ADC technology and sample rate of the system. A spectrum analyzer uses some form of frequency conversion (usually super heterodyne) to create an intermediate frequency that is centered around the frequency bandwidth of a narrow ADC. As bandwidth is inversely proportional to dynamic range, the spectrum analyzer has a better range, allowing the user to view very small signals in the presence of large signals. By comparison, an oscilloscope with a bandwidth of 18 GHz will have lower dynamic ranges than a spectrum analyzer with a frequency range of 18 GHz. However, the 18 GHz oscilloscope captures the whole instantaneous bandwidth (DC-18 GHz), while the spectrum analyzer, for example, can instantaneously capture +/- 400 MHz around a center frequency of 9 GHz.
Just as an oscilloscope can translate time domain data by performing an FFT and displaying the frequency domain spectrum, a spectrum analyzer can also show measurement information in the time domain. Once the spectrum analyzer is tuned to an appropriate center frequency, the required measurement data can be displayed in the frequency domain or the time domain.
As the time domain measurement on the spectrum analyzer is limited by the bandwidth of the ADC, the maximum LFM that can be observed in the time domain on the example spectrum analyzer above will be a sweep of 800 MHz.
Another feature of the spectrum analyzer is that is allows you to adjust the acquisition bandwidth to make more selective measurements using a resolution bandwidth filter. This will effectively reduce the displayed noise level. For example, a 3 kHz resolution bandwidth filter has a noise floor 10 dBs less than a 30 kHz resolution bandwidth filter.
New is not necessarily the best – many newer models of spectrum analyzer emulate the anomalies of a cathode ray tube (CRT) that was used as the display on a spectrum analyzer before the turn of the century. A CRT utilizes a magnetically-controlled electron gun that fires electrons on a phosphor-coated screen. The screen illuminates and then slowly decays over time.
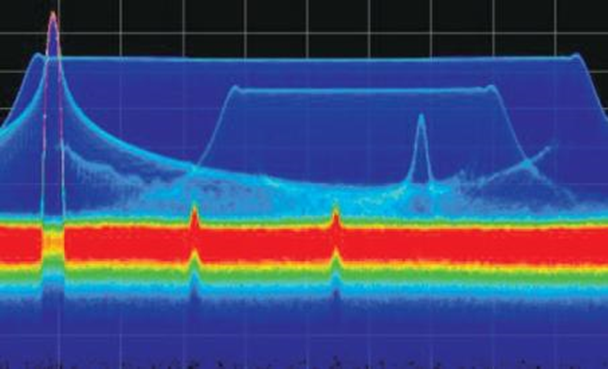
The figure below shows a typical display using a phosphor emulation technique. Without phosphor emulation, the screen would just show the large LFM signal, with the CW signal “popping out” the top on the left. But with phosphor emulation, you can see a second lower power LFM overlapped in frequency. In addition, several single-frequency pulsed carriers and two continuous wave (CW) interferers can be observed.
As with an oscilloscope, spectrum analyzers are available with automated pulse measurements that increase signal detail and measurement repeatability. In some cases, a spectrum analyzer will have more advanced capability and can store up to two hours of acquisitions, finds the pulses within it and measures a full set of parameters for each pulse such as timing, frequency and phase parameters, and the results can be further processed to display trends or identify the transmitter.
Picking the right instrument
Both oscilloscopes and spectrum analyzers are good tools for measuring performance in the time and frequency domain and can have equivalent measurement capability, but the difference in instrument architecture makes one more optimal for some measurements than the other. An oscilloscope can have an extremely wide acquisition bandwidth in the 10s of GHz range, at the cost of dynamic range and sensitively, this makes it ideal for capturing fast transient events such as narrow pulses/impulses and large frequency sweeps. A modern spectrum analyzer can tune to a specific frequency, then acquire a signal in the region of a few 10s of MHz to <1 GHz with better dynamic range and sensitivity makings it an ideal tool for broadband analysis of spectrum, spurious signal searches, intermodulation and harmonic analysis.
Here's a quick rundown on the radar measurement solutions from Tektronix:
Signal generation
With the highest speed arbitrary waveform generators available, you can easily and confidently generate unique signals for your application.
Real-time spectrum analyzers
Our wideband signal analyzers offer real-time spectrum analysis with up to 800 MHz bandwidth and streaming storage of up to 2 hours of seamless data at full bandwidth. Validate your transmitter design with speed and confidence with the unique features of the RSA series Real-Time Spectrum Analyzers, including DPX live RF display and the advanced pulse measurement suite.
Oscilloscopes
Capture up to 70 GHz signals with the lowest noise and highest fidelity, ensuring the most accurate measurements of your signal’s true characteristics. Using our SignalVu Vector Analysis software and our suite of oscilloscopes, you can analyze signals up to 70GHz wide with the same tools used on our Real-Time Spectrum Analyzers.
Pulse-ogram analysis software
CM (Electronic Countermeasure) techniques are used to confuse a radar system by distorting, adjusting or fabricating one aspect of the pulse measurements, whether it's pulse width, frequency or phase characteristics, PRI, chirp pattern, number of targets, etc. Pulse-ogram analysis software helps the user understand normal radar behavior and identify ECM techniques that require the analysis of multiple pulses simultaneously in both the frequency domain and time domain.