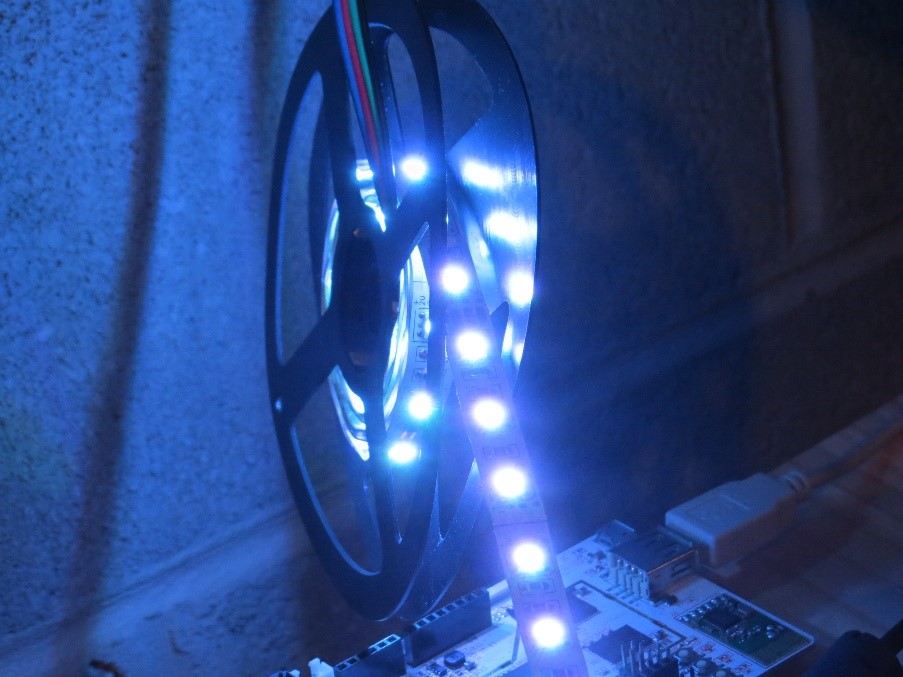

LEDs are finding their way into many lighting applications. I’m sure most of us have purchased High Brightness LEDs for use in our homes to replace compact fluorescent lamps (CFL) or incandescent bulbs. It’s amazing how much light LED bulbs generate. I recently purchased a roll of LEDs that I use to light up my home electronics workbench and ham radio station.

Figure 1. A reel of high brightness LEDs.
If you’re like me, you want to understand more about LED Test, such as how much light can it emit and how much current can it tolerate. Like any semiconductor device, even LEDs can only tolerate so much current. In fact, after taking the picture in Figure 1, the roll of LEDs was getting quite warm. Unfortunately, you can’t apply too much current for too long without a heatsink before the LED generates enough heat to destroy itself. During a test I was running, I put too much current through the device so that not only did I destroy the LED, I also melted the test leads!
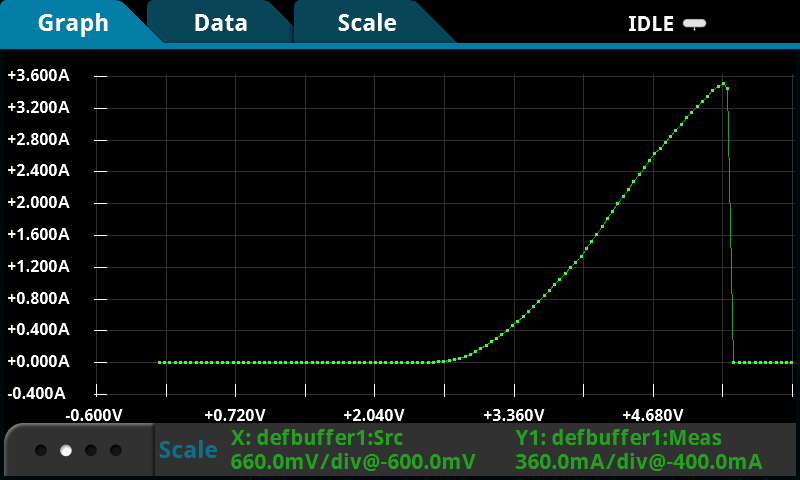
Figure 2. A DC IV test with a catastrophic failure of the LED.
I ran a typical IV sweep on one of the LEDs using a traditional Analog/Digital measurement taken at each sweep point. You can see that the DC sweep trace eventually collapses and the current slams down to zero before the sweep is complete. This happened because the device self-heated itself all the way to complete catastrophic failure. Oddly, the specification for this LED shows a maximum VF of 3.7 volts, yet I was able to take the LED up to 5.4 volts @ 3.4 amps before the failure. Without a heatsink, what can I do to prevent damaging the LED, but at the same time, capture the current and voltage data fast enough to see the true device operation?
One of my colleagues recently wrote a blog post about Minimizing Self-Heating When Testing High-Brightness LEDs. The blog focused on using pulse testing. But what I really wanted to do was to capture the current and voltage during a pulse event to see what really happens and use the data to recreate the IV curve provided by the LED manufacturer.
Bring in the Digitizer
Instead of using a DC Sweep to characterize the LED, I will pulse test the LED and use a high speed digitizer built into a source measure unit (SMU) instrument to capture the high speed test data and analyze the performance. Is it possible to pulse test the LED beyond the specifications and avoid damaging the LED without the use of a heat sink? The answer is yes.
I set up my Keithley 2461 source measure unit Instrument to output a 5.5V @ 7A pulse to the LED. So that I could capture the pulse data, I used the built-in digitizer to simultaneously measure the voltage and the current so I could view the actual performance. The pulse width was set for 250mS. Finally, I set the dual 18-bit digitizers for a sampling rate of 1MS/s and captured 100,000 points. The results are as shown.
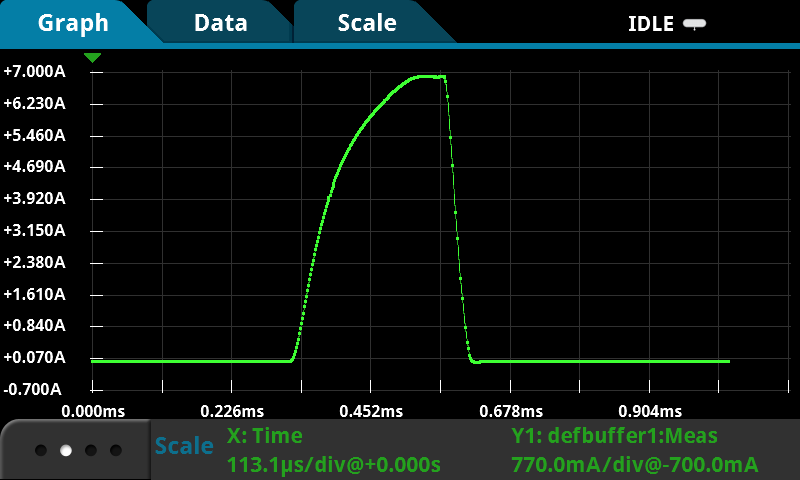
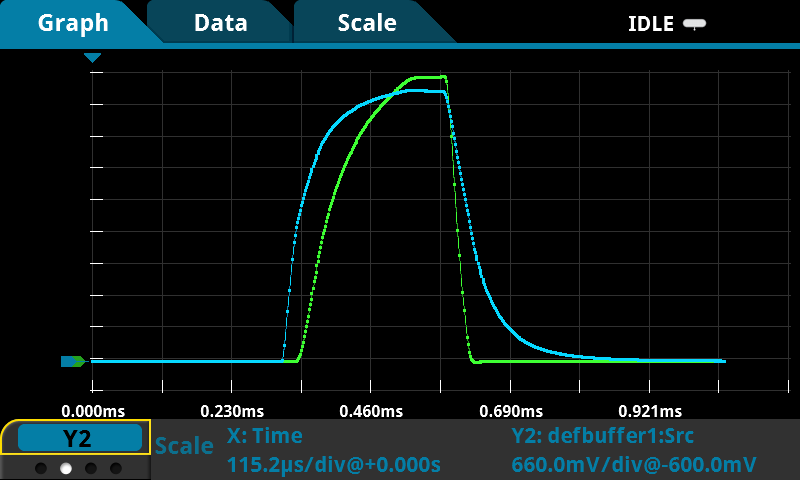
Figure 3. Pulsed test with measured current in the left image and both measured current and voltage plotting together.
The image on the left shows the LED current draw up to 7A. I purposely limited the current to not exceed 7A in the test configuration. The image on the right overlays both the pulsed voltage in blue and the current measure in green. The test was repeated many times without damaging the LED. Since the measurements are time synchronized, using the digitizer tells a story of the real operation of the LED. Notice with the voltage pulse, as the voltage increases, the current does not start to increase until the voltage reaches ~2.73 volts. This was confirmed by saving the data from the Keithley 2461 and plotting the data in Excel. I drew a black line from the point where the current begins to increase up to the voltage source line as shown.
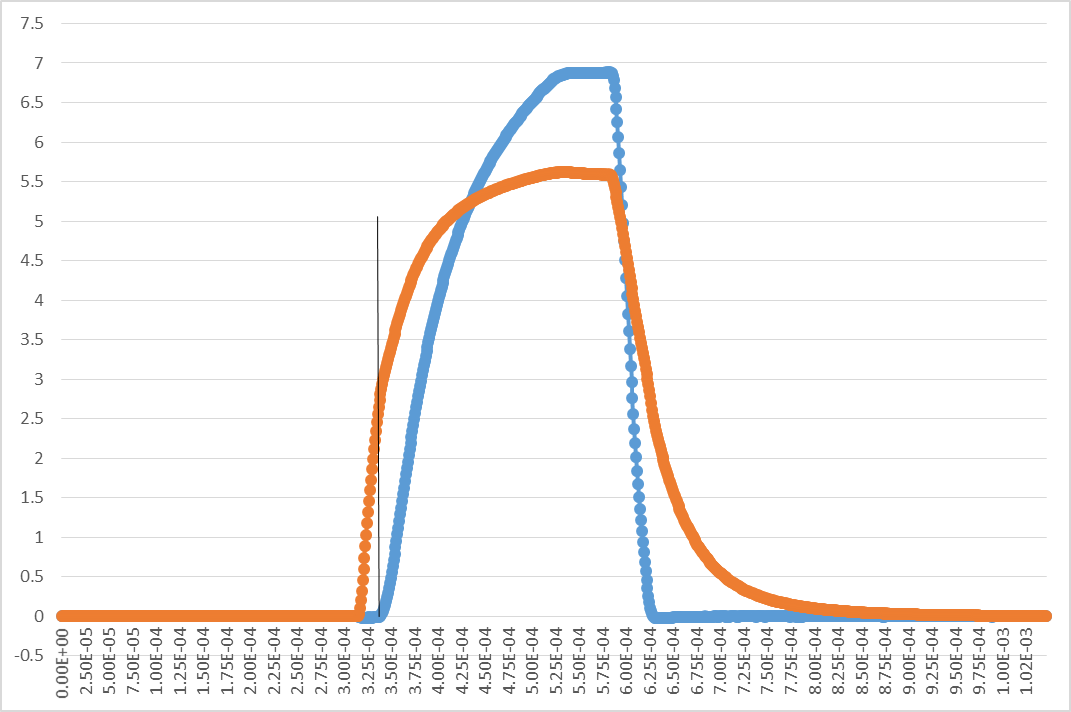
Figure 4. The digitized data plotting in Excel to view in higher detail.
This correlated with the LED datasheet specification of a VF at 2.7 volts minimum.
How does this digitized data compare to the IV specification from the manufacturer?
Using the digitized data from the source measure unit instrument, I can create an IV curve to compare against the specification from the manufacturer. By extracting the source voltage and measured current values in the range of the datasheet graph, I can create an IV plot from experimental data and compare to the data sheet:
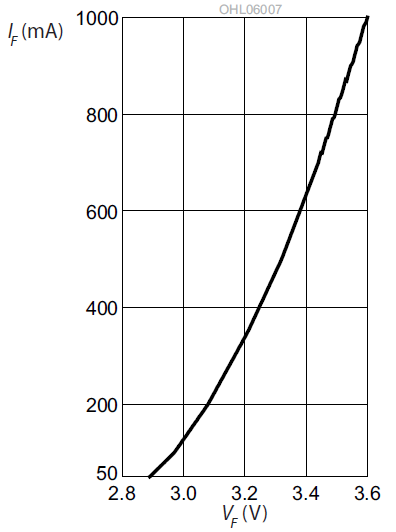
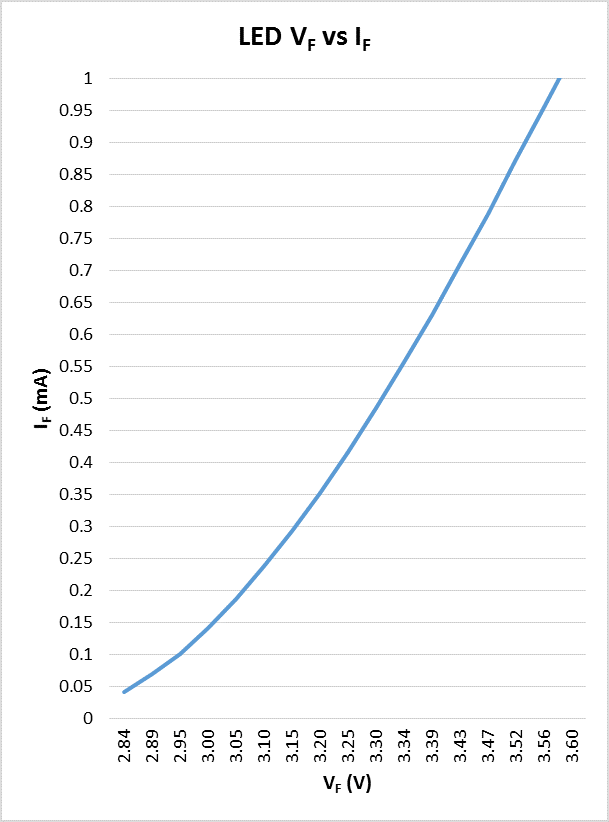
Figure 5. IV plots from the manufacturer’s datasheet and experimental data.
Spot checking a few number of VF and IF values in the experimental data, the digitized data does correlate to the datasheet specifications.
Conclusion
Having a built-in digitizer in a source measure unit instrument can help visualize real operation of a device, such as an LED test, and quickly analyze the results. It also enable me to pulse test the LED beyond the specifications and both avoid damaging the LED and not have to use a heat sink. The digitizer runs at a sampling speed much faster than the traditional A/D converters used on most source measure unit instruments. The Keithley 2461 source measure unit instrument can source up to 10A, 100V pulses, and simultaneously measure voltage and current waveforms with its dual 18-bit 1MS/s digitizing A/D converters. You can find more information on the Keithley 2461 on the Tektronix Source Measure Unit product page. You can also learn more about High Brightness LED testing with the Keithley 2461 by downloading the application note, Pulse Testing High Brightness LEDs Accurately using the 2461 High Current source measure unit Instrument.
Bio
John Tucker is a Senior Marketing and Product Manager for the Keithley product line of Tektronix, Inc. He has been with Keithley for over 28 years and has served in a variety of positions, including test engineer, applications engineer, applications manager, product manager, and business development manager. He is currently the product manager for Keithley’s Source Measure Unit (SMU) Instrument product line and the new series of graphical SMU instruments.


