Kontaktaufnahme
Live-Chat mit Tektronix-Vertretern. Verfügbar von 9 bis 17 Uhr CET Geschäftstage.
Kontaktieren Sie uns telefonisch unter
Verfügbar von 9 bis 17 Uhr CET Geschäftstage.
Download
Laden Sie Handbücher, Datenblätter, Software und vieles mehr herunter:
Feedback
TMT4 Margin Tester User Manual
This manual provides operating information for the TMT4 Margin Tester. This includes how to run Custom Scans, run Quick Scans, and use API for remote control.
Dieses Handbuch bezieht sich auf:
TMT4
- Handbuchtyp: Hauptbenutzer
- Teilenummer: 077173101
- Veröffentlichungsdatum:
- Revision: Rev A
Manuals Download Agreement
ATTENTION: please read the following terms and conditions carefully before downloading any documents from this website. By downloading manuals from Tektronix' website, you agree to the following terms and conditions:
Manuals for Products That Are Currently Supported:
Tektronix hereby grants permission and license to owners of Tektronix instruments to download and reproduce the manuals on this website for their own internal or personal use. Manuals for currently supported products may not be reproduced for distribution to others unless specifically authorized in writing by Tektronix, Inc.
A Tektronix manual may have been revised to reflect changes made to the product during its manufacturing life. Thus, different versions of a manual may exist for any given product. Care should be taken to ensure that one obtains the proper manual version for a specific product serial number.
Manuals for Products That Are No Longer Supported:
Tektronix cannot provide manuals for measurement products that are no longer eligible for long term support. Tektronix hereby grants permission and license for others to reproduce and distribute copies of any Tektronix measurement product manual, including user manuals, operator's manuals, service manuals, and the like, that (a) have a Tektronix Part Number and (b) are for a measurement product that is no longer supported by Tektronix.
A Tektronix manual may be revised to reflect changes made to the product during its manufacturing life. Thus, different versions of a manual may exist for any given product. Care should be taken to ensure that one obtains the proper manual version for a specific product serial number.
This permission and license does not apply to any manual or other publication that is still available from Tektronix, or to any manual or other publication for a video production product or a color printer product.
Disclaimer:
Tektronix does not warrant the accuracy or completeness of the information, text, graphics, schematics, parts lists, or other material contained within any measurement product manual or other publication that is not supplied by Tektronix or that is produced or distributed in accordance with the permission and license set forth above.
Tektronix may make changes to the content of this website or to its products at any time without notice.
Limitation of Liability:
TEKTRONIX SHALL NOT BE LIABLE FOR ANY DAMAGES WHATSOEVER (INCLUDING, WITHOUT LIMITATION, ANY CONSEQUENTIAL OR INCIDENTAL DAMAGES, DAMAGES FOR LOSS OF PROFITS, BUSINESS INTERRUPTION, OR FOR INFRINGEMENT OF INTELLECTUAL PROPERTY) ARISING OUT OF THE USE OF ANY MEASUREMENT PRODUCT MANUAL OR OTHER PUBLICATION PRODUCED OR DISTRIBUTED IN ACCORDANCE WITH THE PERMISSION AND LICENSE SET FORTH ABOVE.
Read Online
Important safety information
This manual contains information and warnings that must be followed by the user for safe operation and to keep the product in a safe condition.
To safely perform service on this product, see the Service safety summary that follows the General safety summary.
General safety summary
Use the product only as specified. Review the following safety precautions to avoid injury and prevent damage to this product or any products connected to it. Carefully read all instructions. Retain these instructions for future reference.
This product shall be used in accordance with local and national codes.
For correct and safe operation of the product, it is essential that you follow generally accepted safety procedures in addition to the safety precautions specified in this manual.
The product is designed to be used by trained personnel only.
Only qualified personnel who are aware of the hazards involved should remove the cover for repair, maintenance, or adjustment.
Before use, always check the product with a known source to be sure it is operating correctly.
This product is not intended for detection of hazardous voltages.
Use personal protective equipment to prevent shock and arc blast injury where hazardous live conductors are exposed.
While using this product, you may need to access other parts of a larger system. Read the safety sections of the other component manuals for warnings and cautions related to operating the system.
When incorporating this equipment into a system, the safety of that system is the responsibility of the assembler of the system.
To avoid fire or personal injury
Use proper power cord.
Use only the power cord specified for this product and certified for the country of use. Do not use the provided power cord for other products.
Ground the product.
This product is indirectly grounded through the grounding conductor of the mainframe power cord. To avoid electric shock, the grounding conductor must be connected to earth ground. Before making connections to the input or output terminals of the product,ensure that the product is properly grounded. Do not disable the power cord grounding connection.
Power disconnect.
The power cord disconnects the product from the power source. See instructions for the location. Do not position the equipment so that it is difficult to operate the power cord; it must remain accessible to the user at all times to allow for quick disconnection if needed.
Observe all terminal ratings.
To avoid fire or shock hazard, observe all rating and markings on the product. Consult the product manual for further ratings information before making connections to the product.
Do not operate without covers
Do not operate this product with covers or panels removed, or with the case open. Hazardous voltage exposure is possible.
Avoid exposed circuitry
Do not touch exposed connections and components when power is present.
Do not operate with suspected failures.
If you suspect that there is damage to this product, have it inspected by qualified service personnel.
Disable the product if it is damaged. Do not use the product if it is damaged or operates incorrectly. If in doubt about safety of the product, turn it off and disconnect the power cord. Clearly mark the product to prevent its further operation.
Examine the exterior of the product before you use it. Look for cracks or missing pieces.
Use only specified replacement parts.
Do not operate in wet/damp conditions
Be aware that condensation may occur if a unit is moved from a cold to a warm environment.
Do not operate in an explosive atmosphere
Keep product surfaces clean and dry
Remove the input signals before you clean the product.
Provide proper ventilation.
Refer to the installation instructions in the manual for details on installing the product so it has proper ventilation.
Slots and openings are provided for ventilation and should never be covered or otherwise obstructed. Do not push objects into any of the openings.
Provide a safe working environment
Always place the product in a location convenient for viewing the display and indicators.
Be sure your work area meets applicable ergonomic standards. Consult with an ergonomics professional to avoid stress injuries.
Use care when lifting and carrying the product. This product is provided with a handle or handles for lifting and carrying.
Terms in this manual
These terms may appear in this manual:
 | WARNING:Warning statements identify conditions or practices that could result in injury or loss of life. |
| CAUTION:Caution statements identify conditions or practices that could result in damage to this product or other property. |
Terms on the product
These terms may appear on the product:
- DANGER indicates an injury hazard immediately accessible as you read the marking.
- WARNING indicates an injury hazard not immediately accessible as you read the marking.
- CAUTION indicates a hazard to property including the product.
Symbols on the product
 | When this symbol is marked on the product, be sure to consult the manual to find out the nature of the potential hazards and any actions which have to be taken to avoid them. (This symbol may also be used to refer the user to ratings in the manual.) |
The following symbols(s) may appear on the product.
 |  |  |  |
Service safety summary
The Service safety summary section contains additional information required to safely perform service on the product. Only qualified personnel should perform service procedures. Read this Service safety summary and the General safety summary before performing any service procedures.
To avoid electric shock
Do not touch exposed connections.
Do not service alone
Do not perform internal service or adjustments of this product unless another person capable of rendering first aid and resuscitation is present.
Disconnect power
To avoid electric shock, switch off the product power and disconnect the power cord from the mains power before removing any covers or panels, or opening the case for servicing.
Use care when servicing with power on
Dangerous voltages or currents may exist in this product. Disconnect power, remove battery (if applicable), and disconnect test leads before removing protective panels, soldering, or replacing components.
Verify safety after repair
Always recheck ground continuity and mains dielectric strength after performing a repair.
Compliance information
This section lists the safety and environmental standards with which the instrument complies. This product is intended for use by professionals and trained personnel only; it is not designed for use in households or by children.
Compliance questions may be directed to the following address:
Tektronix, Inc.
PO Box 500, MS 19-045
Beaverton, OR 97077, USA
Safety compliance
This section lists the safety standards with which the product complies and other safety compliance information.
EU declaration of conformity – low voltage
Compliance was demonstrated to the following specification as listed in the Official Journal of the European Union:
Low Voltage Directive 2014/35/EU.
- EN 61010-1. Safety Requirements for Electrical Equipment for Measurement, Control, and Laboratory Use – Part 1: General Requirements
U.S. nationally recognized testing laboratory listing
- UL 61010-1. Safety Requirements for Electrical Equipment for Measurement, Control, and Laboratory Use – Part 1: General Requirements
Canadian certification
- CAN/CSA-C22.2 No. 61010-1. Safety Requirements for Electrical Equipment for Measurement, Control, and Laboratory Use – Part 1: General Requirements
Additional compliances
- IEC 61010-1. Safety Requirements for Electrical Equipment for Measurement, Control, and Laboratory Use – Part 1: General Requirements
Equipment type
Test and measuring equipment.
Safety class
Class 1 – grounded product.
Pollution degree description
A measure of the contaminants that could occur in the environment around and within a product. Typically the internal environment inside a product is considered to be the same as the external. Products should be used only in the environment for which they are rated.
- Pollution Degree 1. No pollution or only dry, nonconductive pollution occurs. Products in this category are generally encapsulated, hermetically sealed, or located in clean rooms.
- Pollution Degree 2. Normally only dry, nonconductive pollution occurs. Occasionally a temporary conductivity that is caused by condensation must be expected. This location is a typical office/home environment. Temporary condensation occurs only when the product is out of service.
- Pollution Degree 3. Conductive pollution, or dry, nonconductive pollution that becomes conductive due to condensation. These are sheltered locations where neither temperature nor humidity is controlled. The area is protected from direct sunshine, rain, or direct wind.
- Pollution Degree 4. Pollution that generates persistent conductivity through conductive dust, rain, or snow. Typical outdoor locations.
Pollution degree rating
Pollution Degree 2 (as defined in IEC 61010-1). Rated for indoor, dry location use only.
IP rating
IP20 (as defined in IEC 60529).
Measurement and overvoltage category descriptions
Measurement terminals on this product may be rated for measuring mains voltages from one or more of the following categories (see specific ratings marked on the product and in the manual).
- Overvoltage Category I. For equipment intended to be connected to a mains supply in which means have been taken to substantially and reliably reduce transient overvoltages to a level where they cannot cause a hazard.
- Measurement Category II. For measurements performed on circuits directly connected to the low-voltage installation.
- Measurement Category III. For measurements performed in the building installation.
- Measurement Category IV. For measurements performed at the source of low-voltage installation.
| Note:Only mains power supply circuits have an overvoltage category rating. Only
measurement circuits have a measurement category rating. Other circuits within the
product do not have either rating. |
Mains overvoltage category rating
Overvoltage Category II (as defined in IEC 61010-1).
Environmental compliance
This section provides information about the environmental impact of the product.
Product end-of-life handling
Observe the following guidelines when recycling an instrument or component:
- Equipment recycling
- Production of this equipment required the extraction and use of natural resources. The equipment may contain substances that could be harmful to the environment or human health if improperly handled at the product’s end of life. To avoid release of such substances into the environment and to reduce the use of natural resources, we encourage you to recycle this product in an appropriate system that will ensure that most of the materials are reused or recycled appropriately.
 |
This symbol indicates that this product complies with the applicable European Union requirements according to Directives 2012/19/EU and 2006/66/EC on waste electrical and electronic equipment (WEEE) and batteries. For information about recycling options, check the Tektronix Web site (http://www.tek.com/productrecycling). |
- Battery recycling
- Perchlorate materials
- This product contains one or more type CR lithium batteries. According to the state of California, CR lithium batteries are classified as perchlorate materials and require special handling. See www.dtsc.ca.gov/hazardouswaste/perchlorate for additional information.
Transporting batteries
The small lithium primary cell contained in this equipment does not exceed 1 gram of lithium metal content per cell.
The cell type has been shown by the manufacturer to comply with the applicable requirements of the UN Manual of Tests and Criteria Part III, Sub-section 38.3. Consult your carrier to determine which lithium battery transportation requirements are applicable to your configuration, including to its re-packaging and re-labeling, prior to reshipment of the product by any mode of transport.
Key features
- PCIe Gen 3 (8 GT/s) and Gen 4 (16 GT/s) speeds supported
- Link widths up to 16 lanes supported
- Support for CEM, M.2, U.2, U.3, and E1 devices
- Two scan options: Quick Scan and Custom Scan
- DUT transmitter (Tx) eye diagrams and link training parameters for each lane tested
- DUT functional receiver (Rx) evaluation for each lane tested
- LTSSM Monitoring
- Receiver DUT Test beyond standard presets

Documentation
Product documentation
The following table lists the primary product specific documentation available for your product. These and other user documents are available for download from tek.com. Other information, such as demonstration guides, technical briefs, and application notes, can also be found at tek.com.
| Document | Content |
|---|---|
| Installation and Safety Instructions | Safety, compliance, and basic introductory information for hardware products. |
| User | Operating information, including API usage, for the product. |
| Specifications and Performance Verification Technical Reference | Instrument specifications and performance verification instructions for testing instrument performance. |
| API commands | API commands for remotely controlling the instrument are available from the instrument IP address in the Web browser. |
| Declassification and Security Instructions | Information about the location of memory in the instrument. Instructions for declassifying and sanitizing the instrument. |
How to find your product documentation
- Go to tek.com.
- Click Download in the green sidebar on the right side of the screen.
- Select Manuals as the Download Type, enter your product model, and click Search.
- View and download your product manuals. You can also click the Product Support Center and Learning Center links on the page for more documentation.
Power, environmental, and physical specifications
5% to 95% relative humidity (% RH) at up to +30°C 5% to 75% RH above +30°C up to +40°C 45% RH above +40°C up to 50°C, non-condensing 5% to 95% RH (Relative Humidity) at up to +30°C 5% to 45% RH above +40°C up to +71°C, non-condensingPower
Input voltage 100-240 V Frequency 50-60 Hz Power 200 W maximum Environmental
Temperature Operating 0°C to +50°C, with 15°C/hour maximum gradient, non-condensing Non-operating -40°C to +71°C, with 30°C/hour maximum gradient Required instrument clearance Rear None Bottom Feet provide sufficient clearance. Do not operate instrument without feet. Sides 50.8 mm (2 in) Top None Humidity Operating
Non-operating
Altitude Operating Up to 3,000 meters Non-operating Up to 12,000 meters Physical
Measure Instrument only Weight 3.13 kg (6.89 lbs) stand-alone instrument Dimension With protective cover, handle, and feet No protective cover,with 50 Ω terminators Height 150 mm 147 mm Width 206 mm 200 mm Depth 286 mm 277 mm
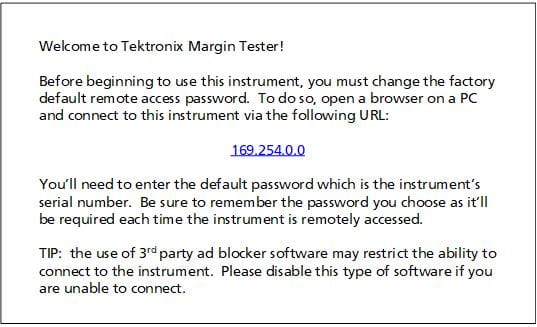
Setup and installation
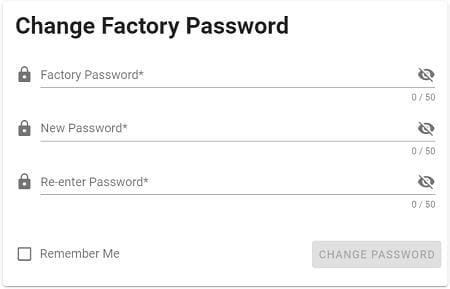
Follow these steps after you unpack the instrument to turn it on, connect, and get started. This requires an Ethernet connection. When you are turning on the instrument for the first time, the following screen should appear. Write down the IP address shown on the screen of your instrument. Enter the serial number of your instrument into the Factory Password field. Then enter a new password in the New Password field. Re-enter the password. Be sure to remember the new password or record and place it in a secure location. It will be needed each time the instrument is remotely accessed. A Welcome screen with the instrument menus will appear after you click the Change Password button. You can program and control your instrument using API commands. Do the following to access the Swagger interface for the API: Connect and turn on
Remote control through the API
Power sequence when connected to a DUT
Use the following sequence when powering off the TMT4 when it is connected to a DUT.
- When powering on a PCIe AIC DUT that requires an external power supply, you must first power on the TMT4, and then power on the DUT external power supply.
- When powering off the TMT4 and a connected AIC device with external power, first power off the DUT, then power off the TMT4.
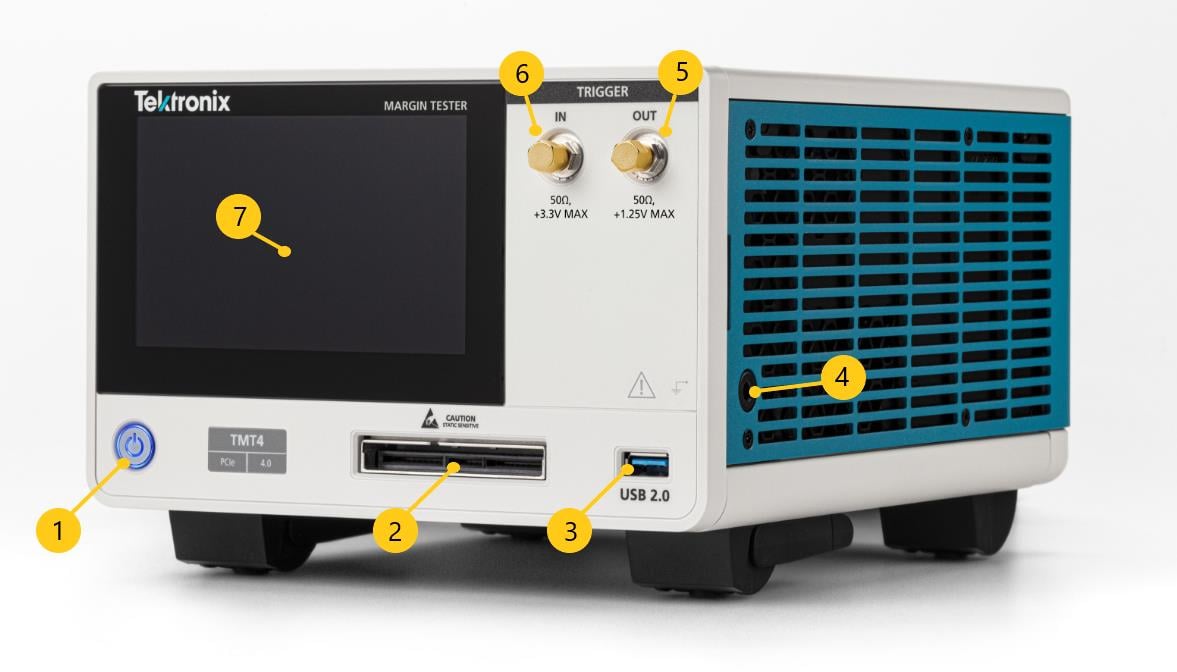
Front panel controls and connectors
The front panel provides access to power button, trigger and signal inputs and outputs, and touchscreen display.
| Description | |
|---|---|
| 1 |
Power button. LED color indicates power mode. Off: Unplugged (unplug the power cord to remove power completely) Amber: Standby Blue: On |
| 2 | PCIe high density connector |
| 3 | USB 2.0 type A port. |
| 4 |
Banana type ground connection. Discharge the static voltage from your body by wearing a grounded antistatic wrist strap while connecting and disconnecting cables and adapters. |
| 5 | (Not yet available) Trigger Out +1.25 V, 50 Ω |
| 6 | (Not yet available) Trigger In +3.3 V, 50 Ω |
| 7 | 5" LCD touch screen provides access to basic controls and test results. |
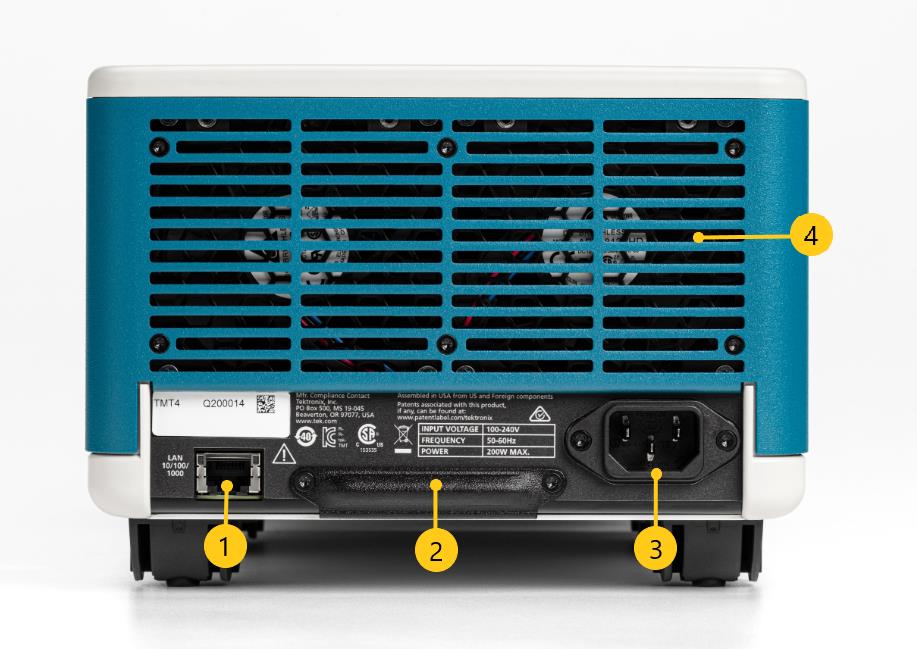
Rear panel connectors
The rear panel connectors provide access to power and LAN.
| Description | |
|---|---|
| 1 | LAN. 10/100/1000 Base-T Ethernet port for remote connection to a PC. |
| 2 | SD memory card slot. This slot will be used for core storage needs. Removable for sensitive purposes related to declassification as needed. Remove screws to access card. |
| 3 | Power connector. 100-240V, 50-60Hz, 200 W maximum |
| 4 | Fan vents. |
Cleaning
Use a dry, soft cotton cloth to clean the outside of the unit. If any dirt remains, use a cloth or swab dipped in a 75% isopropyl alcohol solution. Use a swab to clean narrow spaces around controls and connectors. Do not use any liquid cleaning agents or chemicals that could damage the touchscreen, case, controls, markings or labels, or possibly infiltrate the case.
Menus
The web interface menus allow you to access the full range of the TMT4 Margin Tester features. The front panel provides access to run a Quick Scan, see Quick Scan results, and view the instrument IP address.
The navigation panel is on the left side of the Web interface Welcome screen. It allows you to access the various menus, check link status, instrument serial number, and adapter information.
Check Link
Click the Check Link button before running a scan to ensure you have a link. This will report the current configuration of the DUT for its given speed and link width.
- No link detected: Red text will appear showing “No link”.
- Link detected: Green text will appear.
- If there is no adapter connected, the button will return nothing.
TMT4 serial number and adapter status
The TMT4 serial number and the connected adapter type, if any, is displayed at the bottom of the navigation panel.
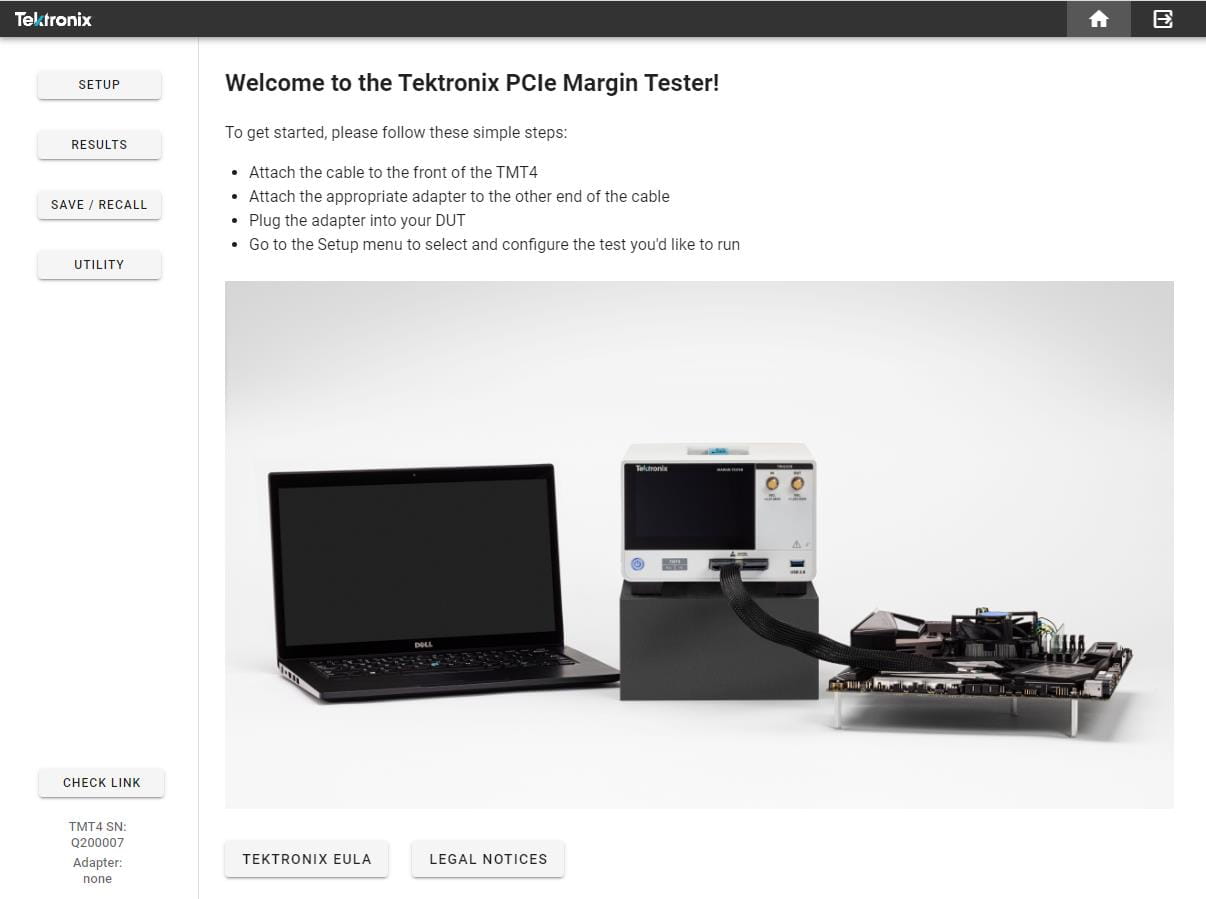
Home
The Welcome screen tells you how to get started with a scan. At the bottom of the screen are buttons to access the Tektronix End User License Agreement (EULA) and Legal Notices.
You can access the Home and Logout icons from the upper right of the window from any screen. Click the Home icon to return to the Welcome page. Click the Logout icon to log out of the TMT4.

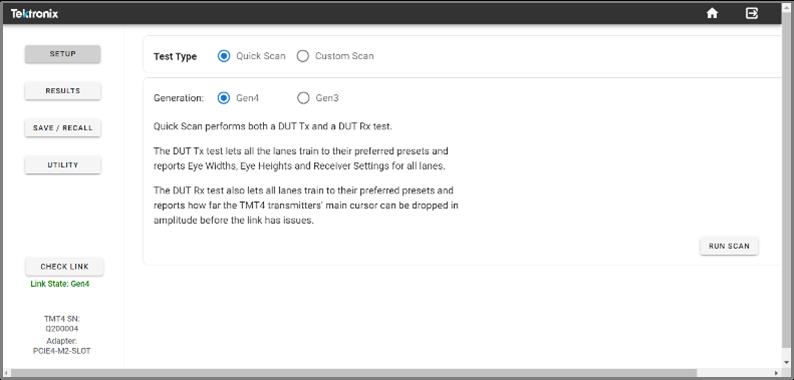
Setup
The Setup menu allows you to select Quick Scan or Custom Scan test types. Which you select determines the menu options. The following images show Quick Scan and Custom Scan examples.
Results
The Results screen shows test results. The available data depend on the test type and other parameters. See the Quick Scan and Custom Scan topics in this document for details.
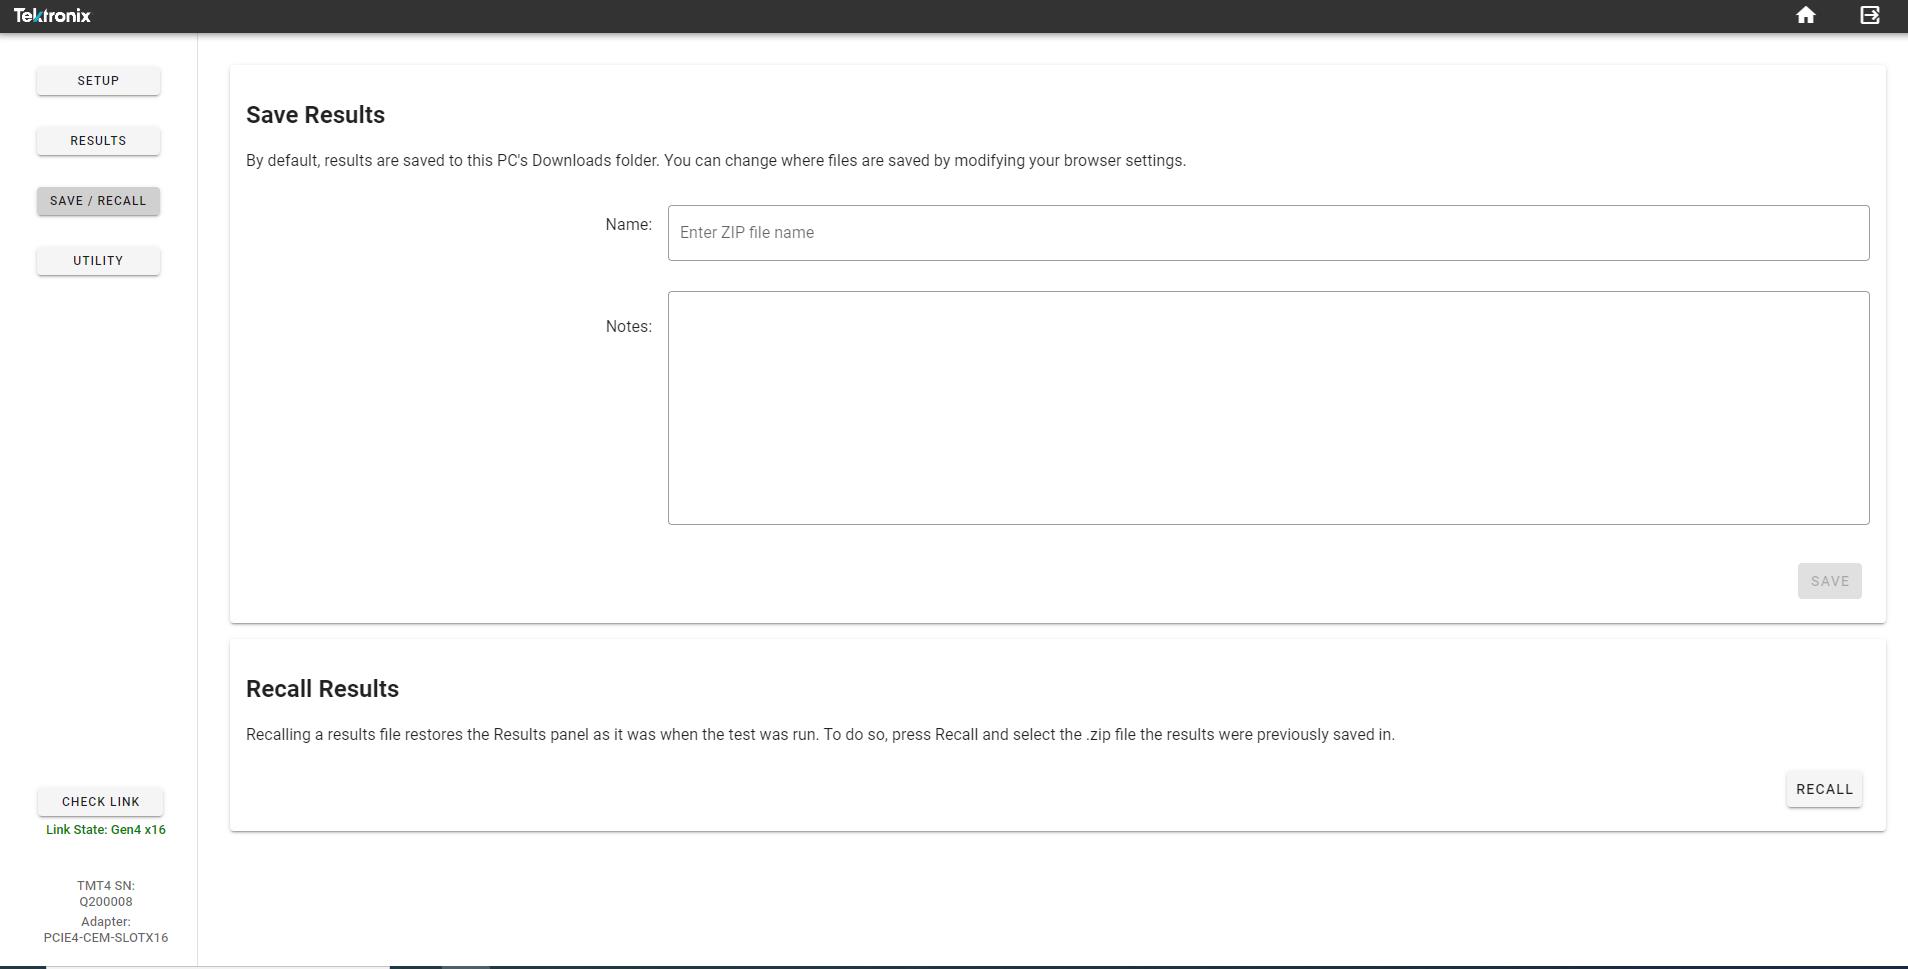
Save/Recall
Enter the file name for the results you want to save. You can also add any notes. Results are saved to your PC's Downloads folder by default. You can change where files are saved by modifying your browser settings.
Recalling a results file restores the Results panel as it was when the test was run. To recall results, click the Recall button and select the .zip file in which the results were previously saved.
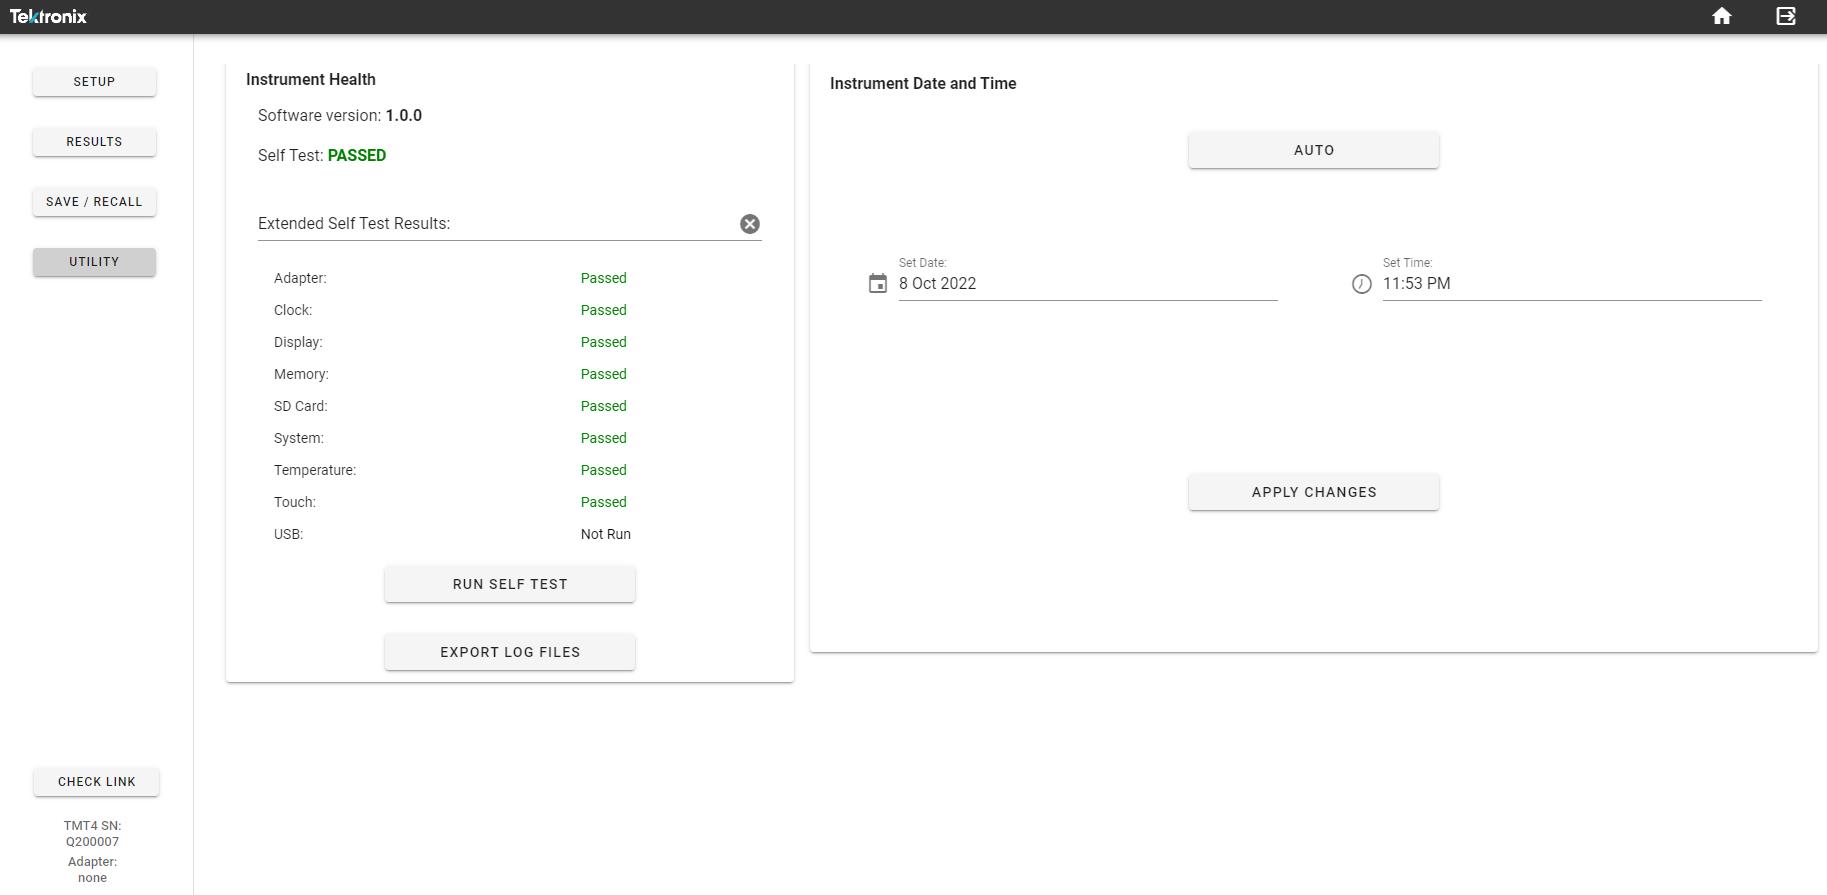
Utility
The Utility menu provides access to the TMT4 software (firmware) version, self test run and results, a way to export log files, and a way to set the instrument date and time.
Upgrade the instrument firmware
You can upgrade the instrument firmware as follows.
- Insert a USB stick with the firmware into the intrument USB port.
- Cycle the power.
- Verify that the instrument firmware was updated by checking the displayed software version in the Instrument Health panel.
Operation
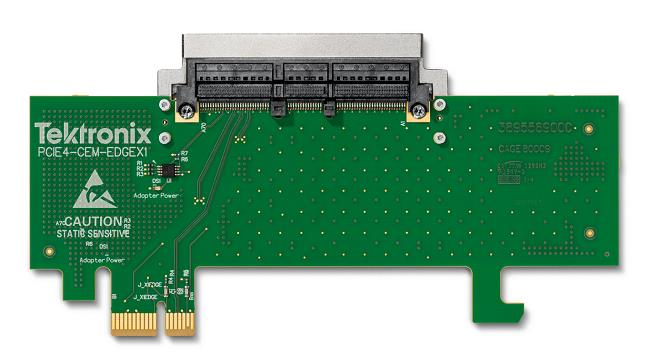
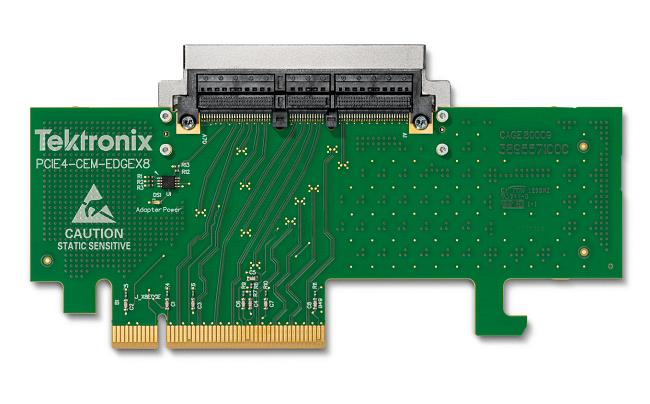
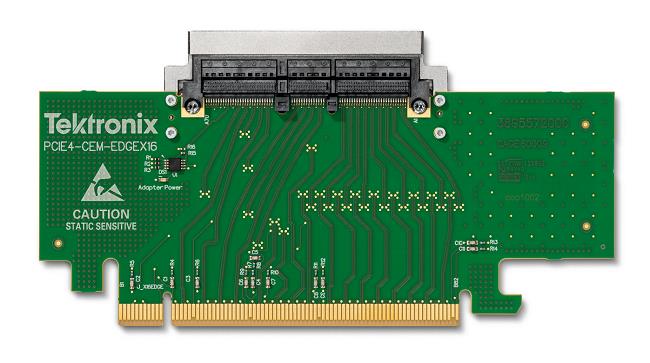
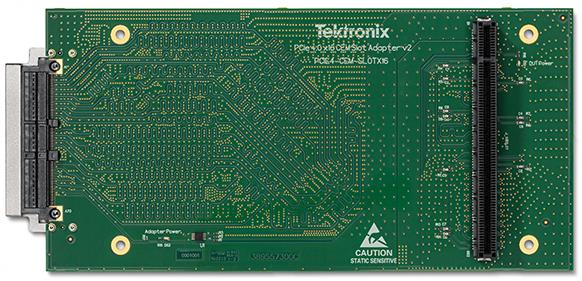
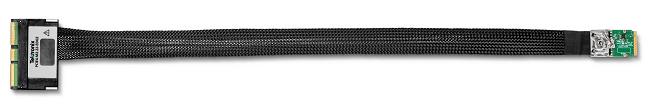
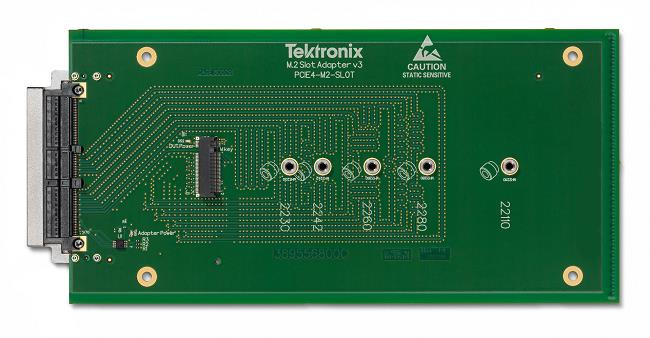
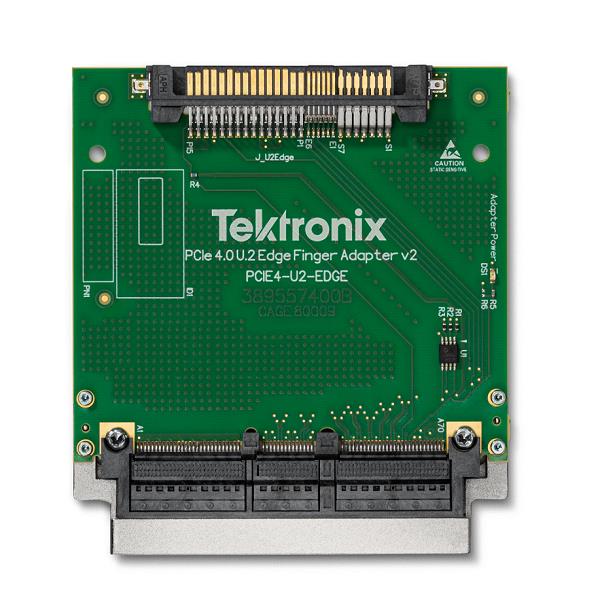
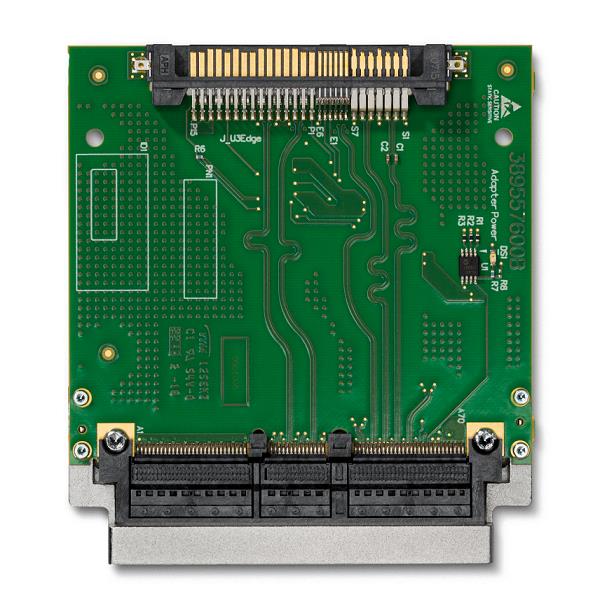
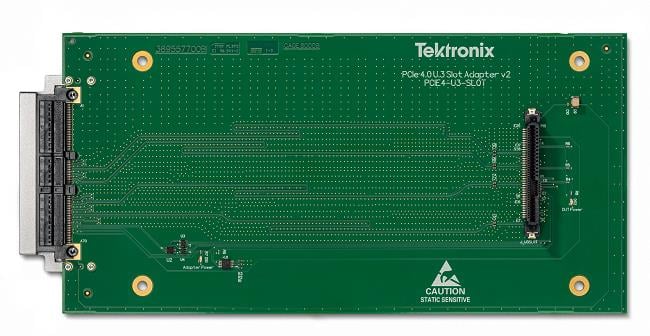
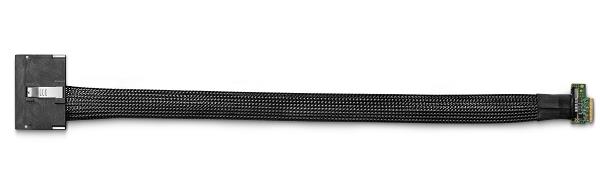
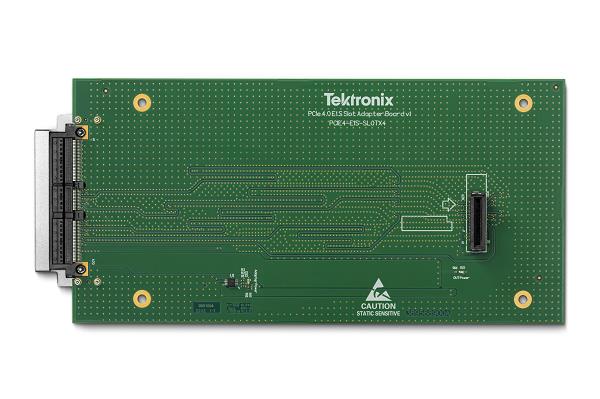
Adapters
The following adapters are available for use with the TMT4 Margin Tester and your device under test. You can purchase adapters individually or together in the PRO BUNDLE set. See the TMT4 datasheet on tek.com for ordering details.

An image of each adapter is shown, followed by a setup example for each adapter type.


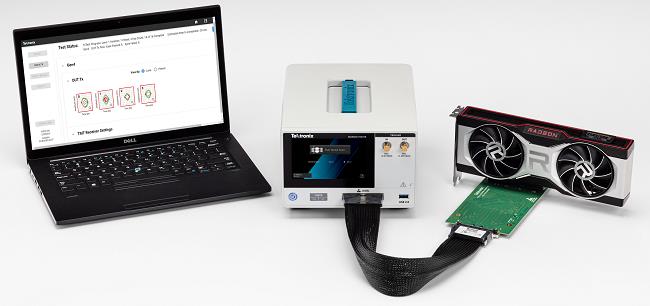
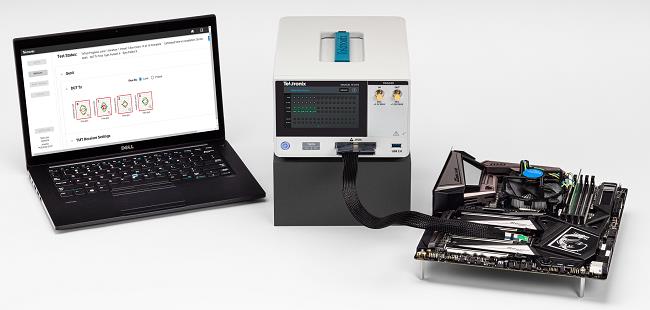
Example setups
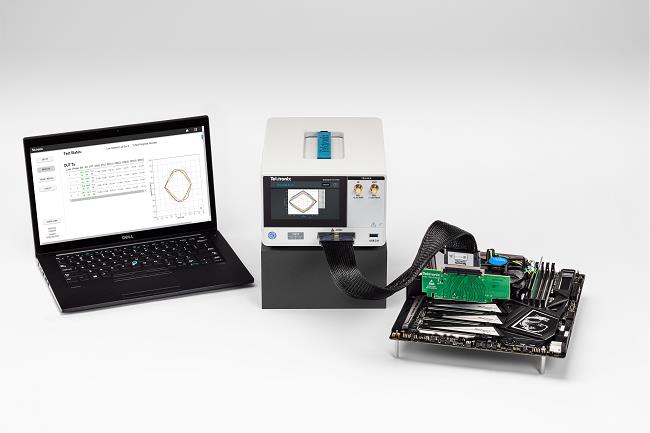
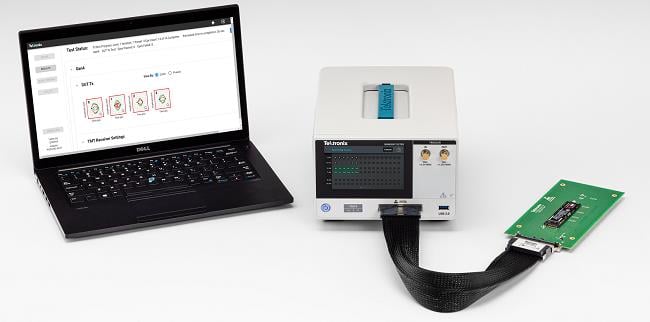
DUT Tx tests
The Device Under Test (DUT) Transmitter (Tx) tests are optimized to deliver insight into the transmitter path performance of the DUT in minutes. This section provides the benefits of the test, and an introduction to eye diagrams and link training using the TMT4 Margin Tester.
The DUT Tx test provides a fast look at the eye diagrams of the link formed between the Margin Tester and the DUT. The test also displays the associated link training parameters used to open the eye. This information enables you to conduct more regular performance checks of the link and allows you to quickly identify gross errors for any lane and preset combination.
For example, if you want to quickly see the effects of a BIOS change on the health of the link, you can scan the DUT, update the BIOS, scan the DUT again, and in minutes be able to evaluate the effect those changes had on the link performance.
Eye diagrams
As part of the DUT Tx tests, eye diagrams are shown for each lane and preset combination that represent the error-free region of the link formed between the DUT and the Margin Tester.
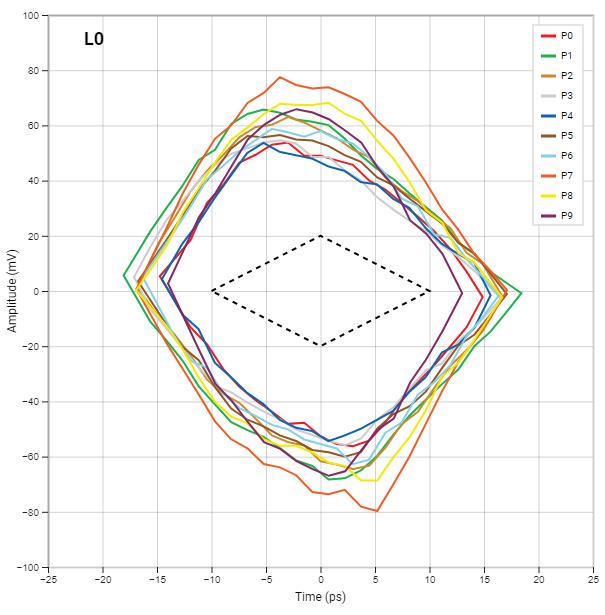
The eyes are shown in real-time, which means it only takes seconds before results begin to display.
Link training parameters
The Margin Tester shows not only the performance of the link by displaying eye diagrams, but also displays how the Margin Tester’s receivers were adjusted to maximize the generated eye. Some eyes may need especially high levels of equalization in order to form the link, so having both pieces of information is critical to understanding performance. The Margin Tester displays a table showing the Attenuation, VGA (Gain), CTLE, and 5 DFE taps values used to maximize the eye opening. This allows you to quickly see how much equalization is needed for each displayed eye diagram. The possible range of values for each of these equalization settings is shown in the following table.
| Equalization | Number of possible settings | Range |
|---|---|---|
| ATT | 8 | -10.0 dB to -2.0 dB |
| VGA | 15 | 0.0 dB to +8.0 dB |
| CTLE | 32 | +2.0 dB to +15.0 dB |
| DFE Tap 1 | 256 | -55.0 mV to +55.0 mV (typ1) |
| DFE Tap 2 | 128 | -44.0 mV to +43.3 mV |
| DFE Tap 3 | 128 | -22.0 mV to +21.7 mV |
| DFE Tap 4 | 128 | -16.0 mV to +15.8 mV |
| DFE Tap 5 | 128 | -11.0 mV to +10.8 mV |
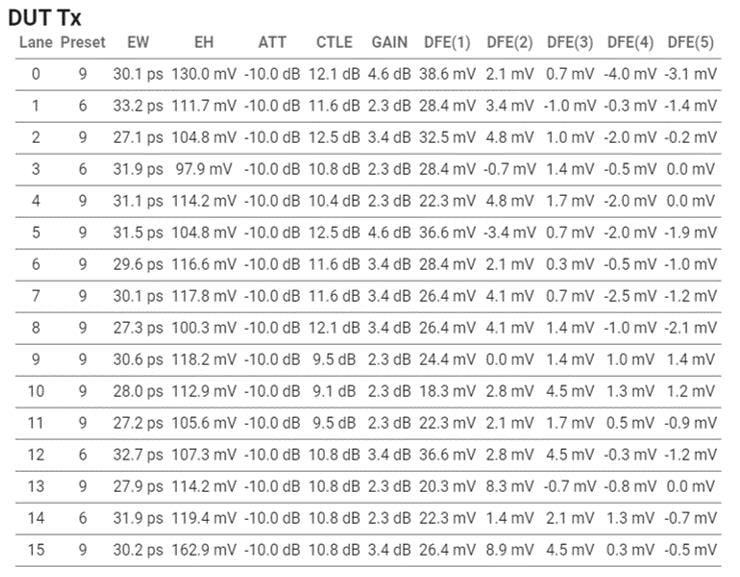
If an eye is wide open, but the equalization settings are pushed to their maximum, it may indicate there are some performance considerations for that given lane and preset combination.
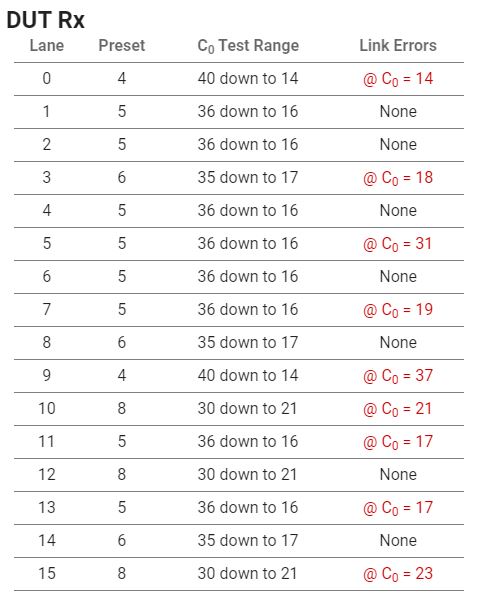
DUT Rx tests
The DUT receiver (Rx) test is a functional evaluation of the DUT’s receiver path.
The test determines how far the transmitted signal from the Margin Tester can be decreased, within a range of operation, before errors are returned. It allows you to evaluate functional Rx link health performance in as little as 30 seconds.
Quick scan Rx test
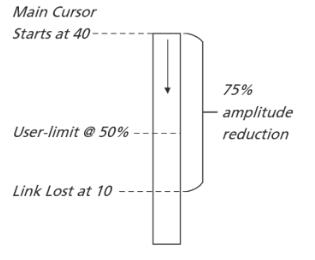
The quick test consists of a link train between the Margin Tester and DUT, where the DUT selects the presets for communication. The Margin Tester then steps down the transmitted amplitude by dropping the main cursor value by lane/preset, within an expected range of operation.
This provides a high-level evaluation of Rx performance quickly, which can help you determine if there are any problem lanes that may be worth investigating further with other equipment. If no errors are indicated, this is considered a functional pass. If errors are indicated, the main cursor value where the error occurred is displayed, and the test is considered a functional fail.
Custom scan Rx test
In the custom test, the receiver DUT requests of the TMT4 transmitter any valid combination of cursor coefficients on any and all lanes. This means that anything that the receiver under test requests can be tested.

When the receiver test is running, the TMT4 uses cursors to decrease the amplitude, but does not limit the test to a range. Instead, it pushes the receivers as far as they will go until an error is registered. It then reports back both the main cursor value and % in amplitude reduction at the point of failure. You can add a custom amplitude threshold value on the Custom Scan setup screen to assist in highlighting lanes that do not meet acceptance criteria.
Understanding the DUT Rx test
The Rx test decrements the TMT4's Tx Eq. main cursor by one, repeatedly, along with proportional adjustments to the pre and post cursors, until the link is lost.
The amount that the main cursor can be lowered is expressed as a percentage of the starting main cursor value; therefore, the larger the number, the better.
You can add a pass/fail limit on the Custom Scan setup screen to help highlight lanes that do not meet your acceptance criteria.
If the measured amplitude reduction exceeds the user-specified limit, then the result is displayed in black text. If not, it is shown in red text.
Quick Scan
The Quick Scan is the fastest scan option and can be done from the TMT4 front panel or from the Web interface.
Set up and run a Quick Scan
You can run a Quick Scan from the Web interface as follows.
- Click the Setup button and then set the Test Type to Quick Scan.
- Set the Generation (PCIe 3 or PCIe 4).
- Click the Run Scan button.
You can run a Quick Scan from the front panel as follows.
- Set the Generation (PCIe 3 or PCIe 4).
- Click the Run Quick Scan button on the display screen.
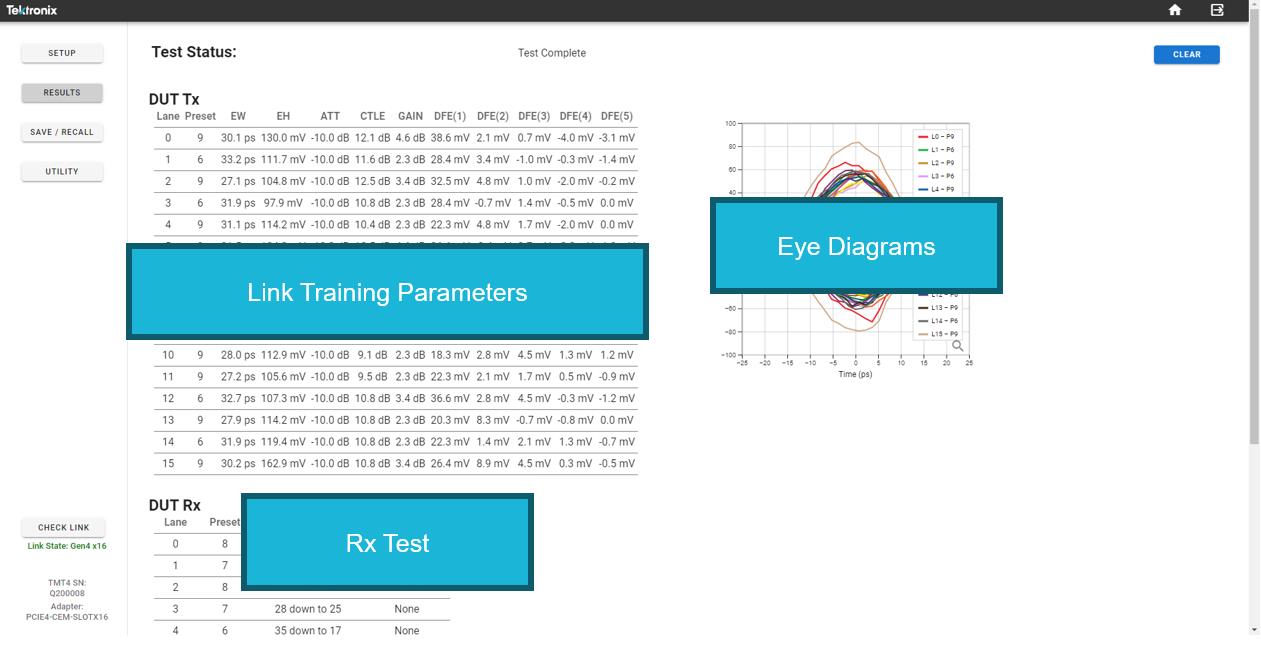
Results
The approximate test time for Gen 4 x16 links is 2-4 minutes. Once the test begins, the Results Test Status screen will automatically be displayed.
There are three results pages on the front panel. Each page contains a Home button, a Save button, and a Help button. The Save button will save results to a USB stick connected to the TMT4.
- Page 1: All scanned lanes along with the Tx preset, Tx eye width, Tx eye height, Rx preset, and Rx C0
- Page 2: Tx link training parameters
- Page 3: Eye diagrams
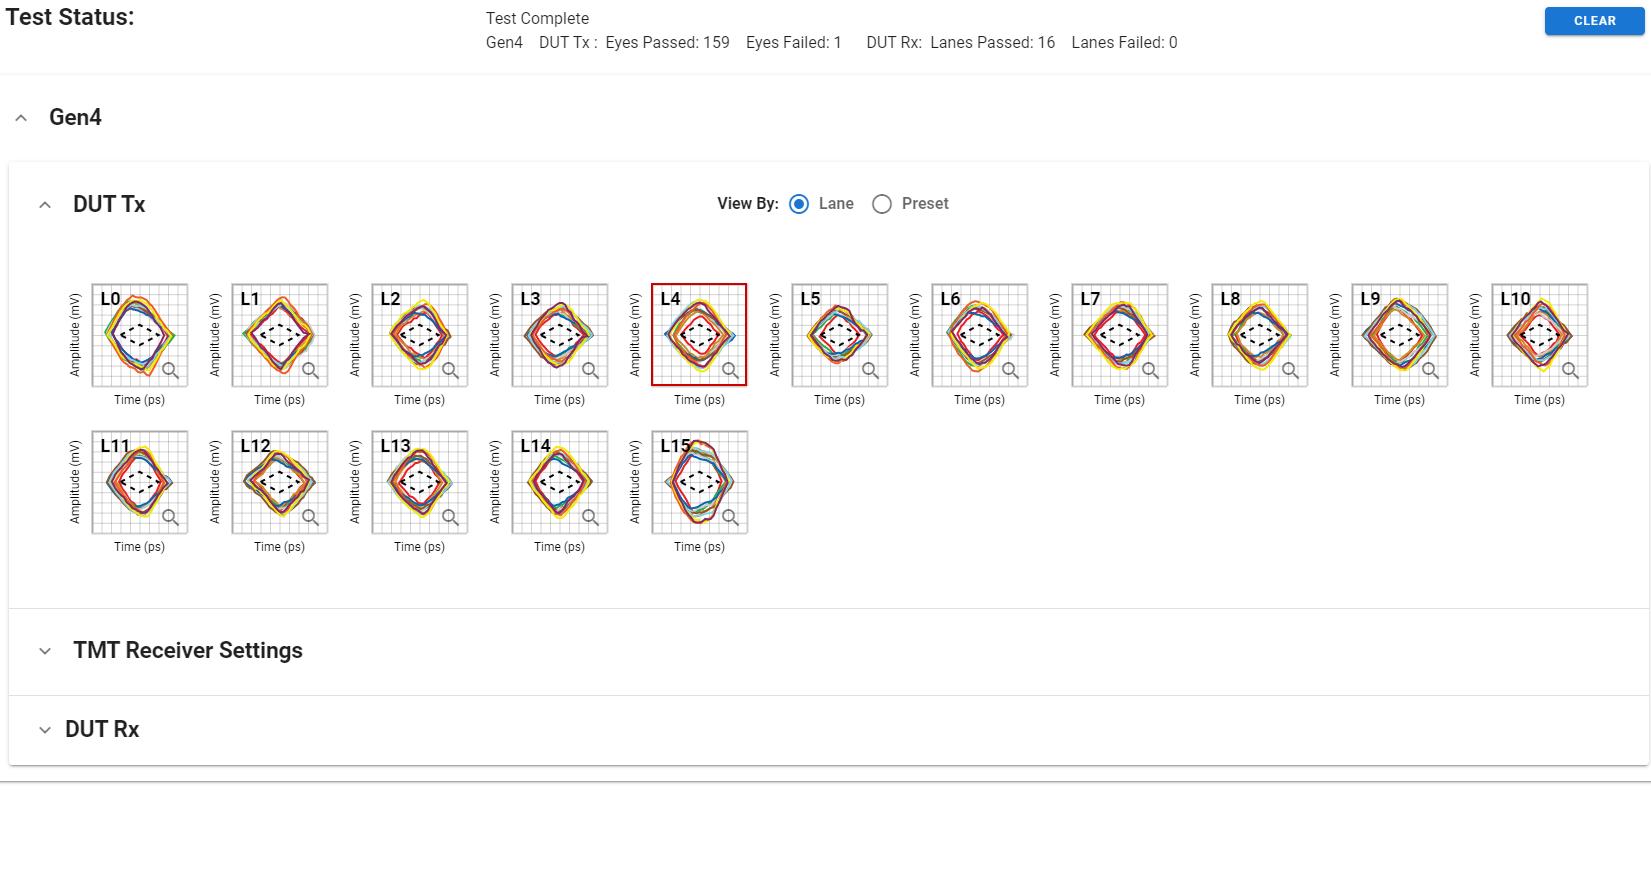
The three results areas on the Results panel in the Web interface are shown in the following image.
- For a DUT Tx test, the results show the resulting eye diagrams at the receiver of the TMT4 instrument, and the associated link training parameter values that show the equalization used at the TMT4 receivers to open the eyes.
- For a DUT Rx test, the results table shows the preset each lane is trained to, the expected test range based on the negotiated preset, and if any errors were found.
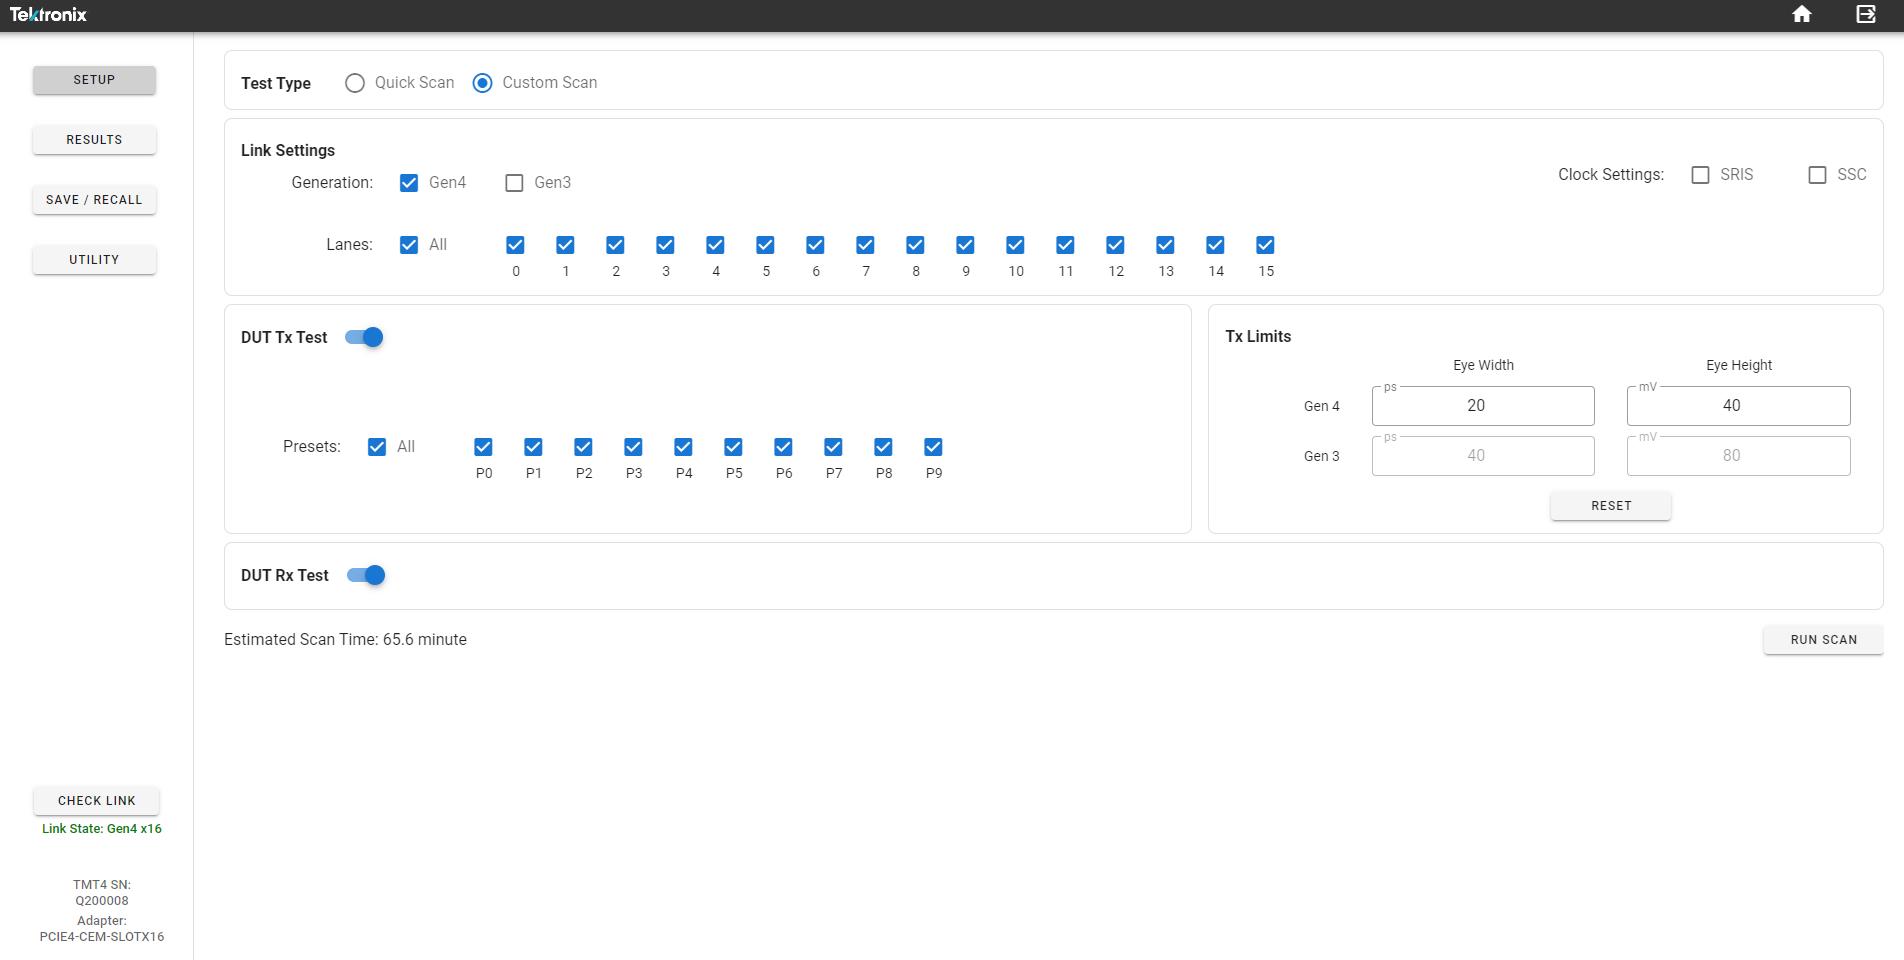
Custom Scan
The Custom Scan allows you to force specific test parameters to do more thorough evaluations of Tx signal paths.
Use Custom Scan for deeper investigation into specific lane-preset combinations and for a more comprehensive test of all lanes and presets. The Margin Tester will flag any results that fall outside the pass-fail limits you specify.
Set up and run a Custom Scan
You must use the Web interface to set up Custom Scan parameters. Set the following as desired for your testing needs.
| Settings | Range / Options |
|---|---|
| Generation | PCIe Gen 3 or Gen 4 |
| Lanes | Within the specified link width |
| Presets | Preset 0 - Preset 9 |
| Clock Settings | SSC and SRIS |
| Pass / Fail Limits | User specified |
| DUT Tx Test | Toggle on or off |
| DUT Rx Test | Toggle on or off. The Rx test is the same for Quick Scan and Custom Scan. |
Select Run Scan to run the scan after the parameters have been set. You can select DUT Tx Test or DUT Rx Test to run. For a Tx test, select the desired presets to test.
For the Rx test, select the test limits. You can add a custom amplitude threshold value on the Custom Scan setup screen to assist in highlighting lanes that do not meet acceptance criteria.

Custom Scan results
The approximate test time for Gen 4 x16 all lanes/presets is 25-30 minutes.
The Custom Scan results page provides a tiered results structure where data can be expanded and collapsed based on the generation tested or by the type of test in a specified generation. Both the Tx eye diagram and the link training parameter table results can be configured to view the results by lanes tested or by presets tested. This allows you to quickly view results across all charts and draw conclusions as to the performance of any given lane or preset grouping for up to 160 lane-preset combinations.
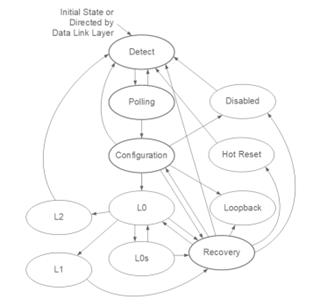
LTSSM monitoring
The state of the PCIe link is defined by a Link Training and Status State Machine (LTSSM). The LTSSM monitor provides information about the various states that the TMT4 Margin Tester experiences as a result of its interaction with the DUT, without regard to its role as a Root Complex (RC) or End Point (EP).
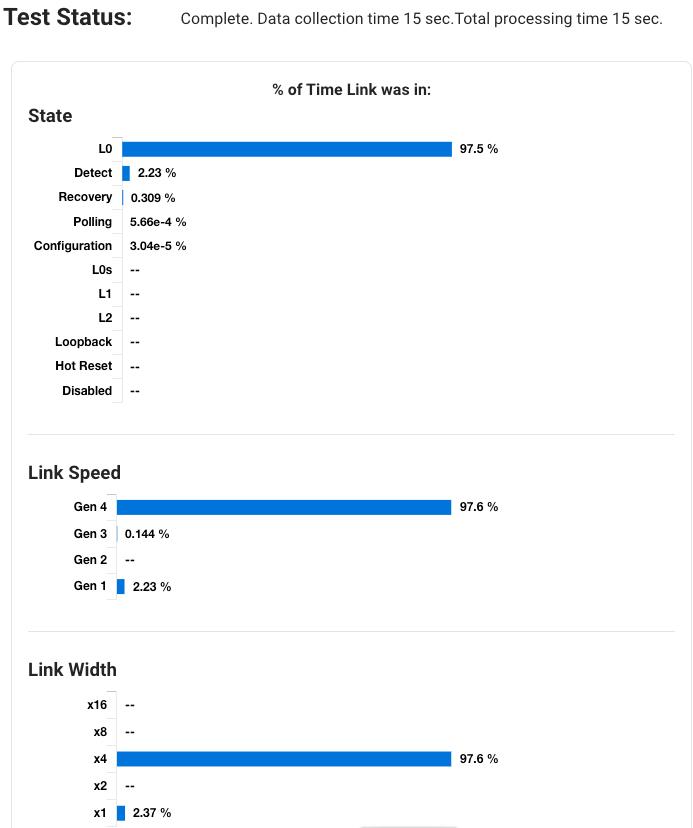
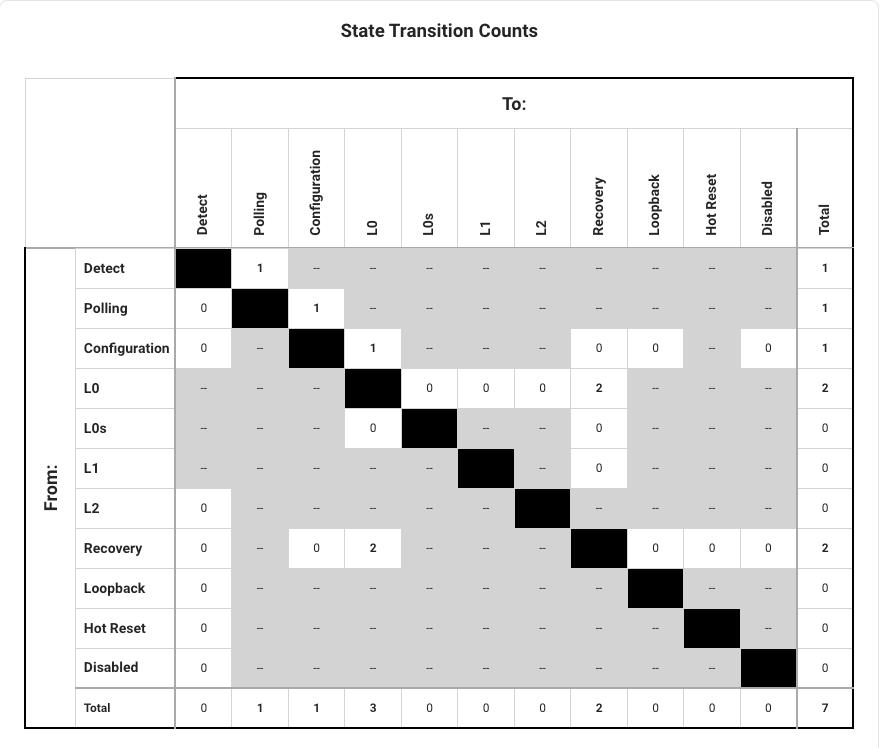
LTSSM Monitoring can be initiated manually or in the presence of a valid hardware Trigger in the signal. Additionally, a Trigger out signal can be generated on the occurrence of a selected event associated with a LTSSM state. Whenever performing LTSSM monitoring tests, the TMT4 results window displays the percentage of time that the link was seen in each of the LTSSM states and the transitions from one state to another using the LTSSM map.
Sub-state information
The LTSSM Setup window shows a graphical representation of the State Machine diagram for PCIe devices. Sub-state information is available for the Detect, Polling, Configuration, and Recovery states. To access the sub-state information, do the following.
- Hover over the desired LTSSM Major State.
- Click the chosen state to display the sub-state information.
- Click the Back button to return to the main LTSSM states diagram.
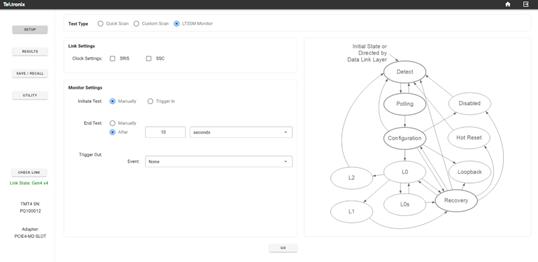
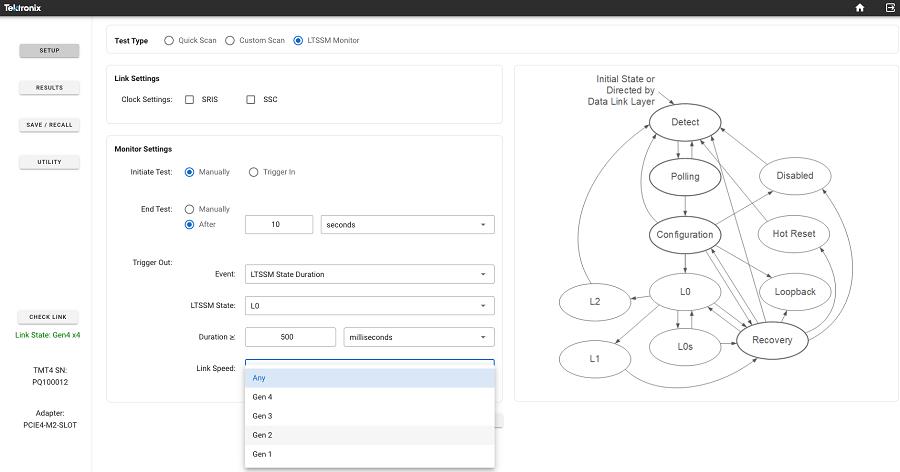
Setup and run LTSSM Monitor test
To configure and run the LTSSM Monitor Test in the Web UI, do the following.
-
Select Setup and then click the option next to LTSSM Monitor.

- Select the appropriate clock setting under Link Settings.
- You can select a manual start/stop or a triggered start for the test.
-
Select Manually to allow for test start when you click the Go button at the bottom of the screen.
Test stop will be set to occur when you click the Stop button.
-
Select Trigger In to allow for test start from an externally provided hardware trigger. The Trigger In becomes active on a HIGH to LOW transition. (See the TMT4 Specifications and Performance Verification Technical Reference on tek.com for further trigger information.)
Select After and set a specified amount of time in seconds, minutes, or hours after trigeer start to stop the test.
-
-
Trigger Out: If no trigger out signal is required, select None.
Any other selection will generate a trigger out hardware signal when one of the following valid test conditions is selected.
- State Entry or Exit: select one of 11 available States.
- State Transition: Select a From State and a To State.
- State Duration: Select the minimum time to satisfy the condition.
- Link Speed: This menu item appears for all of the above conditions except None. Select Any or the desired link speed.
Time for completion of a LTSSM test includes the user selected test time (for example, 10 s) plus additional processing time that is required for the data to be collected and compiled, such that the overall elapsed time can be a few seconds longer than the actual test.
LTSSM Monitor test results
Select the Results button to view the test results. In the Results window, you can view the % of time the link was in specific states and the count of state transitions.
The maximum test time of LTSSM events is limited to 6.5 hours.
Use the Save/Recall button in the left panel to save or recall files.
REST API Programming
You can program and control the instrument using REST API commands.
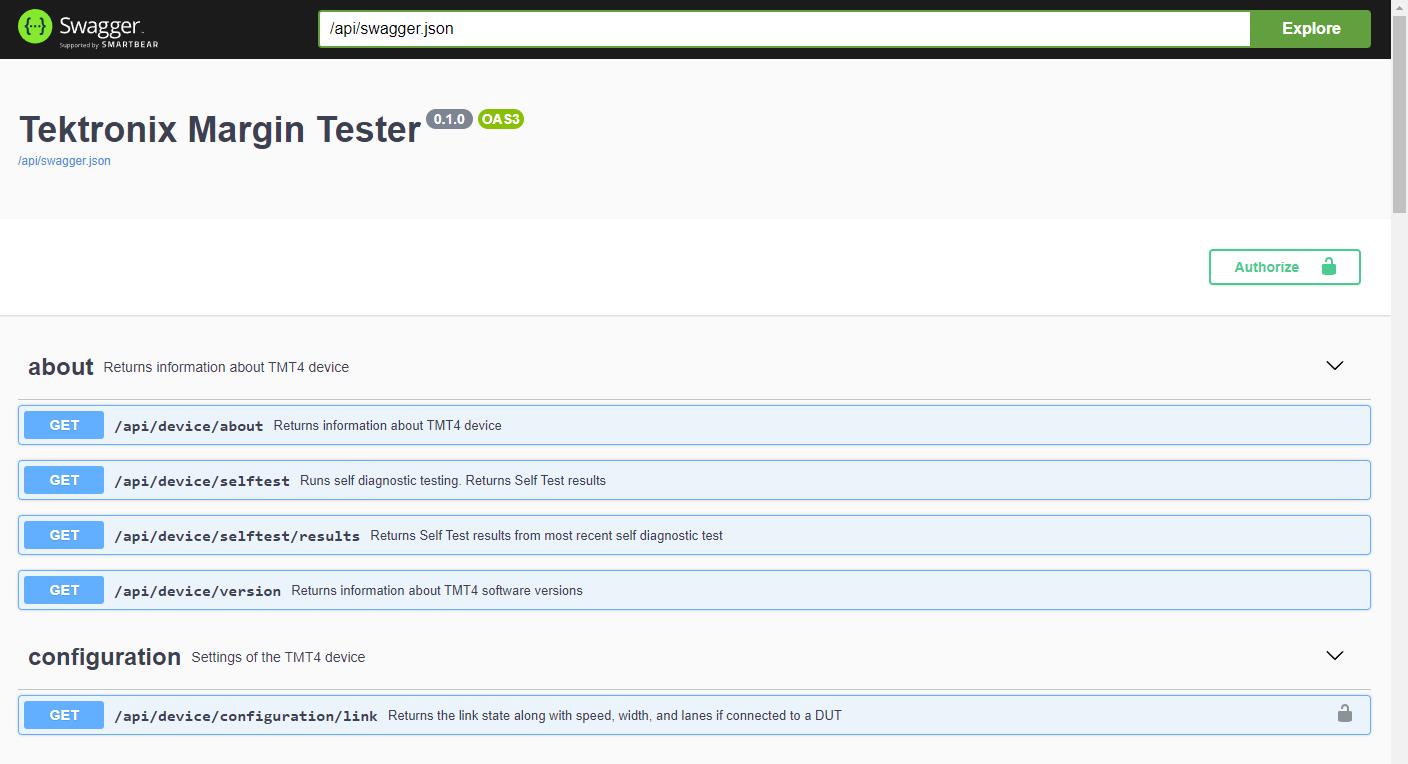
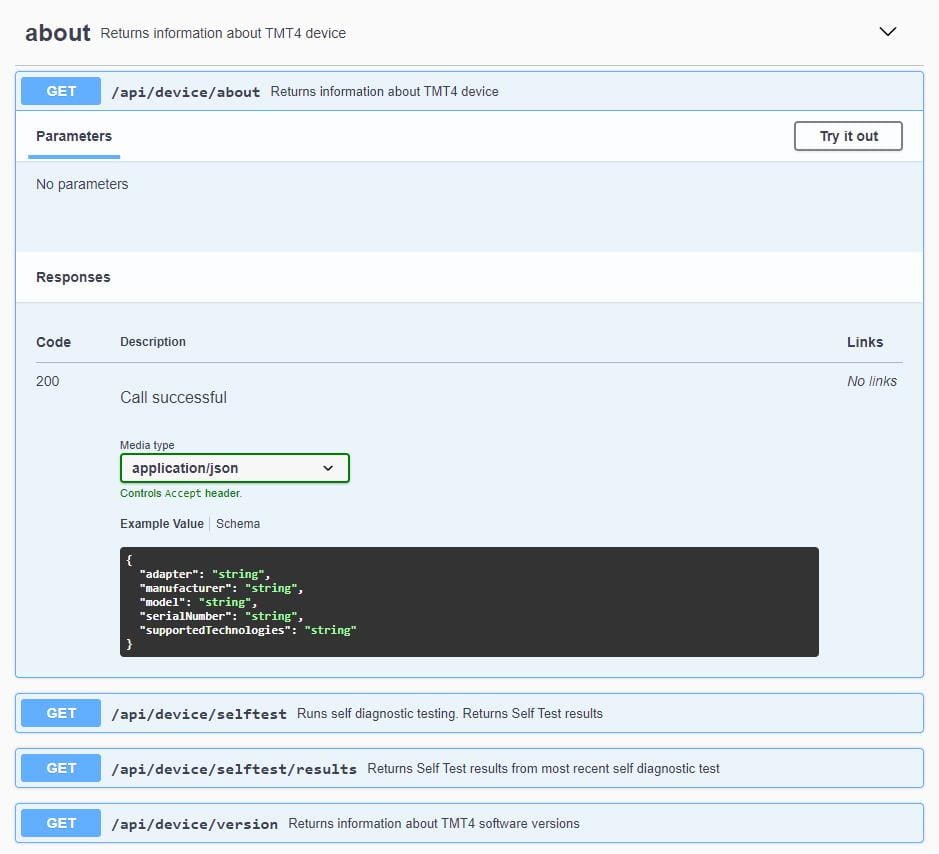
You can access the API interface and documentation through the Swagger interface. The interface provides the calls, parameters, a way to download a *.json file of all of the commands, and an interface for sending calls to the TMT4.
Access the API through the Swagger interface
- Enter the IP address of the instrument into a PC browser window.
- Add :5000/api/docs to the IP address. Example: 123.00.1.1:5000/api/docs
- The Swagger interface will appear in the browser.
Use API commands
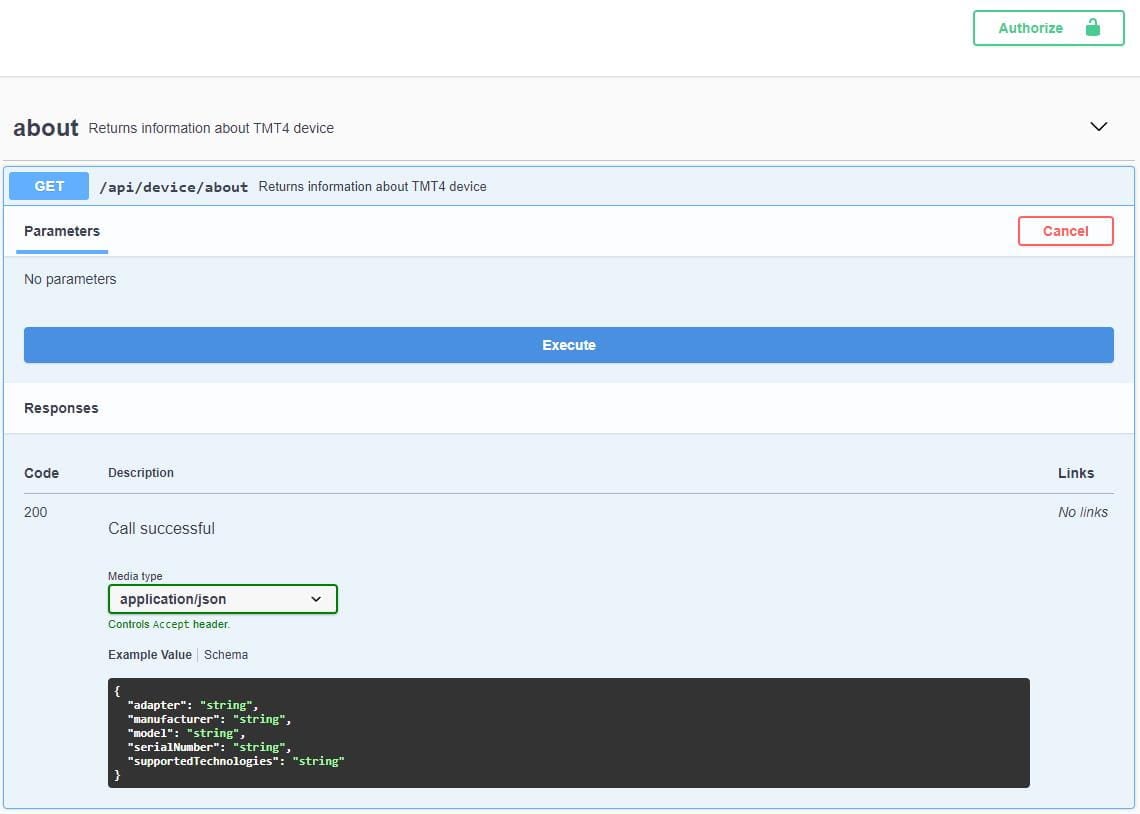
You can send API commands from the Swagger interface or your terminal. You can print requests from your terminal. Send commands from the Swagger interface as follows.
- Select the command you need and expand the view.
-
Click the Try It Out button.
-
Click the blue Execute button.
-
View the response information that appears in the Response body field.
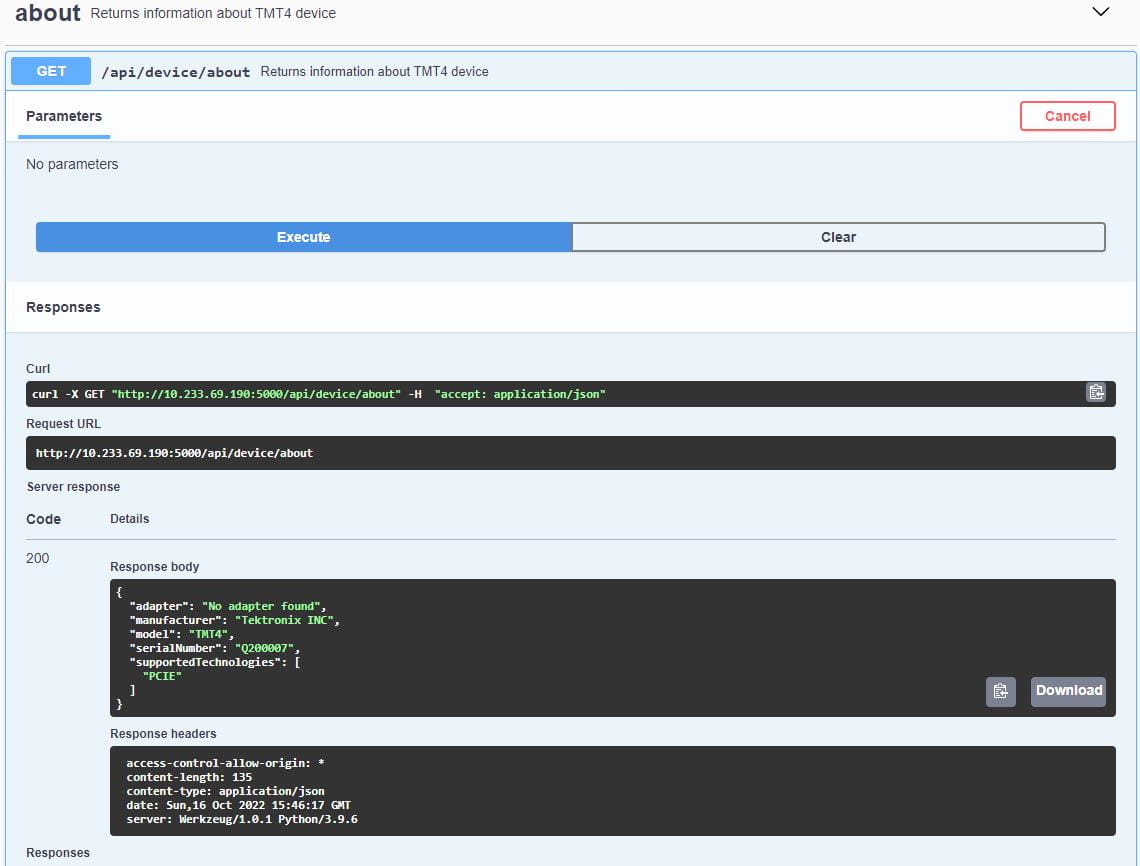
-
You can download the response or copy it to the clipboard, as needed, using the icons in the Response body field.

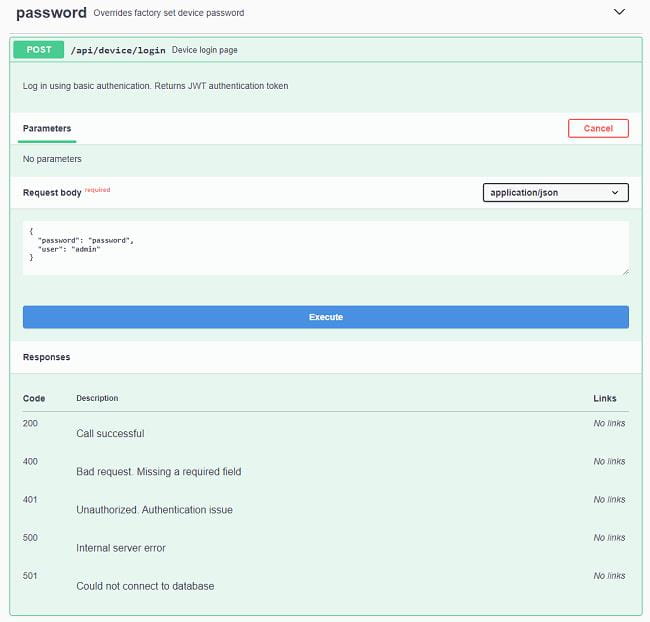
An unlocked padlock icon next to a command means you must be signed in to the instrument to use that command. Use the Login command and the Authorize button to sign in as follows.
- Select the Login command from the Password section and expand the view.
- Click the Try It Out button.
-
Enter the instrument user name and password in the Response body field.
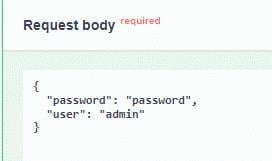
-
Click the Execute button.
-
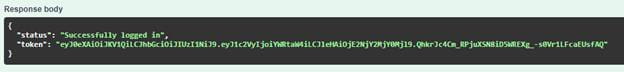
In the Response Body section, copy the long token string (without the quotation mark).
- Go to the top of the screen and click the Authorize button.
-
Paste the token string copied from the previous step into the token authentication Value field.

- Click the Authorize button.
- Check that all of the padlock icons have changed to a black locked image. This indicates that the commands are now available to use.
Example 1: Start a Custom Scan and download results
This example uses Python and shows how to use the TMT4 API to do the following.
- Format and send a login request.
- Format and send a Custom Scan request.
- Monitor the progress of a scan.
- Download and extract scan results.
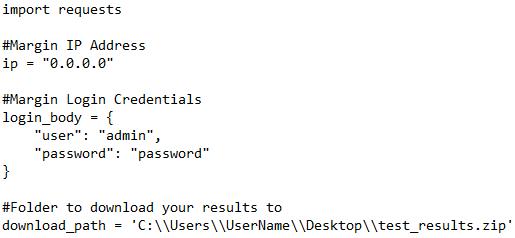
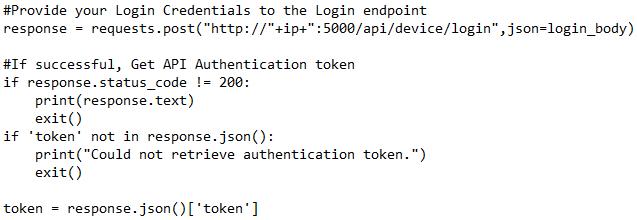
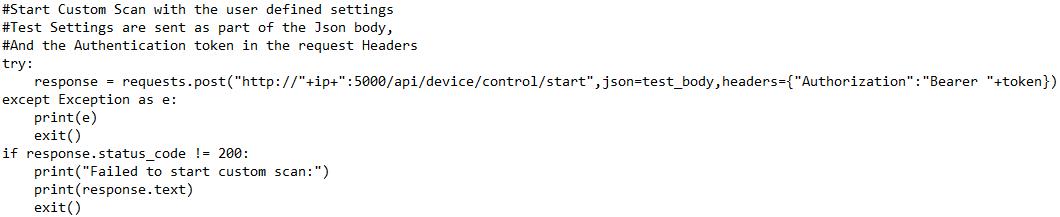
Format and send a login request
First you send a login request and then you send an authentification token. An authentification token is required to use any endpoint that changes the state or accesses certain information about the Margin Tester.
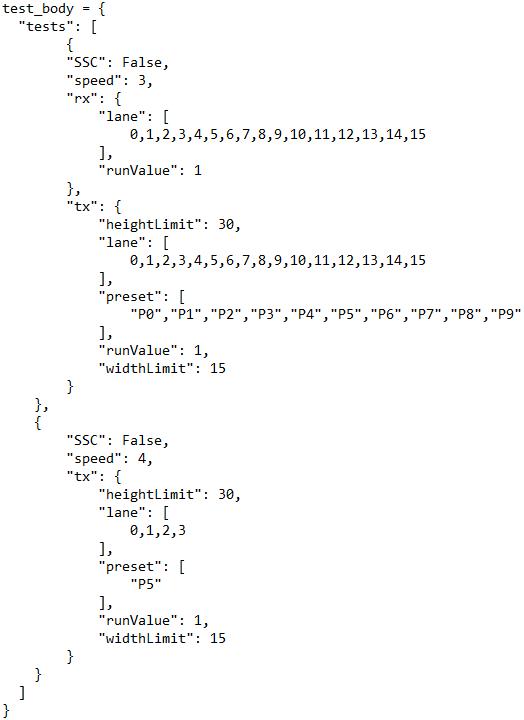
Format and send a Custom Scan request
Custom scans can be configured to specify which lanes, presets, and PCIE generations to scan. You can also set the Pass/Fail limits for TX eye height and eye width.
- A scan can be divided into multiple tests. A test is a Tx or Rx test with a given Generation (Speed) and Clock settings.
- This example is a scan with two tests. This first test is running on Generation 3 and the second test is running on Generation 4.
- In this example, both Tx and Rx tests will run for Generation 3 with all lanes and presets enabled for both tests, with SSC disabled. In the Generation 4, only a Tx scan is specified to run for lanes 0-3 for preset 5.
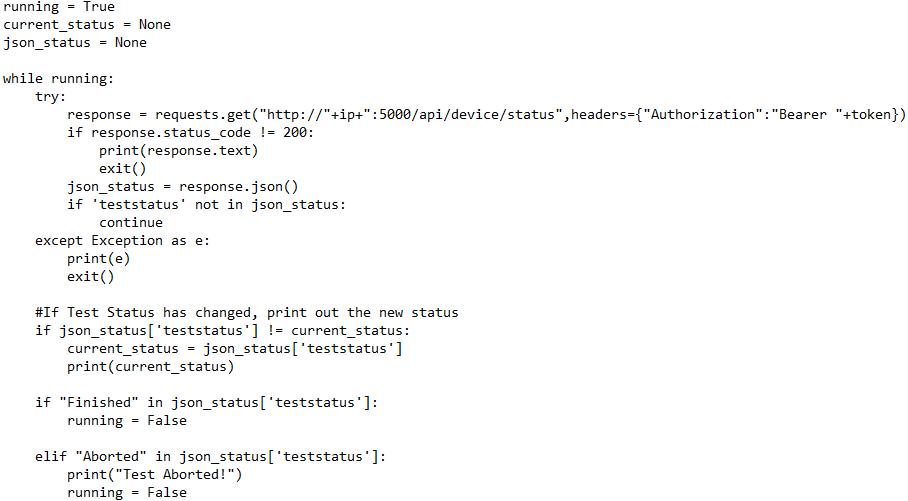
Monitor the progress of a scan
- Ping the Status endpoint to get the current status of the Margin Tester.
- View the 'teststatus' key in the return object to view the current test status.
- When 'teststatus' is either Aborted or Finished, scan is complete.
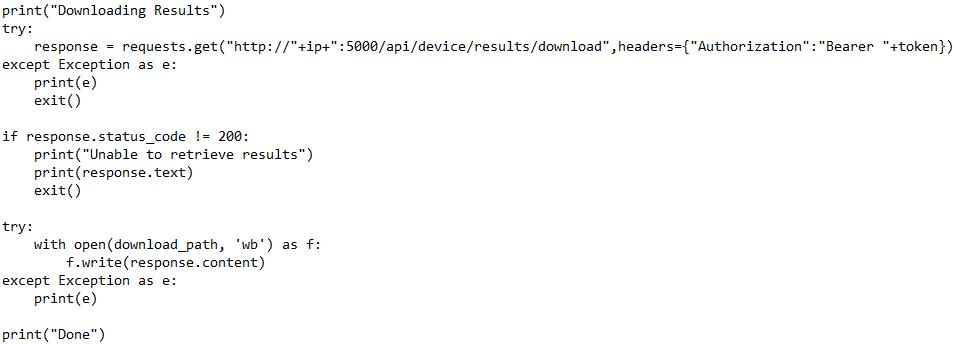
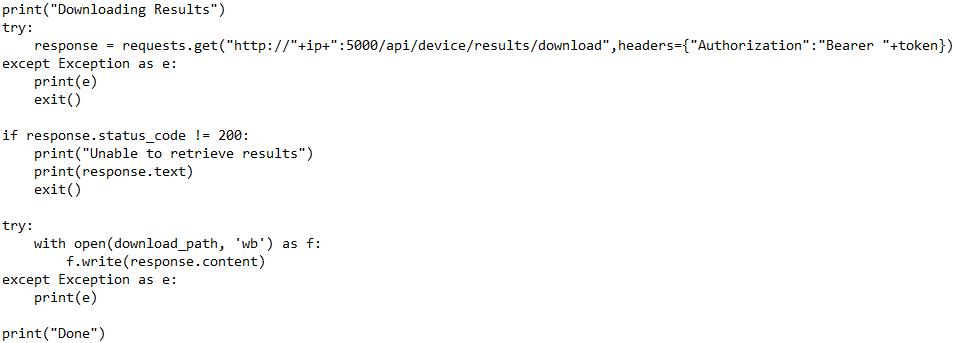
Download and extract Scan results
Results are returned in the form of a .zip file containing CSVs, charts, and more. You can either open the zip file and view the results as-is, or recall the zip file to the Web interface through the Save / Recall page.
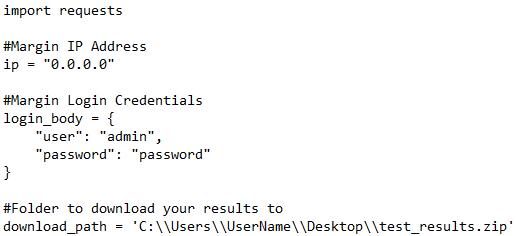
Example 2: Start a Quick Scan and download results
This example uses Python and shows how to use the TMT4 API to do the following.
- Format and send a login request.
- Format and send a Quick Scan request.
- Monitor the progress of a scan.
- View and download the scan results.
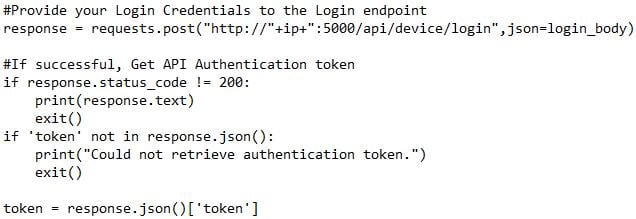
Format and send a login request
First you send a login request and then you send an authentification token. An authentification token is required to use any endpoint that changes the state or accesses certain information about the Margin Tester.
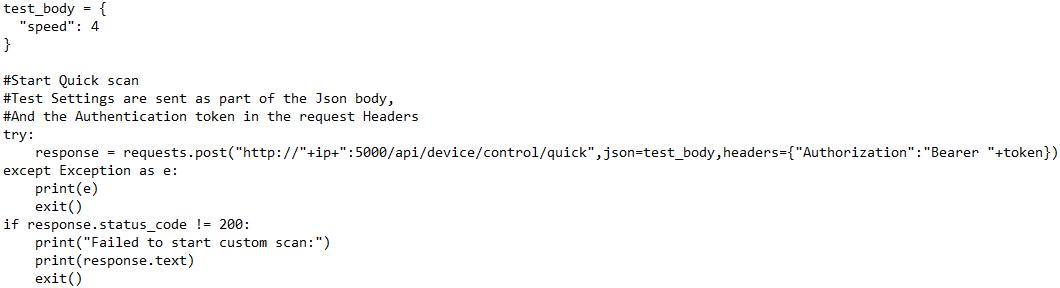
Initialize Quick Scan
- Quick Scan performs both a Tx and Rx test on all available lanes.
- Only PCIe Generation (Speed) is user-configurable. All other test configurations (lanes, presets, pass/fail limits, etc) are selected automatically.
- Quick Tx test lets all available lanes train to their preferred preset and reports Eye Widths, Eye Heights and Receiver Settings.
- One and only one preset is selected per lane. Maximum eye count is 16.
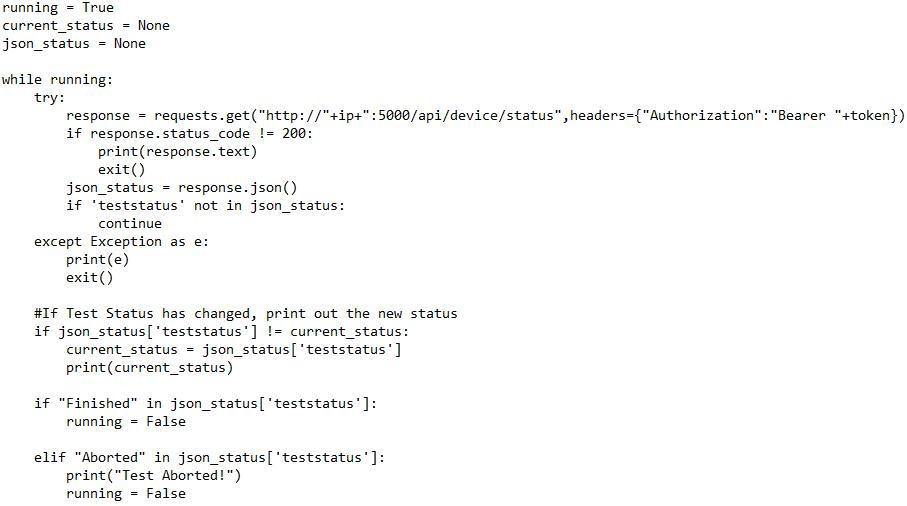
Monitor Scan Progress
- Ping the Status endpoint to get the current status of the Margin Tester.
- View the 'teststatus' key in the return object to view the current test status.
- When 'teststatus' is either Aborted or Finished, scan is complete.
Download and Extract Scan Results
Results are returned in the form of a Zip file containing CSVs, charts, and more. You can either open the zip file and view the results as-is, or recall the zip file to the Web UI via the Save / Recall page.
Help us improve our technical documentation. Provide feedback on our TekTalk documentation forum.