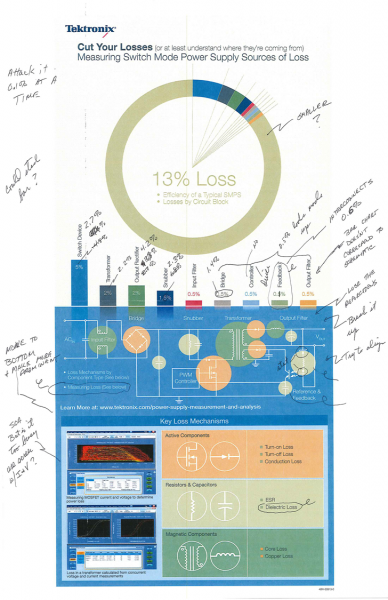

A couple of months ago I searched on the web for a summary of loss mechanisms in switch mode power supplies. I’m not a power supply designer, but I wanted to get some understanding of where energy was lost in a typical SMPS. I found lots of good information, but not the overview I was looking for.
After a few weeks of reading, cornering power supply designers in the halls and break rooms, and talking to applications engineers, a picture started to emerge. At this point I enlisted the help of a graphics designer and after a fair amount of iteration, we came up with the “Losses in Switch Mode Power Supply” infographic shown above.
For the final review, I got a few of our power supply designers in a conference room, and they had their way with it. These were a few of the comments:
“Not the best efficiency I’ve seen, but also not the worst.”
“Of course the numbers aren’t exact, but they’re realistic.”
“Follow the heat!”
“For every AC-DC designer, there are five engineers working on DC-DC closer to the point of load. Why don’t you do one for them?”
Based on the feedback from the meeting, we produced an improved version. Have a look at the final Switch Loss Infographic and add your thoughts in the comments section below.
Since publishing the above blog, Tektronix is currently offering discounts up to 89% on software application modules for qualifying oscilloscopes. Check out the details here and save away!