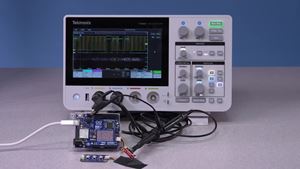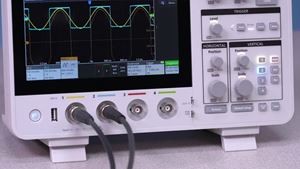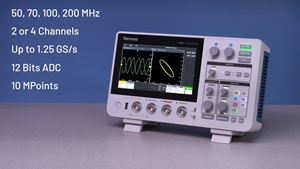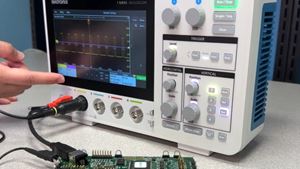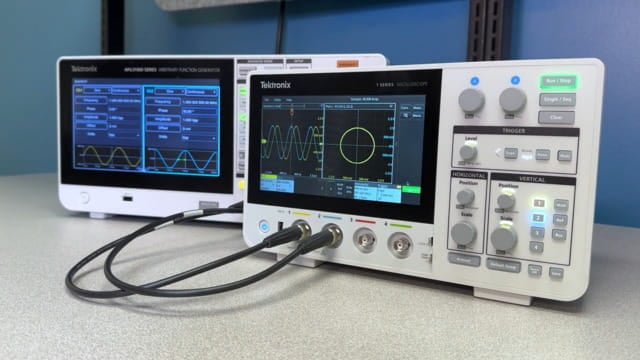
XY mode on an oscilloscope visualizes the relationship between two signals. To enable it, double-tap the Horizontal badge, then select acquisition settings. There, you can enable XY Plot for Channels 1 and 2.
This demonstration uses a dual-output AFG31000. You can see how the displayed shape changes as you apply two sine waves at approximately 1 MHz with equal amplitude and vary the phase shift. A 90° phase shift produces a circular pattern, whereas a 180° phase shift results in a straight line.
Длительность 1m 17s