Efficient system analysis and debug relies on insights but correlating signals across multiple domains has traditionally been a painful, technically challenging process. It can be difficult to figure out why a system isn’t working as expected without precise, synchronized insight into both time and frequency domains.
Spectrum View was created to solve that challenge. The 4, 5 and 6 Series MSO oscilloscopes employ dedicated digital downconverters on all channels that operate independently of time-domain settings and configuration. This enables their Spectrum View capability, which provides improved results in frequency analysis over traditional fast Fourier transforms (FFTs) and enables you to observe signal changes over time.
Optimize Both Time and Frequency Displays
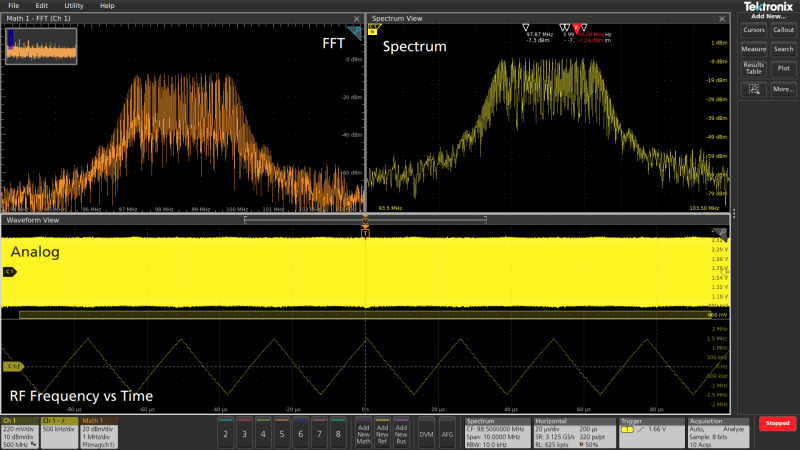
Spectrum View allows you to independently control time domain and RF domain settings—changing settings in one domain has no effect on the other domain. This makes it really easy to look at and correlate the two. This means that you can view individual cycles in the time domain while also viewing the spectrum, which is impossible with a traditional FFT. When using Spectrum View on multiple channels, you can set different center frequencies and view how RF behaviors are related and influencing each other.

Figure 1: FFT optimized vs Spectrum View
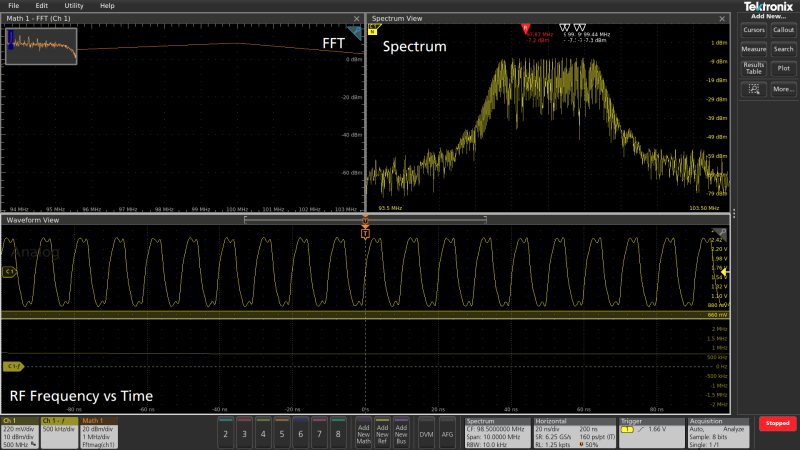
Figure 2: FFT with not enough samples vs Spectrum View
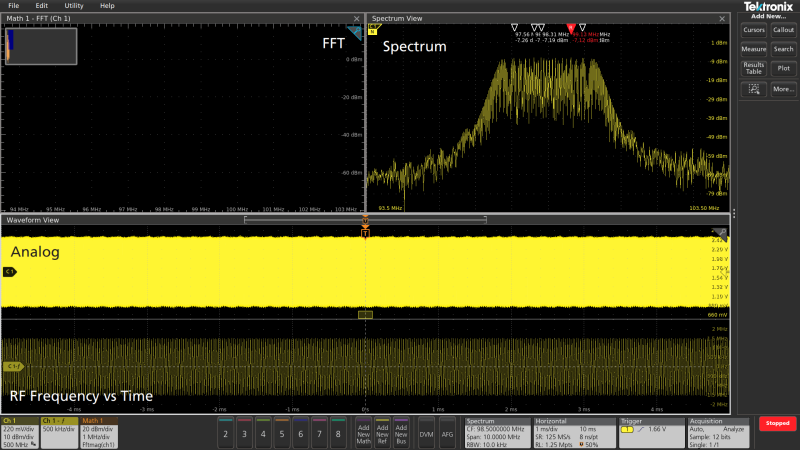
Figure 3: FFT with not enough sample rate vs Spectrum View
We've also added the ability for the digital downconverter to be a hardware input to the trigger system, which allows our DDC data to activate the trigger. This increases our probability of intercept and the ability to catch anomalies in the RF domain.
The hardware DDC acquires IQ baseband data for each of the channels. Because this is happening inside the ASIC, there's time correlation between the analog capture and the RF capture, which offers a significant benefit. The spectrum processing is independent from the analog signal path, which allows you to set settings independently. This is available on all channels simultaneously giving you more insight at your fingertips.
Watch the demo to see how Spectrum View differs from traditional oscilloscope FFTs.
Observe Signal Changes Over Time
Spectrum View not only allows you to set different center frequencies, but it also lets you to control which portion of the time domain record length is being used for the RF spectrum display. This is called Spectrum Time. Consider, for example, that you are probing something like the turn on behavior of a complex system. What are the bits of logic that are telling the clock to turn on or to stabilize to a certain frequency, and how is everything happening over a long turn-on period?
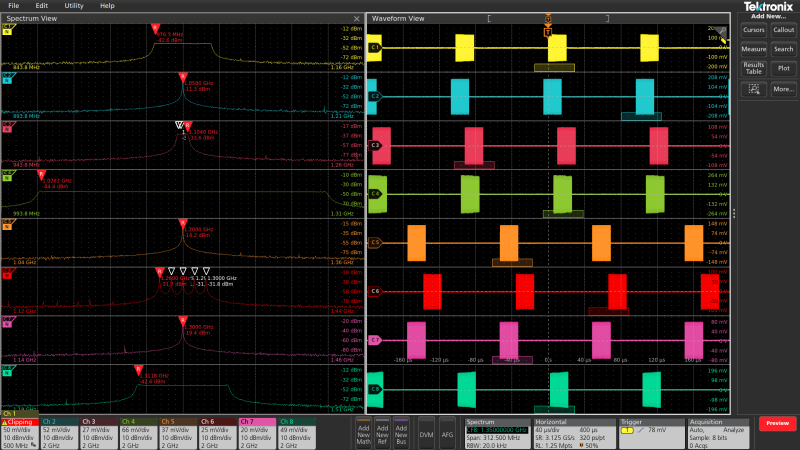
Figure 4: MSO58 8 channel Spectrum View multiple channel RF analysis
Think about debugging a system that has a 40 MHz clock which is exhibiting unpredictable variation in its frequency. This has traditionally been difficult to isolate and characterize with a traditional oscilloscope. With Spectrum View RF triggers on the RF versus time plot, it's easy to isolate this issue and look for what might be causing the issues.

Figure 5: Isolating MHz clock issue with frequency trigger
Watch the demo to learn more about using Spectrum View spectrum analysis on multiple channels.
Other Applications of Spectrum View
With Spectrum View, independent controls allow you to easily optimize your time domain view and your frequency display. Spectrum time allows you to observe signal changes over time so you can answer questions like: How is the spectrum changing over time? And how exactly did my time domain view look at that same time? What correlates with that spectrum?
That’s not all, though. Maybe your Bluetooth chip is causing power rail ripple, or maybe power rail ripple is causing issues on your Bluetooth chip. Learn more about applications of Spectrum View and how it works in our app notes.
"Spectrum View: A New Approach to Frequency Domain Analysis on Oscilloscopes" explains the under-the-hood hardware used to do digital down conversion.
“Step by Step EMI Troubleshooting with 4, 5 and 6 Series MSO Oscilloscopes” provides a guide to EMI troubleshooting with the 4 / 5 / 6 Series MSO oscilloscopes, including how using near-field probes and components on the board that may be causing emissions issues.
“Characterizing Self-Generated EMI for Wireless and IoT Products with 4, 5 or 6 Series MSO Oscilloscopes” details how to use near-field probes to look for potential sources of interference and correlate that interference with the rest of your system to determine root cause.