問題:
How Do I Create an Eye Diagram in DPOJET?
答案:
DPOJET is a powerful tool for Jitter and Timing analysis of high speed serial data signals. The eye diagram allows for quick visual inspection of the signal quality of high-speed serial signals. Creating an eye diagram in DPOJET is easy and can be done by completing the following steps.
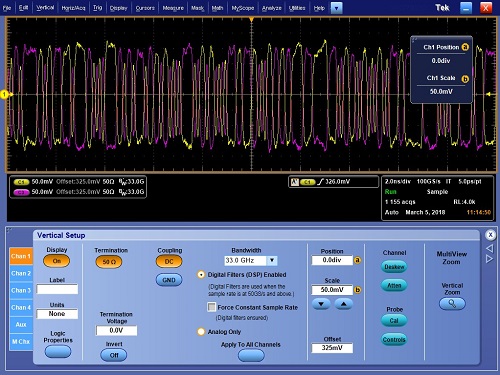
Step 1. Configure the Vertical Scale
To maximize acquisition quality and vertical accuracy, be sure to adjust the vertical scale of the channels in which the signal is being input. You want to set the scale such that the signal(s) takes as much of the vertical space on screen as possible without clipping at the top or bottom of the screen. This will ensure you are using the full dynamic range of the oscilloscope’s Analog to Digital Converter and will provide the highest resolution and accuracy.
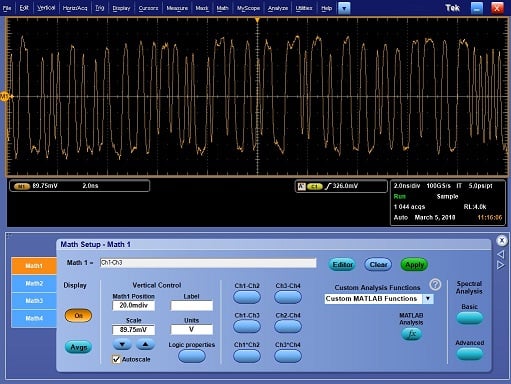
Step 2. Configure Math
If your signal comes from a single input channel, Skip to Step 3. If your signal is a differential pair input on two separate channels, configure MATH1 to calculate the difference between the channels. To maximize the sample rate the signals can be acquired at, input the differential signal on channels 1 and 3 or channels 2 and 4. Set MATH1 = CH1 – CH3 or MATH1 = CH2 – CH4
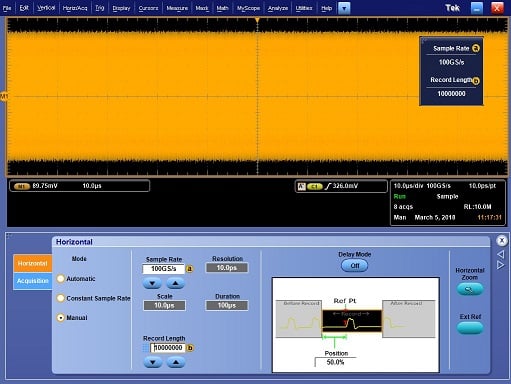
Step 3. Configure the Horizontal/Acquisition Settings
Configure the Horizontal/Acquisition settings of the scope to acquire enough record to contain several hundred or more edges. When configuring the Horizontal/Acquisition settings, you usually want to maximize the sample rate of the scope in order to maximize the horizontal time resolution of the waveform data. You will then need to also increase the record length so that you can capture at least several hundred or even thousands of edges.
For example, for an 8Gbps signal like PCI Express it is recommended to set the sample rate to 100 GS/s and the record length to 10 million points. The general recommendation is to set your sample rate to at least 10X your bit rate and then set your record length long enough to capture 1000 or more bit unit intervals.
The general rule of thumb is the more data DPOJET has to work with, the more accurate the analysis will be. However, too much data can result in long data processing times. 10 million points generally provides a good balance between speed and accuracy.
Step 4. Launch DPOJET
From the Analyze menu click on the following: Analyze -> Jitter and Eye Analysis (DPOJET) -> Select… This will open DPOJET and go to the Select tab where measurements can be added.
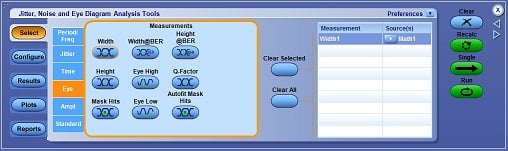
Step 5. Add a New Jitter or Eye Measurement
Plots in DPOJET, like the eye diagram, must be associated with a measurement in order to create them. Eye diagrams are associated with Jitter and Eye measurements so add a Jitter or Eye measurement to DPOJET. For this example let’s add an Eye Width measurement.
Step 6. Configure the Measurement
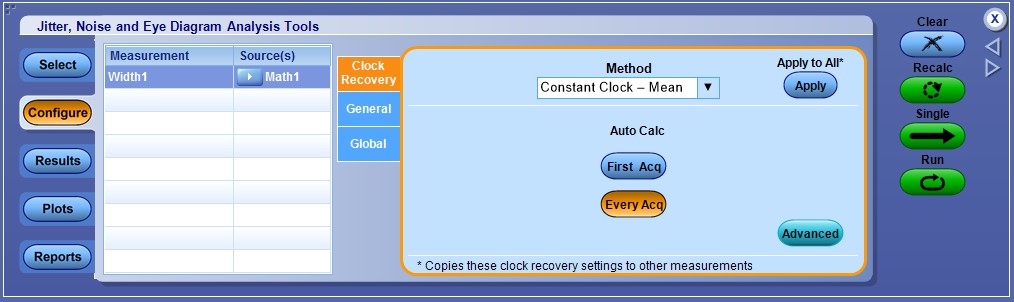
Go to the Configure tab in DPOJET and then go to the Clock Recovery tab. This tab allows you to configure how DPOJET will recover the clock so that it can make measurement on the data signal.
The default clock recovery Method is Constant Clock – Mean and can be used when the data clock is constant and does not change (i.e. no spread spectrum clocking (SSC)).
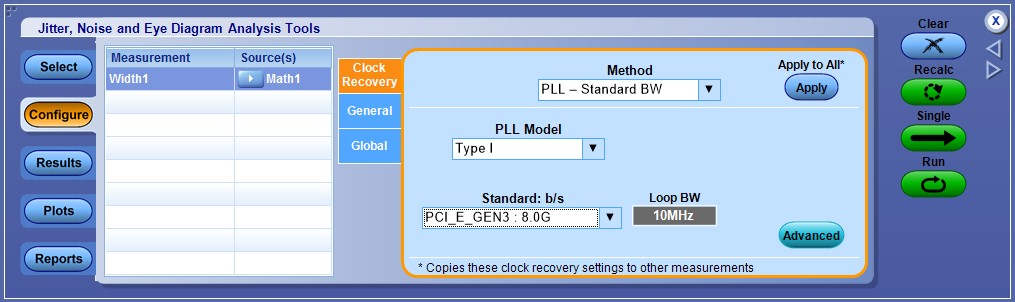
If your data signal is from a specific high-speed serial standard, the PLL – Standard BW Method can be used. Once selected, you will be able to choose from a drop-down what serial standard to use. This method uses a PLL model to follow changes in the clock rate and can be used with signals that contain SSC.
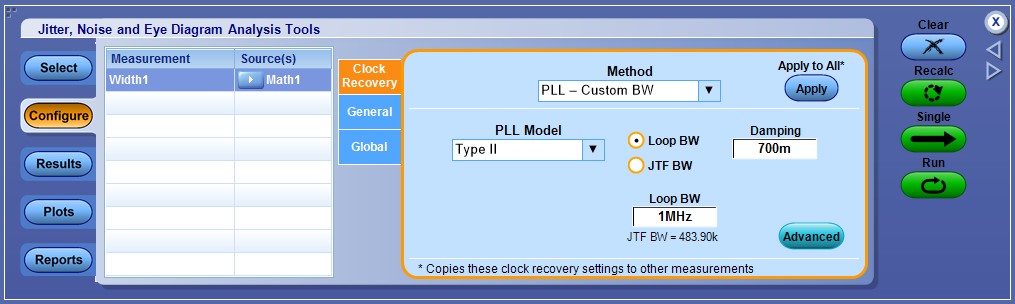
The PLL – Custom BW Method can be used when the signal does not follow a specific serial standard, but needs a PLL to track variations in the data clock or when you just want to be able to customize the PLL model.
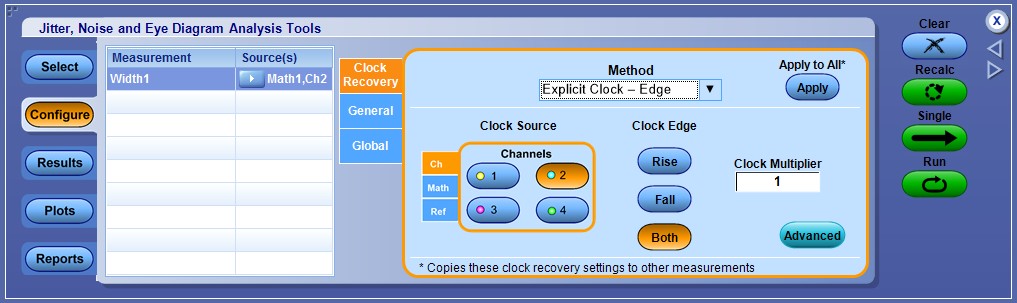
The Explicit Clock – Edge Method should be used when a data clock signal is physically available and is input into the oscilloscope such as in high speed serial standards like MIPI.
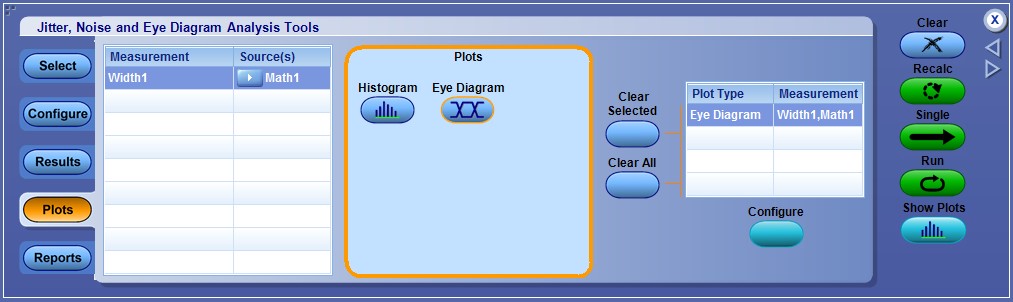
Step 7. Add an Eye Diagram Plot
Go to the plot tab and select the Width measurement you added earlier then click the Eye Diagram button to add an Eye Diagram Plot. DPOJET should now be sufficiently configured to generate an eye diagram for most high-speed serial signals.
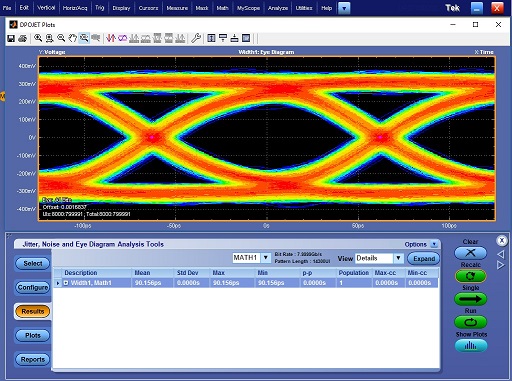
Step 8. Acquire the Signal and Analyze
If you have already acquired a waveform, click the Recalc button to start the analysis. If you have not already acquired the waveform, click the Single button to acquire the waveform and then start the analysis. (Note: The Single button in DPOJET is the equivalent of pressing the Single button on the front panel of the oscilloscope and then pressing the Recalc button in DPOJET after the signal has been acquired.) DPOJET will process the acquired data, output the measured value on the Results tab and generate an Eye diagram.
此常見問答集適用於:
產品系列: DPO70000SX ATI 效能示波器 DPO7000 DSA8300 Digital Sampling Oscilloscope (Discontinued) MSO/DPO70000DX 混合訊號/數位螢光示波器 MSO/DPO5000B 混合訊號示波器
產品:
常見問答集 ID 467706
檢視所有常見問答集 »