
Researchers, engineers, and technicians working on RF applications generally have a good grasp on the use and benefits of spectrum analyzers, whether they are traditional swept spectrum analyzers (TSA) or more modern vector signal analyzers (VSA). They understand the key specifications and principles of operation of these important RF instruments. However, sometimes they are puzzled by a slightly different category of instrument: Real-time spectrum analyzers (RSAs or RTSAs). Maybe due to a lack of awareness of the functionality and measurement capabilities of RSAs, sometimes users miss out on the advantages and benefits of RSAs as a key tool on their RF toolbelt. At Tektronix, we have years of experience designing, manufacturing, and deploying RSAs, so we thought we’d clear up a few misconceptions and perhaps even myths that circulate around the use of RSAs.
Misconception 1: All modern FFT-based analyzers are real-time spectrum analyzers.
It’s true that modern spectrum analyzers employ FFT-based spectrum analysis to convert a fast-sampled, time-domain signal into a frequency-domain spectrum. To obtain the magnitude and frequency of each component of the input signal, these analyzers sample it at a high rate and perform the transform on the data. While these modern, FFT-based spectrum analyzers can have high-frequency resolution and measure signals with wide dynamic range, they can miss events that occur between the instrument’s sampling intervals.
To analyze signals in real time means, then, that the real-time spectrum analyzers must:
- Sample the input signal fast enough to satisfy Nyquist criteria. That is, the sampling frequency must exceed twice the bandwidth of interest.
- Perform all computations continuously and fast enough, such that the output of the analysis keeps up with changes in the input signal between short sampling intervals.
- Support a long enough analysis interval for the narrowest resolution bandwidth (RBW) of interest.
- Implement a fast Fourier transform rate to exceed the Nyquist criteria for the RBW of interest.
Tektronix employs an architecture for its real-time spectrum analyzers designed to overcome the measurement limitations of modern VSAs, addressing the challenges associated with transient and dynamic RF signals. Tektronix RSAs perform signal analysis using real-time digital signal processing (DSP) prior to memory storage as opposed to the post-acquisition processing that is common in VSA architectures. This real-time processing approach allows the user to discover events that are invisible to other architectures. Also, it enables triggering on those events, allowing their selective capture into memory. Figure 1 shows how Tektronix RSAs acquire and process many more FFTs in shorter intervals to keep up with very rapid signal changes.
Figure 1: Diagram illustrating the difference between FFT-based VSAs and RSAs
Misconception 2: RSAs are just for spectrograms and RF waterfall visualizations
RSAs are great at producing insightful visualizations of the variation of the RF spectrum over time (spectrograms). Using these 2-D plots, users can readily observe how the spectrum is behaving over a particular measurement interval. As the blue spectrogram in Figure 2 shows, each tone changes in frequency as time progresses, while their amplitude tends to remain constant.
Figure 2: Spectrum and Spectrogram of a multi-tone signal
However, Tektronix RSAs can produce many more types of measurement results and visualizations in the time and frequency domains, giving users additional information on the nature and characteristics of the acquired signals, even those very fast, transient signals that VSAs normally miss.
One of the most useful tools for visualizing rapidly changing or fleeting RF signals is the DPX™ spectrum trace. Tektronix’s patented DPX technology uses hardware DSP processing and rasterizing of the samples into pixel information to create a full-motion live RF spectrum display. It even allows users to see different signals at the same frequency, but separated by time or power levels, thanks to its color-grading feature.
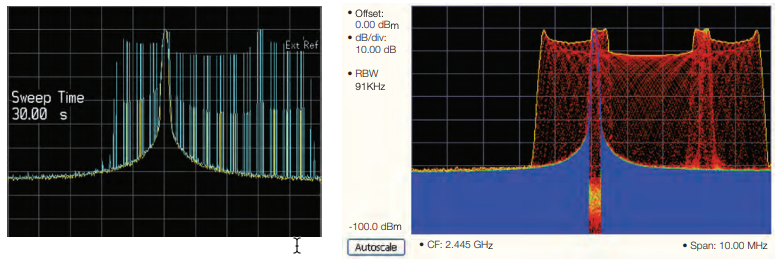
Figure 3: Comparison of a swept spectrum acquisition MaxHold trace after 120 seconds vs. a DPX MaxHold trace after 20 seconds
Spectrum analyzers are primarily frequency domain instruments, but there are many measurements where it is useful either to observe spectral features in the time domain, or to control where spectral measurements are made as a function of time.
There are many types of measurements made on RF signals that include time as a parameter, such as:
- Frequency and phase vs. time
- Amplitude or power vs. time
- I and Q vs. time
- Modulation parameters vs. time (frequency deviation, phase error, magnitude error, error vector magnitude)
- Frequency and phase settling
Examination of frequency measurements over time can help engineers diagnose very quickly critical issues with transmitters. Modulation typically varies parameters like frequency, amplitude, or phase over time, and examining time plots of these can show how the system is behaving.
One of the most useful correlations between the time and frequency domains applies to pulse measurements, allowing users to perform extensive analysis of individual pulses, as well as producing statistical and trend information on millions of subsequent pulses. Figure 4 illustrates Tektronix SignalVu-PC software enabling measurements of the characteristics of both individual pulses and large sets of pulses.
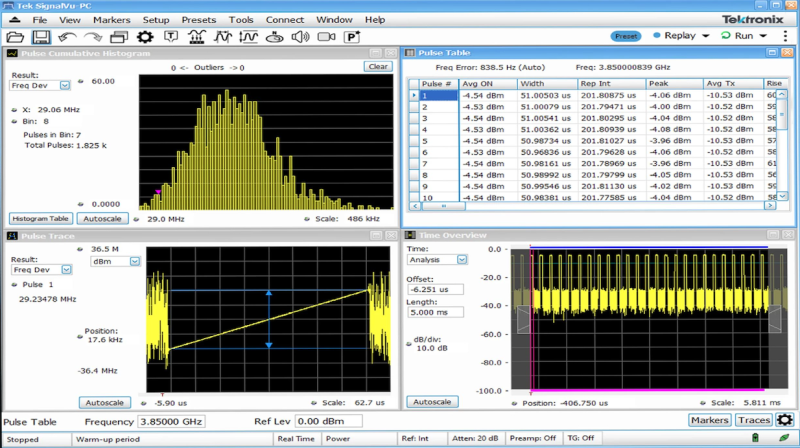
Figure 4: SignalVu-PC software running on Tek RSAs for analysis of individual pulses, pulse to pulse measurements, and statistical results on thousands of pulses
Misconception 3: RSAs have similar triggering capabilities to VSAs
Like VSAs, Tektronix RTSAs provide several methods of internal and external triggering, including external voltage rising edges and internal IQ power triggers. However, unlike traditional VSAs, DPX technology also enables new methods of analysis and triggering for time-variant signals:
- Frequency mask triggering: The RSA compares the spectrum shape to a user-defined mask and triggers the instrument based on a specified change in spectrum shape (Fig.5). The RSA can trigger on rising or falling frequencies, similar to how a time domain level trigger works. With this powerful technique, Tek RSAs can reliably detect signals far below full-scale even in the presence of other signals at much higher levels. This ability to trigger on weak signals in the presence of strong ones is critical for detecting intermittent signals, the presence of inter-modulation products, transient spectrum containment violations, and other frequency effects.

Figure 5: Trigger event where the transient signal breaks the boundary of the frequency mask
- DPX density trigger: Since the DPX spectrum is a 2D array in frequency and amplitude, users can define a box with upper and lower frequencies and upper and lower amplitudes (Fig. 6). When the signal density in this box crosses the specified threshold, the instrument gets triggered. For example, this feature enables users to capture records only if the signal appears more frequently than expected, helping them to distinguish between a transient spur and more permanent, systematic spurs.

Figure 6: Setting up a DPX density trigger box in frequency and amplitude
- Time qualified trigger: The RSA looks at the width of an RF pulse and triggers based on its duration, making it ideal for operating in fast and dynamic RF pulse environments.
Conclusion
Here we have clarified three key misconceptions surrounding the differences between vector signal analyzers and real-time spectrum analyzers. We noted first that Tektronix RSAs can process FFT records continuously and fast enough to keep up with fast changes in the input signal. We also reviewed how Tektronix RSAs can produce not only spectrograms, but many more types of measurement results and visualizations in the time and frequency domains. Following that, we covered how DPX technology enables new methods of analysis and triggering for time-variant signals. With renewed awareness of the functionality and measurement capabilities of Tektronix RSAs and SignalVu-PC software, now you can add them to your RF toolset and take advantage of their advanced time and frequency analysis power.


