For many RF playback applications, the hardware component is often seen as the most important factor for generating the real-world signal environments needed to fully test products under test in the lab. However, for applications where only interference capture and signal analysis are needed, software playback gives RF engineers and spectrum managers a more flexible and cost-effective way to meet signal generation requirements. In this post, I walk through how to do this using SignalVu-PC and DataVu-PC applications along with Tektronix USB-based spectrum analyzers.
You can record signals with either DataVu-PC or SignalVu-PC. DataVu-PC has the advantage of being able to record with two instruments simultaneously. DataVu-PC also allows you to control one instrument in, say, a broad-spectrum sweep and then allows you to zoom in and display and record a 40 MHz BW portion of that signal. This can be very useful because you can simultaneously scan, stare, and record with this kind of set up.
DataVu-PC and SignalVu-PC can both be used in the playback of the signal. There are different tasks that each of these applications are better suited for. Recorded signals can become very large (approximately 100 GB for 8 minutes of recorded RF signal). As you might expect, DataVu-PC is great for managing very large file sizes. Once you have located a smaller portion of the signal that you’d like to further investigate, DataVu-PC can help you find and snip out that portion to be loaded into SignalVu-PC. SignalVu-PC is the preferred tool for diving into the details of the signal of interest.
Capturing two signals simultaneously
DataVu-PC software can deal with two signals from two different receivers simultaneously, one can be used for monitoring, the other one can be used for real-time analysis. Note that DataVu-PC connects and start measuring automatically once a Tektronix USB real-time spectrum analyzer is connected to your PC via a USB 3.0 connection. In Figure 1 below, you can move your mouse over the area of interest of trace 2, and left click Zoom to DPX. The width of the cursor in this case is 40 MHz. The displayed width on screen depends on the span of the wide band sweep. Then, the detailed DPX spectrum (trace 1) is presented.

Figure 1. Monitoring and analysis using DataVu-PC software
Another useful DataVu-PC feature is RSALiveVu. This allows you to manually control two instruments connected to a single PC. In addition to the example above of RSA #1 sweeping a wide span and RSA #2 analyzing at a portion of the signal, you can also have two instruments looking at independent 40 MHz bandwidths. You can also observe the two live-persistence displays at the same time you are recording, which can be useful as it allow you to see any over range conditions.
The problem with over range signal conditions, like a strong transmitter coming near the RSA while a recording is being made, is that it can distort the recording until the over range condition is cleared. Clearing the over range condition could be a matter of adjusting the Reference Level or removing the higher power transmitter from the vicinity of where the recording is being made. Having the ability to see what you are recording is an invaluable feature of DataVu-PC.
DPX spectrum recording with SignalVu-PC
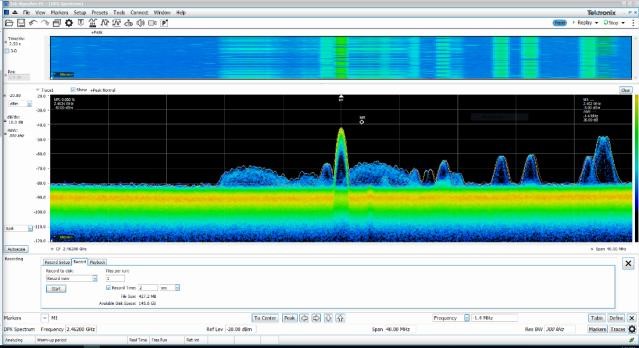
The DPX display is what’s used to view real-time spectrum information within the SignalVu-PC application. When used with a Tektronix spectrum analyzer, it allows you to see extremely brief signals and processes by processing many thousands of spectrums per second and presenting this information in a color graded bitmap display. The different colors represent the density of spectral activity. The DPX display includes a split option to show the spectrum and spectrogram separately as shown in Figure 2 below.
In the figures, you can see that it’s easy to observe an interference signal generated at 2.46 GHz and then to use the SignalVu-PC Record function to capture the signal. The controls for this feature are found under the video recorder icon found in the upper portion of the display which brings up the Recording control menu. In this example, the record time was set as 2s, and the colored traces then were saved to disk as a .R3F file. Using this file, the DataVu-PC software can playback (software) the complete signals, and search for the interference signals.

Figure 2. DPX spectrum recording
Playback with DataVu-PC
To perform the playback, simply launch the DataVu-PC software and load the .R3F file that was stored by SignalVu-PC. Figure 3 shows the loading process in action. First, the Load File control was used, and the path selected where the .R3F recorded file was to be stored. Note that the recorded file was named, and a PC system time stamp was applied to the file name. Next, once the .R3F file was loaded, DataVu-PC automatically converted the file to a .TIQ file format and finishes loading it. The process length varies depending on the size of the recorded file.

Figure 3. Loading a .R3F file in DataVu-PC software.
Figure 4 below shows the playback progress of the recorded signals. There are three graphs in this window. The top view shows a power vs. frequency display of the waveform in the loaded file. You can mouse over the first graphs to see the frequency and power (dBm). The middle graph describes a spectrogram display, and moving the mouse over it tells you the frequency, power (dBm) and time. The last one is a power vs. time display. You can mouse over this view to show the power (dBm) at this moment.

Figure 4. Playback the recorded signals.
The bottom green bar is used for playback control, which shows the progress of the playback within the loaded file. You can jump to any part of the playback by left-clicking within the playback control bar. The start and stop times of the playback can be selected within the bottom green bar, also with a double click.
Searching for interference
DataVu-PC provides three different ways to search for the interference: power threshold, pulse and frequency mask.
The power threshold searches through the loaded file and finds the instances where the specified power threshold is met or exceeded. Figure 5 shows the set-up window of power threshold and the searching results. Power threshold is the power level of the signal in dBm that need to be met for the search to mark the event as a positive result. Minimum Dropout Duration lets you set the number of samples for how long the event may drop below the input threshold before the signal is marked as another event. Minimum Pulse Duration sets how long the shortest event can be. Moving Average Filter performs a moving average calculation on the recorded data as the search is performed, which will help to filter out short duration signal spikes that may produce false positive results. Moving Average Filter Points describes the number of sample points that the moving average calculation is performed on for each sample. After this is configured the results are presented in the eMarker view.

Figure 5. Power threshold search set up and eMarker view.
The Pulse Search function is what lets you find pulse and pulse description information. Pulse Search is a two-pass search where the power threshold is used as a reference point to identify pulses and the start and stop of the pulse is determined by a 3 dB-down point from the RMS of the peak power of the pulse. This ensures consistent pulse measurements and results. Figure 6 shows the set-up window of Pulse Search and the searching results. Compute Pulse Frequencies computes the start and stop frequencies of the pulse. Other than the Compute Pulse Frequencies, the other set-up options are the same as that of power threshold search. The results are presented in the eMarker view.

Figure 6. Pulse search set up and eMarker view.
Frequency Mask is a tool that can be used to search for and mark events that violate a defined frequency mask. This is especially useful for pinpointing spurious signals within a transmission or any signal that otherwise violates a desired power level and frequency range. A frequency mask is a line composed of at least two points. Points can be added or removed visually by right-clicking the display at the desired location, or manually by clicking Add Point or Remove Point. Points can also be removed within the display by dragging.
Clicking Auto-Mask automatically creates a mask around the current signal trace, at a slightly higher power level. This powerful function allows for creation of a very precise mask that can detect a spurious signal within a standard transmission. The amount of points used in the creation of the Auto-Mask can be increased or decreased by adjusting Automask Points. The entire frequency mask can be adjusted slightly up or down by clicking Raise All Points or Lower All Points. The maximum and minimum display power can be adjusted with Max Display Power and Min Display Power. The mask bandwidth can also be modified. Once the desired frequency has been created, click Start to begin searching for violations of the frequency mask. Frequency mask profiles can be saved and later loaded. All points can be cleared, or a completely fresh mask created.
After the searching process, a list of eMarkers is displayed, representing events that violated the frequency mask. In Figure 7, the file of a frequency mask was loaded to capture the signals of interference shown in Figure 2. Then after left-clicking Start, the search results were displayed in the eMarker results in Figure 8.

Figure 7. Mask frequency search set up.

Figure 8. eMarker results.
In the eMarker results, there are 40 markers captured in 38.89 seconds. The information on start time, stop time, pulse duration, PRI, start frequency and stop frequency is provided. You can choose the options of deleting them all, adding eMarkers, exporting as PDFs, importing markers or saving eMarkers as well. Besides these, you could choose the start index and end index by right-clicking the point of interest to playback part of the results in series. Note that up to 2,000,000 eMarkers are available as results from any kind of search.
In this example, marker 4 was chosen as the start index, and marker 6 was chosen as stop index. You can analyze the duration between the two indexes. From this in Figure 9 you can see the captured interference. The captured signals can be saved as .TIQ file which can be reloaded by SignalVu-PC software for deeper analysis.

Figure 9. Frequency search
In Figure 10, SignalVu-PC software was used to recall the saved .TIQ file demodulation. Here, you can see that the interference signal was modulated by PI/4DQPSK with a symbol rate of 18kHz and you also can view the constellation.

Figure 10. Demodulation of the captured interference.
Learn more about SignalVu-PC, DataVu-PC and our full line-up of spectrum analyzers.