Contact us
Call us at
Available 6:00 AM – 5:00 PM (PST) Business Days
Download
Download Manuals, Datasheets, Software and more:
Feedback
Serial Triggering and Analysis Application Modules
AERO • AUDIO • AUTO • AUTOMAX • COMP • EMBD • FLEX • USB • ENET Datasheet
The products on this datasheet are no longer being sold by Tektronix.
View Tektronix Encore for reconditioned test equipment.
Check support and warranty status for these products.
More Information
- Analysis Software for Oscilloscopes
- MSO/DPO4000 Mixed Signal Oscilloscope (Discontinued)
- MDO4000C Mixed Domain Oscilloscope
- MSO3000 / DPO3000
- MDO3000 Mixed Domain Oscilloscope
- Explore more Software models
Read Online:

Key features
- Automated Serial Triggering, Decode, and Search options for I2C, SPI, CAN, CAN FD, LIN, FlexRay, RS-232/422/485/UART, MIL-STD-1553, ARINC 429, I2S/LJ/ RJ/T DM, USB, and Ethernet.
- Trigger on all the critical elements of a serial bus such as address, data, etc.
- Decode all the critical elements of each message. No more counting 1s and 0s!
- Search through long acquisitions using user-defined criteria to find specific messages. Search mark table provides a tabular view of the events found during an automated search.
- Export Search Mark table data to .csv file.
- Event table shows decoded serial bus activity in a tabular, time-stamped format for quick summary of system activity.
- Export Event table data to .csv file.
Serial triggering and analysis application modules
On a serial bus, a single signal often includes address, control, data, and clock information. This can make isolating events of interest difficult. The Serial Application modules for the MDO4000C, MDO3000, and MSO/DPO2000B Series transform the oscilloscope into a robust tool for debugging serial buses with automatic trigger, decode, and search for I2C, SPI, CAN, CAN FD, LIN, FlexRay, RS-232/422/485/UART, MIL-STD-1553, ARINC 429, I2S/LJ/RJ/TDM, USB2, and Ethernet.

Serial triggering
Trigger on packet content such as start of packet, specific addresses, specific data content, unique identifiers, etc. on popular serial interfaces such as I2C, SPI, CAN, CAN FD, LIN, FlexRay, RS-232/422/485/UART, MIL-STD-1553, ARINC 429, and I2S/LJ/RJ/TDM, USB2, and Ethernet.
Bus display
Provides a higher-level, combined view of the individual signals (clock, data, chip enable, etc.) that make up your bus, making it easy to identify where packets begin and end and identifying sub-packet components such as address, data, identifier, CRC, etc.
Bus decoding
Tired of having to visually inspect the waveform to count clocks, determine if each bit is a 1 or a 0, combine bits into bytes, and determine the hex value? Let the oscilloscope with a Serial Application module do it for you! Once you’ve set up a bus, the oscilloscope will decode each packet on the bus, and display the value in hex, binary, decimal (LIN, MIL-STD-1553, and FlexRay, USB and Ethernet only), signed decimal (I2S/LJ/RJ/TDM only), or ASCII (RS-232/422/485/UART, USB and Ethernet only) in the bus waveform.


Event table
In addition to seeing decoded packet data on the bus waveform itself, you can view all captured packets in a tabular view much like you would see in a software listing. Packets are time stamped and listed consecutively with columns for each component (Address, Data, etc.).

Search
Serial triggering is very useful for isolating the event of interest, but once you’ve captured it and need to analyze the surrounding data, what do you do? In the past, users had to manually scroll through the waveform counting and converting bits and looking for what caused the event. With a Serial Application module, you can enable the oscilloscope to automatically search through the acquired data for user-defined criteria including serial packet content. Each occurrence is highlighted by a search mark. Rapid navigation between marks is as simple as pressing the Previous (←) and Next (→) buttons on the oscilloscope front panel. The Search Mark table provides a tabular view of all events found during an automated search. The search mark data can be exported to a .csv file.

Specifications
I²C Characteristics
- Bus setup options
- Sources (Clock and Data)
Analog channels 1-4
Digital channels D0-D15
- Thresholds
- Per-channel thresholds
- Recommended probing
- Single ended
- Include R/W in address
- Yes or No
- Decode formats available
- Hex, Binary
- Display modes
Mode Description Bus Bus only Bus and waveforms Simultaneous display of bus and logic waveforms Event table Decoded packet data in a tabular view 
I2C bus setup, showing selection of bus display modes.

- Bus trigger and search options
Characteristic Description Trigger and/or Search On Start
Stop
Repeated Start
Missing AckAddress (7 or 10 bit) with R/W Selection
Data (number of bytes 1-5)
Address and Data
Triggering on a specific address value on the I2C bus.

- Bus decode
Characteristic Description Maximum Clock/Data Rate Up to 10 Mb/s (for automated decoding of bus)
Decode Display Start (green bracket)
Address (yellow box)
Missing Ack (red ! symbol)
Data (cyan box)
Stop (red bracket)
Event table for I2C bus with all captured packets time stamped and in a tabular view.

SPI Characteristics
- Bus setup options
Characteristic Description Sources (Clock, Slave Select, MOSI, and MISO) Analog channels 1-4 Digital channels D0-D15
Thresholds Per-channel thresholds Recommended probing Single ended Decode configuration
Farming
Idle Time (2-wire SPI) Slave Select (3-wire or 4-wire SPI)
Clock Rising or Falling Edge Slave select Active High or Active Low MOSI Active High or Active Low MISO Active High or Active Low Word size 4-32 bits Bit order Most Significant (MS) First Least Significant (LS) First
Decode formats available Display modes
Hex, Binary Bus Bus only Bus and waveforms Simultaneous display of bus and logic waveforms Event table Decoded packet data in a tabular view SPI bus setup, showing configuration options for bus sources.
- Bus trigger and search options
Characteristic Description Trigger and/or Search On SS Active Start of Frame
MOSI
MISO
MOSI and MISO
Data: maximum of 128 bits (up to four 32-bit words or 32 four-bit words)
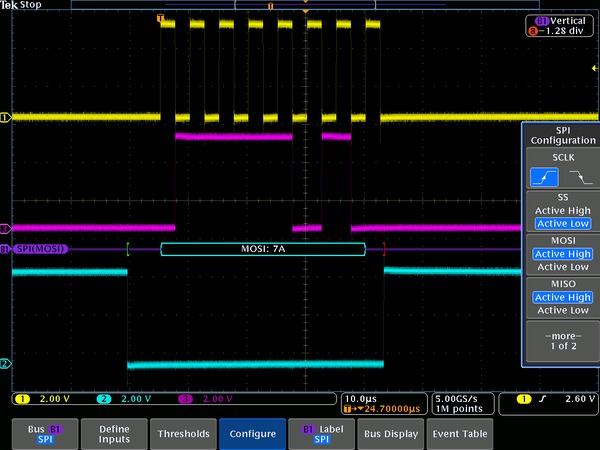
Triggering on a specific MOSI data value on the SPI bus.

- Bus decode
Characteristic Description Maximum Clock/Data Rate Up to 50 Mb/s (for automated decoding of bus) Decode display Start (green bracket) Data (cyan box)
Stop (red bracket)
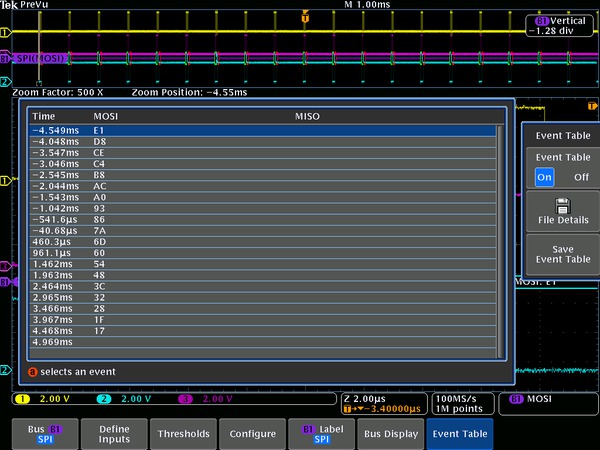
Event table for SPI bus with all captured packets time stamped and in a tabular view.
RS-232/UART/RS-422/RS-485 Characteristics
- Bus setup options
- RS-232/UART Sources (Transmit and Receive)
Analog channels 1-4
Digital channels D0-D15
- RS-422/RS-485 Sources (Transmit and Receive)
Analog channels 1-4
- Thresholds
- Per-channel thresholds
- Recommended probing
- RS-232/UART: Single ended
- RS-422/RS-485: Differential
- Polarity
- RS-422/RS-485
- Inverted (UART, RS-422/RS-485)
- Decode configuration
Paramater Description Bit rate Pre-defined list of rates
50 b/s - 2.8 Mb/s
Custom
50 b/s - 10 Mb/s
Data bits 7, 8, or 9 Parity None, Odd, or Even Packets On or Off End of packet 00h (NUL)
0Ah (LF)
0Dh (CR)
20h (SP)
FFh
- Decode formats available
- Hex, Binary, ASCII
- Display modes
Mode Description Bus Bus only Bus and waveforms Simultaneous display of bus and logic waveforms Event table Decoded packet data in a tabular view RS-232 bus setup, showing bit rate options for RS-232 bus.

- Bus trigger and search options
Characteristic Description Trigger and/or Search On Tx Start Bit Rx Start Bit
Tx End of Packet
Rx End of Packet
Tx Data (number of bytes 1-10)
Rx Data (number of bytes 1-10)
Tx Parity Error
Rx Parity Error
Triggering on a specific Tx data value on the RS-232 bus.

- Bus decode
Characteristic Description Maximum Clock/Data Rate Up to 10 Mb/s (for automated decoding of bus) Decode display Data (cyan box)
Errors (red box)- Parity
- Framing
Event table for RS-232 bus with all captured packets time stamped and in a tabular view.

CAN, CAN FD (ISO and non-ISO) Characteristics
- Bus setup options
Can bus setup, showing signal type options for CAN bus.
- Source for CAN_H, CAN_L, Rx, or Tx probing
Analog channels 1-4
Digital channels D0-D15
- Source for differential probing
- Analog channels 1-4
- Thresholds
- Per-channel thresholds
- Recommended probing
- TDP1500 differential probe
CAN_H, CAN_L, Rx, Tx: Single ended
Differential: Differential
- Bit Rate
Parameter Description Standard: pre-defined list of rates and Custom 10 Kb/s - 1 Mb/s FD: Pre-defined and custom 1 Mb/s - 10 Mb/s (7 M/bs MDO3K) - Sample Point
- Position at 15% to 95% within bit period or unit interval
- Decode formats available
- Hex, Binary
- Display modes
Parameter Description Bus Bus only Bus and waveforms Simultaneous display of bus and logic waveforms Event table Decoded packet data in a tabular view

- Bus trigger and search options
Characteristic Description Trigger and/or Search On FD BRS Bit, FD ESI Bit, Form Error and Any Error are available only when CAN FD is selected as BUS Start of Frame Type of Frame (Data, Remote, Error, Overload)
Identifier (Standard or Extended)
Data (number of bytes 1-8, trigger or search when =, ≠, <, >, ≤, ≥)
Identifier and Data
End of Frame
Missing Ack
Bit Stuffing Error
FD BRS Bit
FD ESI Bit
Form Error
Any Error
Triggering on a specific data value on the CAN bus.

- Bus decode
Characteristic Description Decode display Start (green bracket)
Address (yellow box)
DLC, CRC (purple box)
Missing Ack (red ! symbol)
Data (cyan box)
Stop (red bracket)
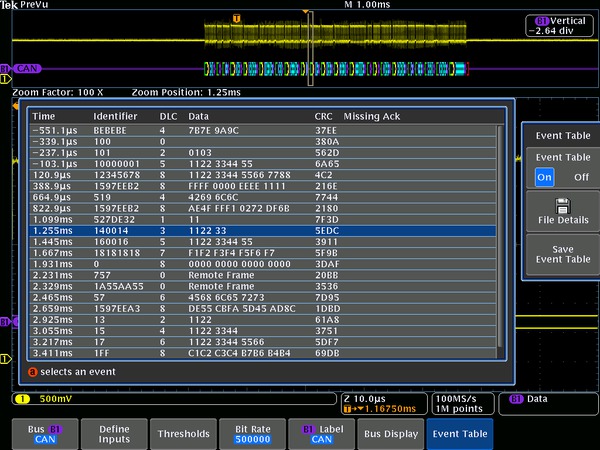
Bit stuffing errors (red box)Event table for CAN bus with all captured packets time stamped and in a tabular view.
LIN Characteristics
- Bus setup options
- Source
Analog channels 1-4
Digital channels D0-D15
- Thresholds
- Per-channel thresholds
- Recommended probing
- Single ended
- Decode Configuration
Parameter Description Polarity Normal or Inverted Bit rate Pre-defined list of rates 1.2 kb/s - 19.2 kb/s Custom 800 b/s - 100 kb/s LIN standard v1.x, v2.x, or Both Include parity bits with ID Yes or No - Decode formats available
- Mixed: ID and Parity are shown in Hex, Data and Checksum are shown in Binary
- Hex: all fields
- Binary: all fields
- Display modes
Mode Description Bus Bus only Bus and waveforms Simultaneous display of bus and logic waveforms Event Table Decoded packet data in a tabular view LIN bus setup, showing source configuration options for LIN bus.

- Bus trigger and search options
Characteristic Description Trigger and/or Search On Sync Identifier
Data (number of bytes 1-8; trigger or search when =, ≠, <, >, ≤, ≥, inside range, outside range)
Identifier and Data
Wakeup Frame
Sleep Frame
Error (Sync, ID Parity, Checksum)
Triggering on a Sync Error on the LIN bus

- Bus decode
Characteristic Description Maximum bit rate Up to 1 Mb/s, by LIN definition up to 20 kb/s (for automated decoding of bus) Decode display Start (green bracket) Sync, Break (purple box)
Identifier, Parity (yellow box)
Data (cyan box)
Checksum, Wakeup (purple box)
End of frame (red bracket)
Errors (red box)
- Sync
- Parity
- Checksum
- Header Time
- Response Time
- Frame Time
- Response and Frame Time
Event table for LIN bus with all captured packets time stamped and in a tabular view.

FlexRay Characteristics
- Bus setup options
- Source for single-ended probing
Analog channels 1-4
Digital channels D0-D15
- Source for differential probing
- Analog channels 1-4
- Thresholds
- High and low thresholds per-channel
- Recommended probing
- Single ended or differential
- Decode Configuration
Parameter Description Bit rate 2.5 Mb/s, 5 Mb/s, 10 Mb/s, or Custom (1 Mb/s - 100 Mb/s) Channel type A or B Polarity BDiff or BP, BM, Tx or Rx - Decode formats available
- Mixed: Identifier, Payload Length and Cycle Count are shown in Decimal, Data and CRCs are shown in Hex.
- Hex: all fields
- Binary: all fields
- Display modes
Mode Description Bus Bus only Bus and waveforms Simultaneous display of bus and logic waveforms Event Table Decoded packet data in a tabular view FlexRay bus setup, showing input options for FlexRay bus.

- Bus trigger and search options
Characteristic Description Trigger and/or Search On Start of Frame Indicator Bits (Normal, Null, Payload, Sync, Startup)
Identifier (trigger when =, ≠, <, >, ≤, ≥, inside range, outside range)
Cycle Count (trigger when =, ≠, <, >, ≤, ≥, inside range, outside range)
Header Fields (Indicator Bits, Identifier, Payload Length, Header CRC, and Cycle Count)
Data (number of bits 1-16; byte offset ‘don’t care’ – 253; trigger when =, ≠, <, >, ≤, ≥, inside range, outside range)
Identifier and Data
End of Frame (Static, Dynamic (DTS), All)
Error (Header CRC, Trailer CRC, Null Frame (static or dynamic), Sync Frame, Startup Frame)
- Bus decode
Characteristic Description Maximum bit rate Up to 10 Mb/s (for automated decoding of bus) Decode display TSS (purple box) Start (green bracket)
Frame ID (yellow box)
Payload Length (purple box)
Headers (purple box)
- Null
- Normal
- Sync
- Payload
- Startup
- Unknown
- Null Sync
- Payload Sync
- Null Startup
- Payload Startup
- CRC
- Cycle Count (yellow box)
- Data (cyan box)
- CRC, DTS, CID (purple box)
- Stop (red bracket)
- TSS
- Header CRC
- Trailer CRC
- Null Frame
- Sync Frame
- Startup Frame
- BSS
- FSS
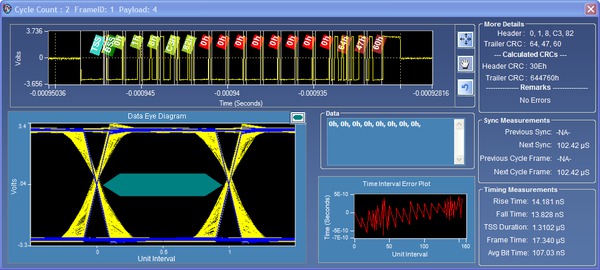
PC-based, eye-diagram analysis software builds an eye-diagram from the entire acquisition and plots it against TP1 mask called out by the FlexRay standard, available with MDO4000C instruments.
I²S/LJ/RJ/TDM Characteristics
- Bus setup options
- Sources (Clock, Word, Data)
Analog channels 1-4
Digital channels D0-D15
- Thresholds
- Per-channel thresholds
- Recommended probing
- Single ended
- Decode Configuration
Parameter Description Word size 4-32 bits Clock Rising or falling edge Word Select polarity Normal or inverted Data High 1 or 0 Bit order Most Significant (MS) First Least Significant (LS) First
- Decode formats available
- Signed Decimal, Hex, Binary
- Display modes
Mode Description Bus Bus only Bus and waveforms Simultaneous display of bus and logic waveforms Event Table Decoded packet data in a tabular view I2S bus setup, showing input configuration options for I2S bus.

- Bus trigger and search options
Characteristic Description Trigger and/or Search On Word Select Frame Sync
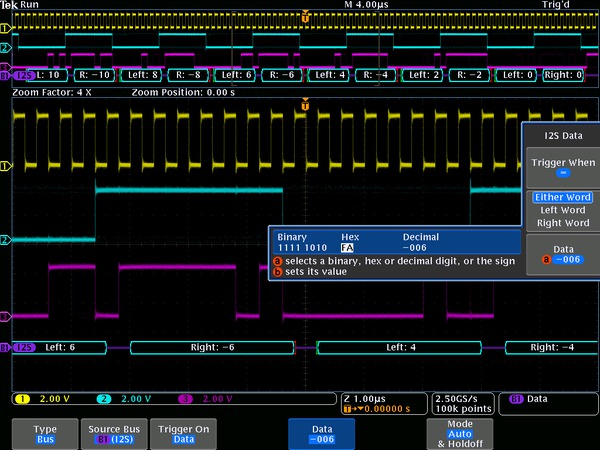
Data (select either word, left word, or right word; trigger or search when =, ≠,<,>, ≤, ≥, inside range, outside range)
Triggering on a specific data value on the I2S bus.
- Bus decode
Characteristic Description Maximum Clock/Data Rate Up to 12.5 Mb/s (for automated decoding of I2S/LJ/RJ bus) Up to 25 Mb/s (for automated decoding of TDM bus)
Decode display Start (green bracket) Data (cyan box)
Stop (red bracket
Start (green bracket) Data (cyan box) Stop (red bracket).

MIL-STD-1553 Characteristics
- Bus setup options
- Sources
Analog channels 1-4
Reference waveforms 1-4
Math waveform
- Thresholds
- High and low threshold per source
- Recommended probing
- Single ended or differential (only one single-ended signal required)
- Decode Configuration
Parameter Description Bit rate 1 Mb/s per the standard Response Time 2 μs – 100 μs
Polarity Normal or Inverted
- Decode formats available
- Mixed1: Hex (data), Decimal (addresses and count), Binary (bits)
- Mixed2: ASCII (data), Decimal (addresses and count), Binary (bits)
- Block Hex
- Hex and Binary
- Binary
- Display modes
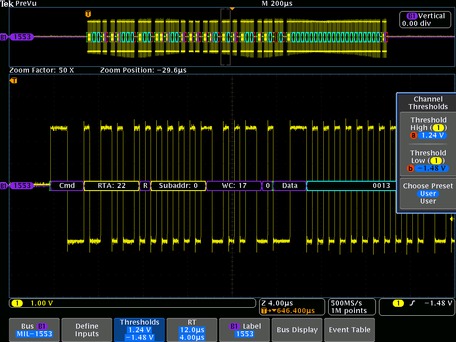
Mode Description Bus Bus only Bus and waveforms Simultaneous display of bus and logic waveforms Event Table Decoded packet data in a tabular view MIL-STD-1553 bus setup, showing threshold entry fields.
- Bus trigger and search options
Characteristic Description Trigger and/or Search On Sync Word Type Trigger selection of Command Word will trigger on Command and ambiguous Command/Status words. Trigger selection of Status Word will trigger on Status and ambiguous Command/Status words. (Command, Status, Data)
Command Word1 (set RT Address (=, ≠, <, >, ≤, ≥, inside range, outside range), T/R, Sub-address/Mode, Data Word Count/Mode Code, and Parity individually)
Status Word1 (set RT Address (=, ≠, <, >, ≤, ≥, inside range, outside range), Message Error, Instrumentation, Service Request Bit, Broadcast Command Received, Busy, Subsystem Flag, Dynamic Bus Control Acceptance (DBCA), Terminal Flag, and Parity individually)
Data Word (user-specified 16-bit data value)
Error (Sync, Parity, Manchester, Non-contiguous data)
Idle Time (minimum time selectable from 4 µs to 100 µs; maximum time selectable from 12 µs to 100 µs; trigger on < minimum, > maximum, inside range, outside range)
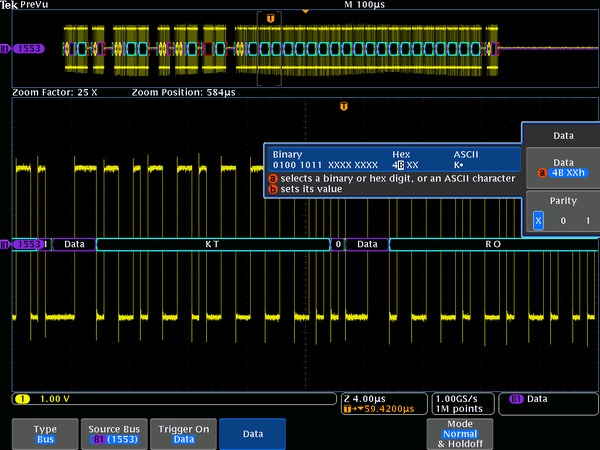
Triggering on a specific data value on the MIL-STD-1553 bus.
- Bus decode
Characteristic Description Maximum Clock/Data Rate Up to 1 Mb/s (for automated decoding of bus) Decode Display Start (green bracket) Sync Ambiguous Command and Status words will be labeled with C/S and a generic bit decode will be displayed. (purple box) with Word Type identified
Address (yellow box)
R/T (purple box)
Word Count (purple box)
Status Bits (purple box)
Data (cyan box)
Parity (purple box)
Stop (red bracket)
Errors (red box)
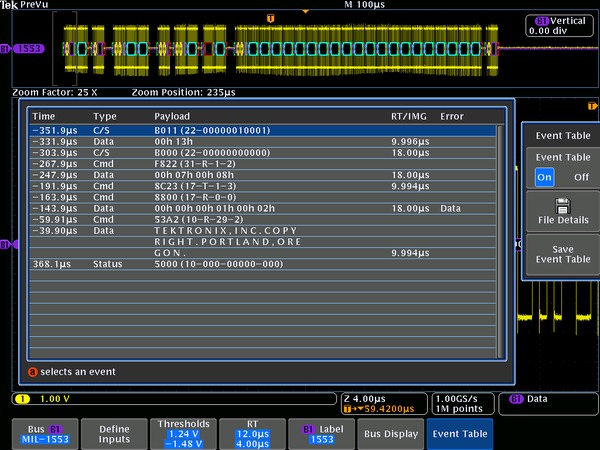
Event table for MIL-STD-1553 bus with all captured packets time stamped and in a tabular view.
ARINC 429 Characteristics
- Bus setup options
- Sources
Analog channels 1-4
Reference waveforms 1-4
Math waveform
- Thresholds
- High and low threshold per source
- Decode configuration
Parameter Description Bit rate 100 kb/s (High speed), 12.5-14.5 kb/s (Low speed) Polarity Normal or Inverted - Decode formats available
- Hex, Binary, Mixed (table listing; Label octal, Data hex)
- Display modes
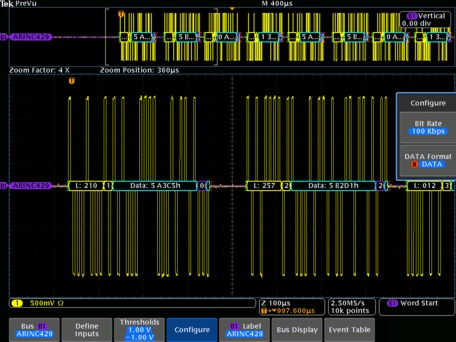
Mode Description Bus Bus only Bus and waveforms Simultaneous display of bus and logic waveforms Event Table Decoded packet data in a tabular view ARINC 429 bus setup, showing configuration entry of bit rate and data format.
- Bus trigger and search options
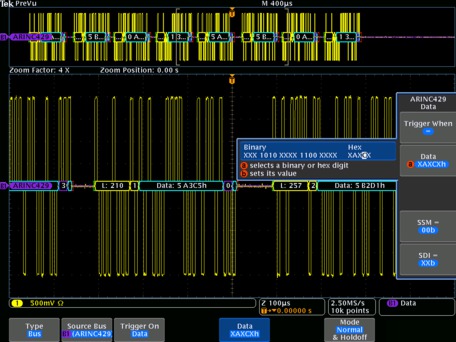
Characteristic Description Trigger and/or Search On Word Start, Word End, Label, Data Field (Data, SDI+Data, SDI+Data+SSM), Label+Data, Gap Error, Parity Error, Word Error, Any Error Data qualifiers include: (=, ≠, <, >, ≤, ≥, inside range, outside range) Triggering on a specific data value on the ARINC 429 bus. Characteristic Description Maximum Clock/Data Rate Up to 100 kb/s (1 Mbps custom) Decode Display Start (green bracket)
Label (yellow box)
SDI (yellow box)
Data (cyan box)
SSM (purple box)
Parity (cyan box)
Stop (red bracket)
Errors (red box)
Word end (red bracket)
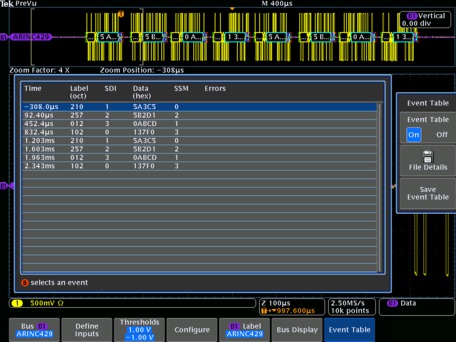
Event table for ARINC 429 bus with all captured packets time stamped and in a tabular view.
USB Characteristics
- Bus setup options
USB 2.0 Compatibility
Low-speed and Full-speed: All MDO4000C or MDO3000 Series models
High-speed: Models with 1 GHz analog channel bandwidth
- Sources
Single-ended: Analog channels 1-4
Digital channels D0-D15
Differential: Analog channels 1-4, Math channel, Reference channels 1-4
- Recommended probing
- Low-speed and Full-speed: Single-ended or differential
- High-speed: Differential
- Thresholds presents
- Low-speed and Full-speed: Single-ended (D+: 1.4 V; D-: -1.4 V), differential (High: 1.4 V; Low: -1.4 V)
- High-speed: Differential (High: 100 mV; Low: -100 mV)
- High-speed: Differential (High: 100 mV; Low: -100 mV)
- Decode formats available
- Mixed1: Frame and Address are shown in Decimal, Data shown in Hex
- Mixed2: Frame and Address are shown in Decimal, Data shown in ASCII
- Hex: all fields
- Binary: all fields
- Display modes
Mode Description Bus Bus only Bus and waveforms Simultaneous display of bus and logic waveforms Event Table Decoded packet data in a tabular view Triggering on a specific PID on a USB FS bus.

- Bus decode
Characteristic Description USB 2.0 Data Rates Low-speed: 1.5 Mb/s Full-speed: 12 Mb/s
High-speed: 480 Mb/s
Decode Display Start (green bracket) PID (yellow box)
Data (cyan box)
CRC (purple box)
Stop (red bracket)
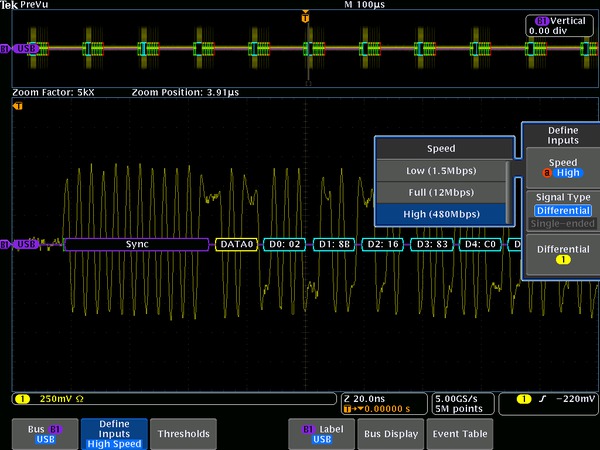
High-speed USB decoded display, automatically displaying bus content.
- Bus trigger and search options
Characteristic Description Trigger and/or Search On Low-speed: Trigger/Search on Sync, Reset, Suspend, Resume, End of Packet, Token (Address) Packet, Data Packet, Handshake Packet, Special Packet, Error. Token Packet – Any token type, SOF, OUT, IN, SETUP; Address can be further specified to trigger on ≤, <, =, >, ≥, ≠ a particular value, or inside or outside of a range. Frame number can be specified for SOF token using Binary, Hex, Unsigned Decimal, and Don't Care digits.
Data Packet – Any data type, DATA0, DATA1; Data can be further specified to trigger on ≤, <, =, >, ≥, ≠ a particular data value, or inside or outside of a range.
Handshake Packet – Any handshake type, ACK, NAK, STALL.
Special Packet – Any special type, Reserved.
Error – PID Check, CRC5, CRC16, Bit Stuffing.
Full-speed: Trigger/Search on Sync, Reset, Suspend, Resume, End of Packet, Token (Address) Packet, Data Packet, Handshake Packet, Special Packet, Error.
Token Packet – Any token type, SOF, OUT, IN, SETUP; Address can be further specified to trigger on ≤, <, =, >, ≥, ≠ a particular value, or inside or outside of a range. Frame number can be specified for SOF token using Binary, Hex, Unsigned Decimal, and Don't Care digits.
Data Packet – Any data type, DATA0, DATA1; Data can be further specified to trigger on ≤, <, =, >, ≥, ≠ a particular data value, or inside or outside of a range.
Handshake Packet – Any handshake type, ACK, NAK, STALL.
Special Packet – Any special type, PRE, Reserved.
Error – PID Check, CRC5, CRC16, Bit Stuffing.
High-speed: Trigger/Search on Sync, Reset, Suspend, Resume, End of Packet, Token (Address) Packet, Data Packet, Handshake Packet, Special Packet, Error. Token Packet – Any token type, SOF, OUT, IN, SETUP; Address can be further specified to trigger on ≤, <, =, >, ≥, ≠ a particular value, or inside or outside of a range. Frame number can be specified for SOF token using Binary, Hex, Unsigned Decimal, and Don't Care digits.
Data Packet – Any data type, DATA0, DATA1, DATA2, MDATA; Data can be further specified to trigger on ≤, <, =, >, ≥, ≠ a particular data value, or inside or outside of a range.
Handshake Packet – Any handshake type, ACK, NAK, STALL, NYET.
Special Packet – Any special type, ERR, SPLIT, PING, Reserved. SPLIT packet components that can be specified include:
Hub Address
Start/Complete – Don't Care, Start (SSPLIT), Complete
(CSPLIT)
Port Address
Start and End bits – Don't Care, Control/Bulk/Interrupt
(Full-speed Device, Low-speed Device),
Isochronous (Data is Middle, Data is End, Data is Start,
Data is All)
Endpoint Type – Don't Care, Control, Isochronous, Bulk,
Interrupt
Error – PID Check, CRC5, CRC16
Ethernet Characteristics
- Bus setup options
Ethernet compatibility 10BASE-T, 100BASE-TX On MDO4000C Series only
- Sources
Single-ended: Analog channels 1-4
Differential: Analog channels 1-4, Math channel, Reference channels 1-4
- Recommended probing
- 10BASE-T: Single-ended or differential
- 100BASE-TX: Differential
- Thresholds presents
- 10BASE-T: Single-ended (D+: 1.25 V; D-: 1.25 V); Differential (High: 1.25 V; Low: -1.25 V)
- 100BASE-TX: Single-ended (D+: 500 mV; D-: 500 mV); Differential (High: 500 mV; Low: -500 mV)
- Decode formats available
- Mixed1: Data is shown in Hex, all other fields are shown in either Decimal or Hex
- Mixed2: Data is shown in ASCII, all other fields are shown in either Decimal or Hex
- Hex: all fields
- Binary: all fields
- Display modes
Mode Description Bus Bus only Bus and waveforms Simultaneous display of bus and logic waveforms Event Table Decoded packet data in a tabular view DPO4ENET 100BASE-TX decoded Event Table showing all packet information.

- Bus decode
Characteristic Description Ethernet Data Rates 10BASE-T: 10 Mb/s 100BASE-TX: 100 Mb/s
Decode Display Start (green bracket) MAC Address (yellow box)
Data (cyan box)
IPv4 Header (white box)
TCP Header (brown box)
CRC (purple box)
Stop (red bracket)
Error (red box)
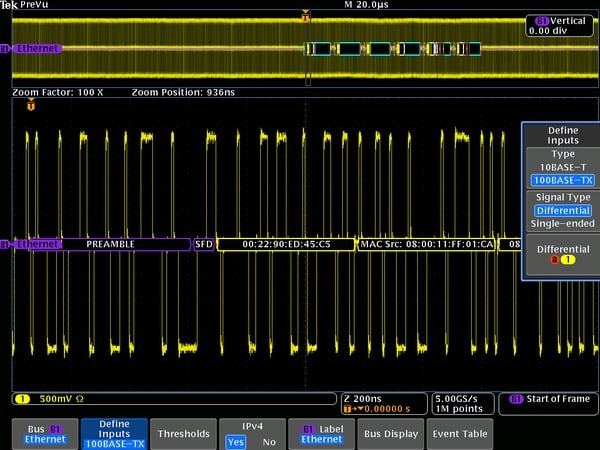
Internet Protocol Support IPv4 Transport Layer Protocol Support TCP Color-coded DPO4ENET display of 100BASE-TX.
- Display modes
Mode Description Bus Bus only Bus and waveforms Simultaneous display of bus and logic waveforms Event table Decoded packet data in a tabular view DPO4ENET 100BASE-TX decoded Event Table showing all packet information.
- Bus trigger options
Option Description Trigger and/or Search On 10BASE-T: Start Frame Delimiter
MAC Addresses: Trigger on Source and Destination 48-bit address values
MAC Q-tag Control Information: Trigger on Q-tag 32-bit value
MAC Length/Type: Trigger on ≤, <, =, >, ≥, ≠ a particular 16-bit value, or inside or outside of a range
MAC Client Data: Trigger on ≤, <, =, >, ≥, ≠ a particular 16-bit value, or inside or outside of a range. Selectable number of bytes to trigger on from 1-16. Byte offset options of Don't Care, 0-1499
IP Header: Trigger on IP header 8-bit value, Source Address, Destination Address
TCP Header: Trigger on Destination Port, Source Port, Sequence Number, and Ack Number
TCP/IPv4 Client Data: Trigger on ≤, <, =, >, ≥, ≠ a particular data value, or inside or outside of a range. Selectable number of bytes to trigger on from 1-16. Byte offset options of Don't Care, 0-1499
End of Packet
FCS (CRC) Error
100BASE-TX: Start Frame Delimiter
MAC Addresses: Trigger on Source and Destination 48-bit address values
MAC Q-tag Control Information: Trigger on Q-tag 32-bit value
MAC Length/Type: Trigger on ≤, <, =, >, ≥, ≠ a particular 16-bit value, or inside or outside of a range
MAC Client Data: Trigger on ≤, <, =, >, ≥, ≠ a particular data value, or inside or outside of a range. Selectable number of bytes to trigger on from 1-16. Byte offset options of Don't Care, 0-1499
IP Header: Trigger on IP header 8-bit value, Source Address, Destination Address
TCP Header: Trigger on Destination Port, Source Port, Sequence Number, and Ack Number
TCP/IPv4 Client Data: Trigger on ≤, <, =, >, ≥, ≠ a particular data value, or inside or outside of a range. Selectable number of bytes to trigger on from 1-16. Byte offset options of Don't Care, 0-1499
End of Packet
FCS (CRC) Error
Idle
DPO4ENET triggering on a specific 10BASE-T MAC source address.

Ordering information
Current/discontinued products
| Serial Bus | MDO4000C Series Module | MDO3000 Series Module | MSO/DPO2000B Series Module |
|---|---|---|---|
| I2C, SPI SPI support is limited to 2-wire SPI only on models that have only 2 analog channels and no digital channels. | DPO4EMBD | MDO3EMBD | DPO2EMBD |
| RS-232 / 422 / 485 / UART | DPO4COMP | MDO3COMP | DPO2COMP |
| CAN/CAN FD, LIN | DPO4AUTO | MDO3AUTO | DPO2AUTOCAN FD is not available on MSO/DPO2000 Series. |
| FlexRay | -- | MDO3FLEX | -- |
| CAN/CAN FD, LIN, FlexRay | DPO4AUTOMAX DPO4AUTOMAX includes a PC-based software package for FlexRay eye diagram analysis. | -- | -- |
| I2S/LJ/RJ/TDM Not available on models that have only 2 analog channels and no digital channels. | DPO4AUDIO | MDO3AUDIO | -- |
| MIL-STD-1553, ARINC 429 | DPO4AERO | MDO3AERO | -- |
| USB USB LS/FS triggering and decode available on all models in all indicated product families. HS decode available only on 1 GHz models. HS triggering only available on 1 GHz models in MSO/DPO4000B and MDO4000/B/C Series. | DPO4USB | MDO3USB | -- |
| Ethernet 100BASE-TX requires ≥ 350 MHz model. | DPO4ENET | -- | -- |
| Serial Bus | MSO/DPO4000B and MDO4000/B Series Module | MSO/DPO4000 Series Module | MSO/DPO3000 Series Module | MSO/DPO2000 Series Module |
|---|---|---|---|---|
| I2C, SPI1 | DPO4EMBD | DPO4EMBD | DPO3EMBD | DPO2EMBD |
| RS-232 / 422 / 485 / UART | DPO4COMP | DPO4COMP | DPO3COMP | DPO2COMP |
| CAN, LIN | DPO4AUTO | DPO4AUTO | DPO3AUTO | DPO2AUTO |
| FlexRay | -- | -- | DPO3FLEX | -- |
| CAN, LIN, FlexRay | DPO4AUTOMAX3 | DPO4AUTOMAX3 | -- | -- |
| I2S/LJ/RJ/TDM4 | DPO4AUDIO | DPO4AUDIO | DPO3AUDIO | -- |
| MIL-STD-1553 | DPO4AERO | DPO4AERO | DPO3AERO | -- |
| USB 5 | DPO4USB | DPO4USB | -- | -- |
| Ethernet 6 | DPO4ENET | -- | -- | -- |
Recommended probes
Please refer to www.tek.com/probes for further information on the recommended models of probes and any necessary probe adapters.
Tektronix is registered to ISO 9001 and ISO 14001 by SRI Quality System Registrar.

