Свяжитесь с нами
Живой чат с представителями Tektronix. С 9:00 до 17:00 CET
Позвоните нам
С 9:00 до 17:00 CET
Загрузить
Загрузить руководства, технические описания, программное обеспечение и т. д.:
Обратная связь
3 Series Mixed Domain Oscilloscope Quick Start Manual
This manual describes installing and setting up the 3 Series Mixed Domain Oscilloscope and introduces the user interface and basic oscilloscope operations.
Это руководство относится к следующему:
MDO32, MDO34
- Тип руководства: User (Предварительные установки > Пользователь)
- Номер по каталогу: 077179701
- Дата выпуска:
By downloading, you agree to the terms and conditions of the Manuals Download Agreement.
Manuals Download Agreement
ATTENTION: please read the following terms and conditions carefully before downloading any documents from this website. By downloading manuals from Tektronix' website, you agree to the following terms and conditions:
Manuals for Products That Are Currently Supported:
Tektronix hereby grants permission and license to owners of Tektronix instruments to download and reproduce the manuals on this website for their own internal or personal use. Manuals for currently supported products may not be reproduced for distribution to others unless specifically authorized in writing by Tektronix, Inc.
A Tektronix manual may have been revised to reflect changes made to the product during its manufacturing life. Thus, different versions of a manual may exist for any given product. Care should be taken to ensure that one obtains the proper manual version for a specific product serial number.
Manuals for Products That Are No Longer Supported:
Tektronix cannot provide manuals for measurement products that are no longer eligible for long term support. Tektronix hereby grants permission and license for others to reproduce and distribute copies of any Tektronix measurement product manual, including user manuals, operator's manuals, service manuals, and the like, that (a) have a Tektronix Part Number and (b) are for a measurement product that is no longer supported by Tektronix.
A Tektronix manual may be revised to reflect changes made to the product during its manufacturing life. Thus, different versions of a manual may exist for any given product. Care should be taken to ensure that one obtains the proper manual version for a specific product serial number.
This permission and license does not apply to any manual or other publication that is still available from Tektronix, or to any manual or other publication for a video production product or a color printer product.
Disclaimer:
Tektronix does not warrant the accuracy or completeness of the information, text, graphics, schematics, parts lists, or other material contained within any measurement product manual or other publication that is not supplied by Tektronix or that is produced or distributed in accordance with the permission and license set forth above.
Tektronix may make changes to the content of this website or to its products at any time without notice.
Limitation of Liability:
TEKTRONIX SHALL NOT BE LIABLE FOR ANY DAMAGES WHATSOEVER (INCLUDING, WITHOUT LIMITATION, ANY CONSEQUENTIAL OR INCIDENTAL DAMAGES, DAMAGES FOR LOSS OF PROFITS, BUSINESS INTERRUPTION, OR FOR INFRINGEMENT OF INTELLECTUAL PROPERTY) ARISING OUT OF THE USE OF ANY MEASUREMENT PRODUCT MANUAL OR OTHER PUBLICATION PRODUCED OR DISTRIBUTED IN ACCORDANCE WITH THE PERMISSION AND LICENSE SET FORTH ABOVE.
Read Online
GETTING STARTED
- Key features
- Documentation
- Check shipped accessories
- Safely rotate the handle
- Operating requirements
- Input signal requirements
- Lock the oscilloscope
- Powering the instrument
- Check that the oscilloscope passes power-on self tests
- Connecting probes
- Rackmount information
- Remote access from a Web browser
- Connect the oscilloscope to a PC using a USB cable
- Cleaning
Important safety information
This manual contains information and warnings that must be followed by the user for safe operation and to keep the product in a safe condition.
To safely perform service on this product, see the Service safety summary that follows the General safety summary.
General safety summary
Use the product only as specified. Review the following safety precautions to avoid injury and prevent damage to this product or any products connected to it. Carefully read all instructions. Retain these instructions for future reference.
This product shall be used in accordance with local and national codes.
For correct and safe operation of the product, it is essential that you follow generally accepted safety procedures in addition to the safety precautions specified in this manual.
The product is designed to be used by trained personnel only.
Only qualified personnel who are aware of the hazards involved should remove the cover for repair, maintenance, or adjustment.
Before use, always check the product with a known source to be sure it is operating correctly.
This product is not intended for detection of hazardous voltages.
Use personal protective equipment to prevent shock and arc blast injury where hazardous live conductors are exposed.
While using this product, you may need to access other parts of a larger system. Read the safety sections of the other component manuals for warnings and cautions related to operating the system.
When incorporating this equipment into a system, the safety of that system is the responsibility of the assembler of the system.
To avoid fire or personal injury
Use proper power cord.
Use only the power cord specified for this product and certified for the country of use. Do not use the provided power cord for other products.
Ground the product.
This product is grounded through the grounding conductor of the power cord. To avoid electric shock, the grounding conductor must be connected to earth ground. Before making connections to the input or output terminals of the product, ensure that the product is properly grounded. Do not disable the power cord grounding connection.
Power disconnect.
The power cord disconnects the product from the power source. See instructions for the location. Do not position the equipment so that it is difficult to operate the power cord; it must remain accessible to the user at all times to allow for quick disconnection if needed.
Connect and disconnect properly.
Do not connect or disconnect probes or test leads while they are connected to a voltage source.
Use only insulated voltage probes, test leads, and adapters supplied with the product, or indicated by Tektronix to be suitable for the product.
Observe all terminal ratings.
To avoid fire or shock hazard, observe all rating and markings on the product. Consult the product manual for further ratings information before making connections to the product.
Do not exceed the Measurement Category (CAT) rating and voltage or current rating of the lowest rated individual component of a product, probe, or accessory. Use caution when using 1:1 test leads because the probe tip voltage is directly transmitted to the product.
Do not apply a potential to any terminal, including the common terminal, that exceeds the maximum rating of that terminal.
Do not float the common terminal above the rated voltage for that terminal.
Do not operate without covers
Do not operate this product with covers or panels removed, or with the case open. Hazardous voltage exposure is possible.
Avoid exposed circuitry
Do not touch exposed connections and components when power is present.
Do not operate with suspected failures.
If you suspect that there is damage to this product, have it inspected by qualified service personnel.
Disable the product if it is damaged. Do not use the product if it is damaged or operates incorrectly. If in doubt about safety of the product, turn it off and disconnect the power cord. Clearly mark the product to prevent its further operation.
Before use, inspect voltage probes, test leads, and accessories for mechanical damage and replace when damaged. Do not use probes or test leads if they are damaged, if there is exposed metal, or if a wear indicator shows.
Examine the exterior of the product before you use it. Look for cracks or missing pieces.
Use only specified replacement parts.
Do not operate in wet/damp conditions
Be aware that condensation may occur if a unit is moved from a cold to a warm environment.
Do not operate in an explosive atmosphere
Keep product surfaces clean and dry
Remove the input signals before you clean the product.
Provide proper ventilation.
Refer to the installation instructions in the manual for details on installing the product so it has proper ventilation.
Slots and openings are provided for ventilation and should never be covered or otherwise obstructed. Do not push objects into any of the openings.
Provide a safe working environment
Always place the product in a location convenient for viewing the display and indicators.
Avoid improper or prolonged use of keyboards, pointers, and button pads. Improper or prolonged keyboard or pointer use may result in serious injury.
Be sure your work area meets applicable ergonomic standards. Consult with an ergonomics professional to avoid stress injuries.
Use care when lifting and carrying the product. This product is provided with a handle or handles for lifting and carrying.
Use only the Tektronix rackmount hardware specified for this product.
Probes and test leads
Before connecting probes or test leads, connect the power cord from the power connector to a properly grounded power outlet.
Keep fingers behind the protective barrier, protective finger guard, or tactile indicator on the probes. Remove all probes, test leads and accessories that are not in use.
Use only correct Measurement Category (CAT), voltage, temperature, altitude, and amperage rated probes, test leads, and adapters for any measurement.
Beware of high voltages
Understand the voltage ratings for the probe you are using and do not exceed those ratings. Two ratings are important to know and understand:
- The maximum measurement voltage from the probe tip to the probe reference lead.
- The maximum floating voltage from the probe reference lead to earth ground.
These two voltage ratings depend on the probe and your application. Refer to the Specifications section of the manual for more information.
 | WARNING:To prevent electrical shock, do not exceed the maximum measurement or maximum floating voltage for the oscilloscope input BNC connector, probe tip, or probe reference lead. |
Connect and disconnect properly.
Connect the probe output to the measurement product before connecting the probe to the circuit under test. Connect the probe reference lead to the circuit under test before connecting the probe input. Disconnect the probe input and the probe reference lead from the circuit under test before disconnecting the probe from the measurement product.
De-energize the circuit under test before connecting or disconnecting the current probe.
Connect the probe reference lead to earth ground only.
Do not connect a current probe to any wire that carries voltages or frequencies above the current probe voltage rating.
Inspect the probe and accessories
Before each use, inspect probe and accessories for damage (cuts, tears, or defects in the probe body, accessories, or cable jacket). Do not use if damaged.
Ground-referenced oscilloscope use
Do not float the reference lead of this probe when using with ground-referenced oscilloscopes. The reference lead must be connected to earth potential (0 V).
Service safety summary
The Service safety summary section contains additional information required to safely perform service on the product. Only qualified personnel should perform service procedures. Read this Service safety summary and the General safety summary before performing any service procedures.
To avoid electric shock
Do not touch exposed connections.
Do not service alone
Do not perform internal service or adjustments of this product unless another person capable of rendering first aid and resuscitation is present.
Disconnect power
To avoid electric shock, switch off the product power and disconnect the power cord from the mains power before removing any covers or panels, or opening the case for servicing.
Use care when servicing with power on
Dangerous voltages or currents may exist in this product. Disconnect power, remove battery (if applicable), and disconnect test leads before removing protective panels, soldering, or replacing components.
Verify safety after repair
Always recheck ground continuity and mains dielectric strength after performing a repair.
Terms in this manual
These terms may appear in this manual:
| WARNING:Warning statements identify conditions or practices that could result in injury or loss of life. |
| CAUTION:Caution statements identify conditions or practices that could result in damage to this product or other property. |
Terms on the product
These terms may appear on the product:
- DANGER indicates an injury hazard immediately accessible as you read the marking.
- WARNING indicates an injury hazard not immediately accessible as you read the marking.
- CAUTION indicates a hazard to property including the product.
Symbols on the product
 | When this symbol is marked on the product, be sure to consult the manual to find out the nature of the potential hazards and any actions which have to be taken to avoid them. (This symbol may also be used to refer the user to ratings in the manual.) |
The following symbols(s) may appear on the product.
 |  |  |  |  |
Compliance information
This section lists the safety and environmental standards with which the instrument complies. This product is intended for use by professionals and trained personnel only; it is not designed for use in households or by children.
Questions about compliance information may be directed to the following address:
Tektronix, Inc.
PO Box 500, MS 19-045
Beaverton, OR 97077, USA
Safety compliance
This section lists other safety compliance information.
Equipment type
Test and measuring equipment.
Safety class
Class 1 – grounded product.
Pollution degree description
A measure of the contaminants that could occur in the environment around and within a product. Typically the internal environment inside a product is considered to be the same as the external. Products should be used only in the environment for which they are rated.
- Pollution Degree 1. No pollution or only dry, nonconductive pollution occurs. Products in this category are generally encapsulated, hermetically sealed, or located in clean rooms.
- Pollution Degree 2. Normally only dry, nonconductive pollution occurs. Occasionally a temporary conductivity that is caused by condensation must be expected. This location is a typical office/home environment. Temporary condensation occurs only when the product is out of service.
- Pollution Degree 3. Conductive pollution, or dry, nonconductive pollution that becomes conductive due to condensation. These are sheltered locations where neither temperature nor humidity is controlled. The area is protected from direct sunshine, rain, or direct wind.
- Pollution Degree 4. Pollution that generates persistent conductivity through conductive dust, rain, or snow. Typical outdoor locations.
Pollution degree rating
Pollution Degree 2 (as defined in IEC 61010-1). Note: Rated for indoor, dry location use only.
IP rating
IP20 (as defined in IEC 60529).
Measurement and overvoltage category descriptions
Measurement terminals on this product may be rated for measuring mains voltages from one or more of the following categories (see specific ratings marked on the product and in the manual).
- Overvoltage Category I. For equipment intended to be connected to a mains supply in which means have been taken to substantially and reliably reduce transient overvoltages to a level where they cannot cause a hazard.
- Measurement Category II. For measurements performed on circuits directly connected to the low-voltage installation.
- Measurement Category III. For measurements performed in the building installation.
- Measurement Category IV. For measurements performed at the source of low-voltage installation.
| Note:Only mains power supply circuits have an overvoltage category rating. Only
measurement circuits have a measurement category rating. Other circuits within the
product do not have either rating. |
Mains overvoltage category rating
Overvoltage Category II (as defined in IEC 61010-1)
Environmental compliance
This section provides information about the environmental impact of the product.
Product end-of-life handling
Observe the following guidelines when recycling an instrument or component:
- Equipment recycling
- Production of this equipment required the extraction and use of natural resources. The equipment may contain substances that could be harmful to the environment or human health if improperly handled at the product’s end of life. To avoid release of such substances into the environment and to reduce the use of natural resources, we encourage you to recycle this product in an appropriate system that will ensure that most of the materials are reused or recycled appropriately.
 |
This symbol indicates that this product complies with the applicable European Union requirements according to Directives 2012/19/EU and 2006/66/EC on waste electrical and electronic equipment (WEEE) and batteries. For information about recycling options, check the Tektronix Web site (http://www.tek.com/productrecycling). |
- Battery recycling
- This product contains a small installed lithium metal button cell. Please properly dispose of or recycle the cell at its end of life according to local government regulations.
- Perchlorate materials
- This product contains one or more type CR lithium batteries. According to the state of California, CR lithium batteries are classified as perchlorate materials and require special handling. See www.dtsc.ca.gov/hazardouswaste/perchlorate for additional information.
Transporting batteries
The small lithium primary button cell contained in this equipment does not exceed 1 gram of lithium metal content per cell.
The cell type has been shown by the manufacturer to comply with the applicable requirements of the UN Manual of Tests and Criteria Part III, Sub-section 38.3. Consult your carrier to determine which lithium battery transportation requirements are applicable to your configuration, including to its re-packaging and re-labeling, prior to reshipment of the product by any mode of transport.
Getting started
This manual provides product safety and compliance information, describes how to connect and power on the oscilloscope, and introduces the basic instrument features, controls, and operations. See the product Help file for more detailed information. Go to tek.com/warranty-status-search for warranty information.
Key features
Welcome to the 3 Series MDO. The 3 Series MDO Oscilloscopes (MDO32 and MDO34) are 2- and 4-channel oscilloscopes, enabling you to efficiently and cost-effectively perform mixed domain debugging.
- A dedicated RF input channel for frequency domain measurements
- 1 GHz spectrum analyzer standard, 3 GHz optional
- Bandwidths from 100 MHz to 1 GHz
- 2- and 4-channels for time domain measurements
- Sixteen-channel digital input option
- Large 11.6” HD (1920 x 1080 pixel) capacitive touchscreen display
- User interface optimized for touchscreen use
- Sample rates of 2.5 GS/s on all analog channels (5 GS/s on 1 or 2 channels for the MDO34 or MDO32 with the 1 GHz option)
- 10 M points record length on all channels
- Maximum waveform capture rate: 280,000 waveforms/second, with FastAcq: >50,000 waveforms/second with normal operation
- Advanced triggering and analysis: I2C, SPI, USB 2.0, CAN, CAN FD, LIN, FlexRay, SENT, RS-232, RS-422, RS-485, UART, I2S, Left Justified (LJ), Right Justified (RJ), TDM, MIL-STD-1553, ARINC429 (with the appropriate option), and Parallel
- Power analysis (optional)
- Arbitrary function generator and 16 digital channels (optional)
- Digital voltmeter and trigger frequency counter free with product registration
Documentation
Review the following user documents before installing and using your instrument. These documents provide important operating information.
Product documentation
The following table lists the primary product specific documentation available for your product. These and other user documents are available for download from tek.com. Other information, such as demonstration guides, technical briefs, and application notes, can also be found at tek.com.
| Document | Content |
|---|---|
| Help | In-depth operating information for the product. Available from the Help button in the product UI and as a PDF on tek.com. |
| Quick Start User Manual | Introduction to product hardware and software, installation instructions, turn on, and basic operating information. |
| Specifications and Performance Verification Technical Reference | Instrument specifications and performance verification instructions for testing instrument performance. |
| Programmer Manual | Commands for remotely controlling the instrument. |
| Declassification and Security Instructions | Information about the location of memory in the instrument. Instructions for declassifying and sanitizing the instrument. |
| Service Manual | Replaceable parts list, theory of operations, and repair and replace procedures for servicing an instrument. |
| Upgrade Instructions | Product upgrade installation information. |
| Rackmount Kit Instructions | Installation information for assembling and mounting an instrument using a specific rackmount. |
How to find your product documentation
- Go to tek.com.
- Click Download in the green sidebar on the right side of the screen.
- Select Manuals as the Download Type, enter your product model, and click Search.
- View and download your product manuals. You can also click the Product Support Center and Learning Center links on the page for more documentation.
Check shipped accessories
Make sure that you received everything you ordered. If anything is missing, contact Tektronix Customer Support. In North America, call 1-800-833-9200. Worldwide, visit www.tek.com to find contacts in your area.
Check the packing list that came with your instrument to verify that you have received all standard accessories and ordered items. If you purchased factory options, tap Help > About to confirm that the option(s) are listed in the Installed Options table.
Standard accessories
| Item | Quantity | Tektronix part number | |
|---|---|---|---|
| Passive Voltage Probe, depends on instrument bandwidth | 1 GHz bandwidth | One per analog channel | TPP1000 |
| 350 MHz and 500 MHz | TPP0500B | ||
| 100 MHz and 200 MHz bandwidth | TPP0250 | ||
| Accessory bag | 1 | 016-2144-xx | |
| Power cord | 1 | Depends on region | |
| Calibration certificate | 1 | N/A | |
| OpenChoice® Desktop Software. Available for download from www.tek.com/software/downloads | |||
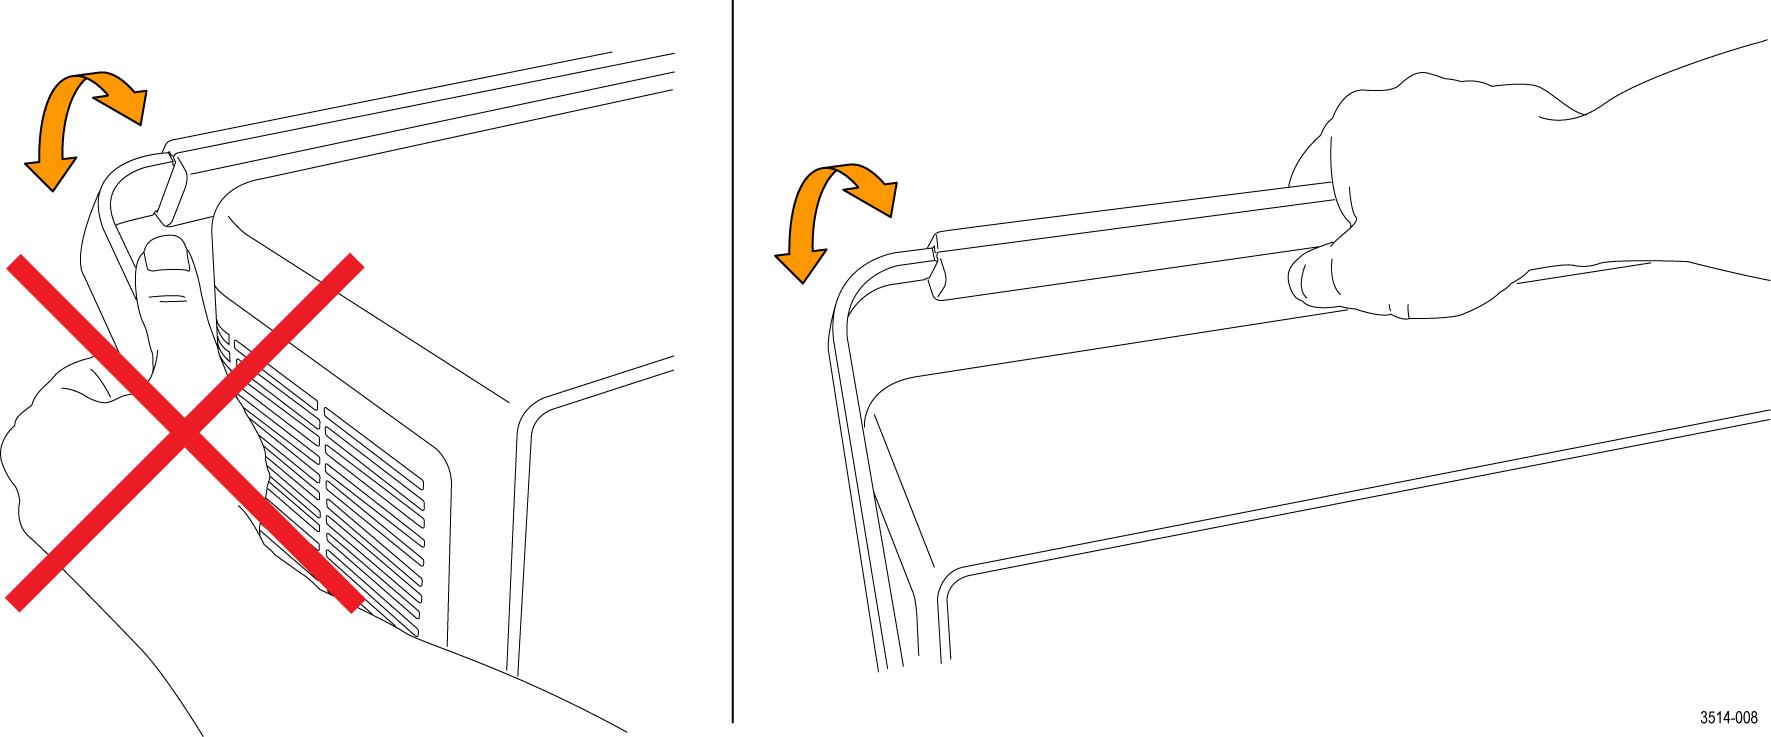
Safely rotate the handle
Use the correct process to eliminate the chance of pinching your thumb or rear-panel-connected cables while rotating the handle.
| WARNING:Hold the top of the handle to rotate the handle on the instrument. Do not hold the handle from the sides and rotate, as this can pinch the base of your thumb between the handle and the case. |
| CAUTION:If you have routed any cables between the handle and the case, be careful when rotating the handle so that you do not pinch the cables. |
Operating requirements
Use the oscilloscope within the required operating temperature, power, altitude, and signal input voltage ranges to provide the most accurate measurements and safe instrument operation.
Environment requirements
| Characteristic | Description |
|---|---|
| Operating temperature | -10 °C to +55 °C (+14 °F to +131 °F) For proper cooling, keep the sides and rear of the instrument clear of obstructions for 2 inches (51 mm). |
| Operating humidity | 5% to 90% relative humidity (% RH) up to +40 °C (+104 °F), Noncondensing. 5% to 60% RH above +40 °C up to +55 °C (+104 °F to +131 °F), Noncondensing. |
| Operating altitude | Up to 3000 meters (9842 feet) |
Power requirements
| Characteristic | Description |
|---|---|
| Power source voltage | 100 V - 240 VAC RMS, ±10%, single phase |
| Power source frequency | 50/60 Hz, 100-240 V |
| Power consumption | 130 W maximum |
Input signal requirements
Keep the input signals within allowed limits to ensure the most accurate measurements and prevent damage to the analog and digital probes or instrument. Make sure that input signals are within the following requirements.
| Input | Description |
|---|---|
| Analog input channels, 1 M Ω setting, maximum input voltage at BNC | 300 VRMS
Measurement Category II De-rate at 20 dB/decade between 4.5 MHz and 45 MHz, De-rate 14 db between 45 MHz and 450 MHz. Above 450 MHz, 5 VRMS. |
| Analog input channels, 50 Ω setting, maximum input voltage at BNC | 5 VRMS with a peak at ±20 V. (DF ≤ 6.25%). |
| RF input maximum input voltage | Average Continuous Power: +20 dBm (0.1 W) DC maximum before damage: ±40 VDC Max no damage +33 dBm (2 W) CW Peak Pulse Power: +45 dBm (32 W) Peak Pulse Power defined as <10 μs pulse width, <1% duty cycle, and reference level of ≥ +10 dBm |
| Input | Description |
|---|---|
| Threshold Accuracy | ±(100 mV + 3% of threshold setting after calibration) |
| Threshold Range | +25 V to –15 V |
| Maximum nondestructive input signal to probe | +30 V to -20 V |
| Minimum signal swing | 500 mVpeak-to-peak |
| Input resistance | 101 kΩ |
| Input capacitance | 8.0 pF typical |
| Pollution Degree | 2, indoor use only |
| Humidity | 5% to 95% relative humidity |
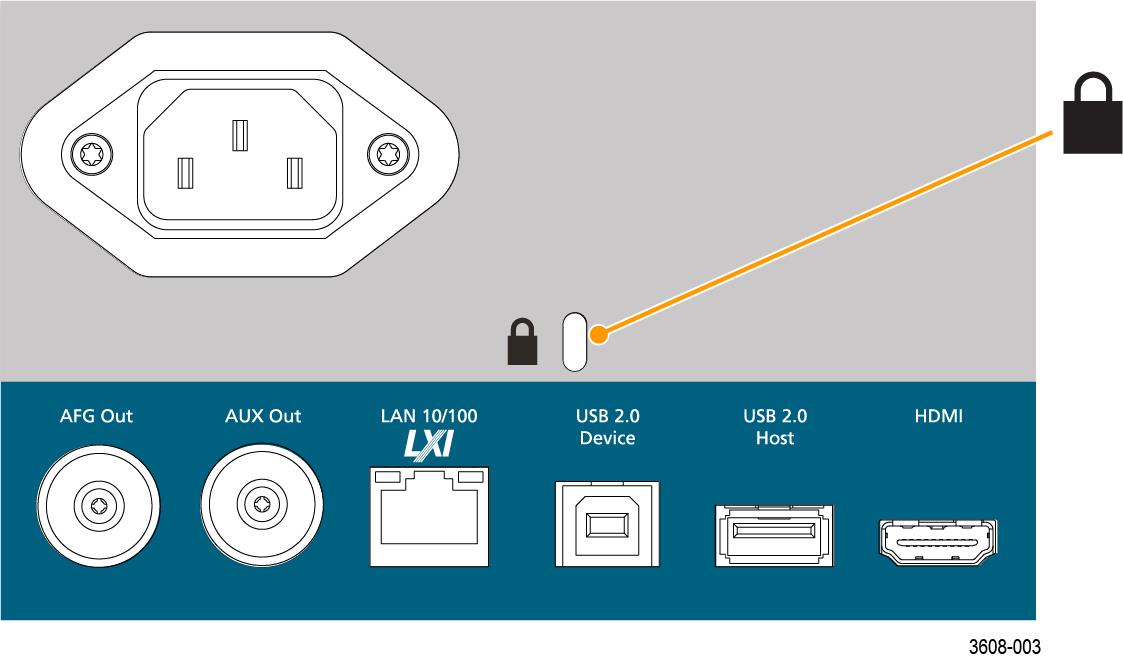
Lock the oscilloscope
Lock an oscilloscope to a test bench or equipment rack to prevent property loss. Attach a standard laptop security lock to the rear panel of the oscilloscope, to secure the oscilloscope to a workbench, rack, or other location.
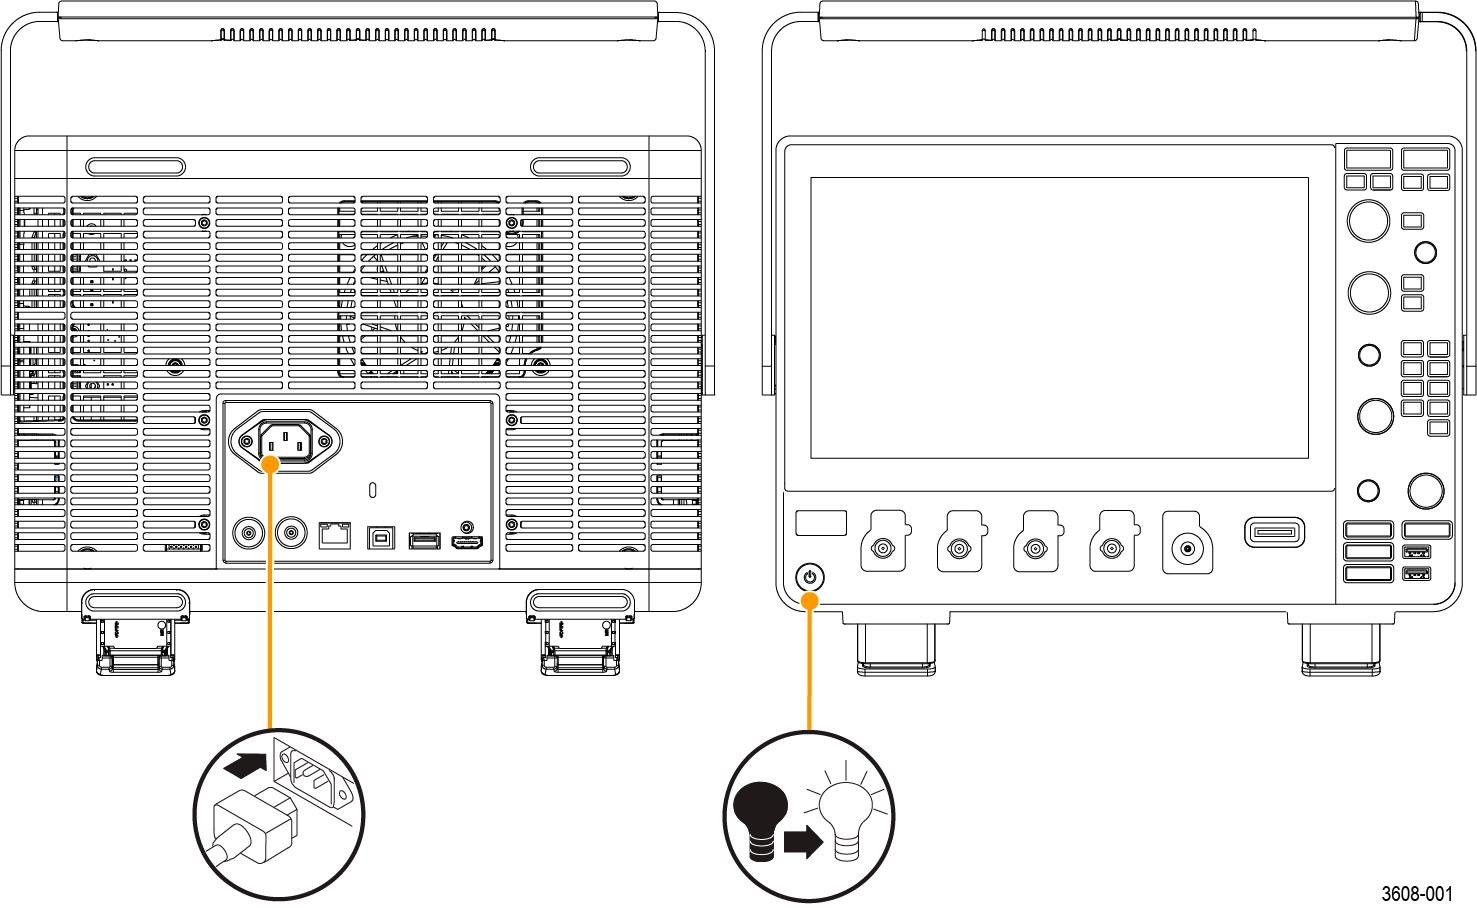
Powering the instrument
Always connect the oscilloscope to AC power using the power cord that shipped with the instrument.
Procedure
- To completely remove power from the instrument, disconnect the power cord.
Figure 1. Power cord connector and power standby switch 
Check that the oscilloscope passes power-on self tests
Power-on self tests verify that all oscilloscope modules are working correctly after power up.
Procedure
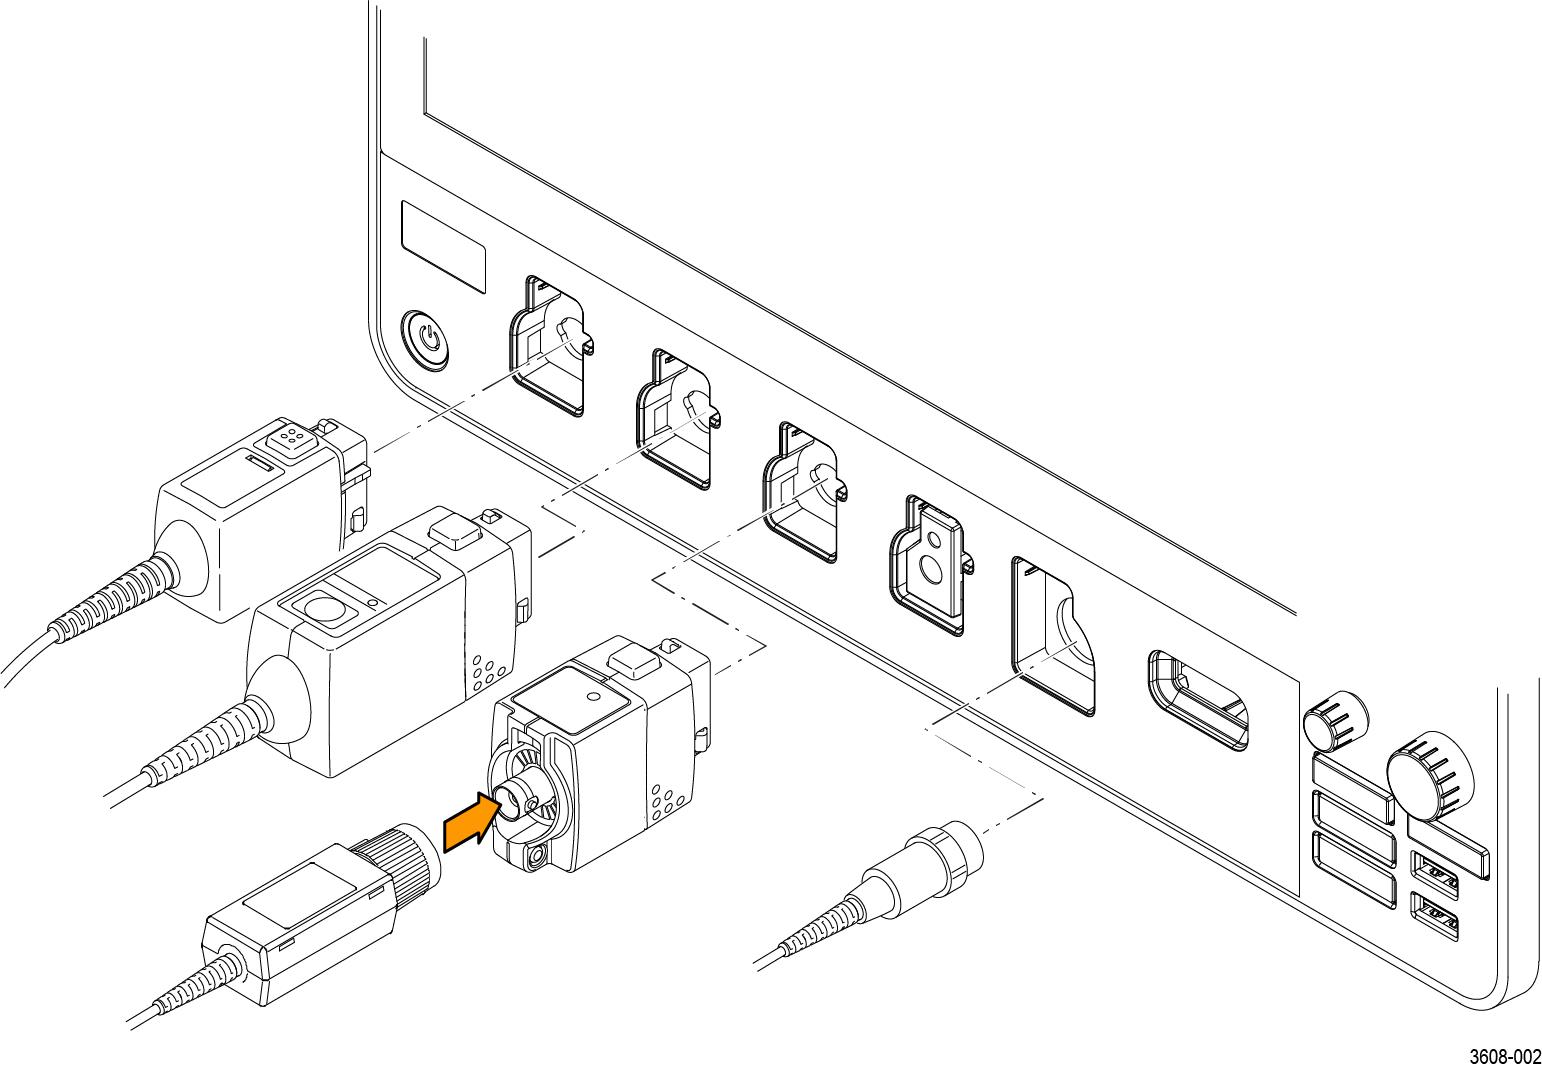
Connecting probes
Probes and cables connect the oscilloscope to your device under test (DUT). Use a probe that best matches your signal measurement needs.
- Tektronix Versatile Probe Interface (TekVPI). These probes support two-way communication with the oscilloscope through on-screen menus and remotely through programmable support. The remote control is useful in applications like ATE where you want the system to set probe parameters.
- Tektronix Versatile Probe Interface (TekVPI) for Passive Probes. These probes build upon the functionality of the TekVPI interface. Each probe is matched with its corresponding oscilloscope channel, allowing the oscilloscope to optimize the signal input path. This provides AC compensation across the frequency band.
- TPA-BNC Adapter. The TPA-BNC Adapter allows you to use TEKPROBE II probe capabilities, such as providing probe power and passing scaling and unit information to the oscilloscope.
- BNC Interfaces. Some of these use TEKPROBE capabilities to pass the waveform signal and scaling to the oscilloscope. Some only pass the signal and there is no other communication.
- Logic Probe Interface. The P6316 probe provides 16 channels of digital (logical one or zero) information.
- TPA-N-VPI Adapter. The TPA-N-VPI Adapter allows you to use TekVPI probes with the RF input.
Connect TPP0250, TPP0500B, TPP1000, TekVPI+, TekVPI, or other supported Tektronix analog probes by pushing them into an input connector. The probe base latch locks with a 'click' when the probe is fully seated.
TekVPI probes automatically set the channel input parameters for that probe (bandwidth, attenuation, termination, and so on). If a probe has a Menu button, push that button to open an on-screen configuration menu. Follow instructions provided with active probes to set their parameters (auto zero, degauss, and so on).
Connect a BNC probe or cable by pushing it onto a channel BNC bayonet connector and turn the lock mechanism clockwise until it locks.
For more information on the many probes available for use with 3 Series MDO oscilloscopes, visit the Oscilloscope Probe and Accessory Selector Tool at www.tek.com.
| Note:Connecting a probe does not automatically enable that channel (make it active). Use the instrument controls or programmatic interface to turn on a channel and open its configuration menu to verify or change probe or cable settings (bandwidth, attenuation, termination and so on). |
Rackmount information
The optional RM3 Rackmount Kit lets you install the oscilloscope in standard equipment racks. The rack mount requires six rack units (6U) of space to install.
Contact Tektronix Customer Support to purchase the rackmount kit option RM3. Follow the instructions that come with the rackmount kit (RM3 Rackmount Kit Instructions).
Make sure to allow at least two inches of clearance on the sides for air ventilation and on the back for any cables you attach to the rear panel.
Remote access from a Web browser
You can remotely access your network-connected instrument from a Web browser to display the instrument user interface on a PC.
About this task
This procedure describes how to remotely access the UI controls and screen for the instrument.
Before you begin
- The oscilloscope must be connected to, and accessible from, the network to which the PC is connected. See Connect to a network (LAN)
- Determine the IP address of the oscilloscope that you want to access. To determine the oscilloscope's IP address, select Utility > IO in the oscilloscope menu bar and view the network settings in the LAN panel.
Procedure
Connect the oscilloscope to a PC using a USB cable
Use a USB cable to connect the oscilloscope directly to a PC for remote instrument control.
Procedure
- On the oscilloscope, select Utility > I/O from the menu bar.
- Tap USB Device Port.
- Confirm that the USB Device Port control is On (default setting).
- Connect a USB cable from the PC to the USB Device port on the rear of the instrument.
- If using the USB connection to remotely control the oscilloscope using GPIB adapter (TEK-USB-488), set the GPIB Talk/Listen Address for your configuration (0 - 30).
Cleaning
Use a dry, soft cotton cloth to clean the outside of the unit. If any dirt remains, use a cloth or swab dipped in a 75% isopropyl alcohol solution. Use a swab to clean narrow spaces around controls and connectors. Do not use any liquid cleaning agents or chemicals that could damage the touchscreen, case, controls, markings or labels, or possibly infiltrate the case.
Getting acquainted with your instrument
The following content provides a high-level description of the instrument controls and user interface. Refer to the instrument help for detailed information on using the controls and user interface to display waveforms and take measurements.
Front panel controls and connectors
The front panel controls provide direct access to key instrument settings such as vertical, horizontal, trigger, and cursors. The connectors are where you input signals with probes or cables or insert USB devices.
| Note:Refer to the instrument help for detailed information on using the controls to display waveforms and take measurements. |
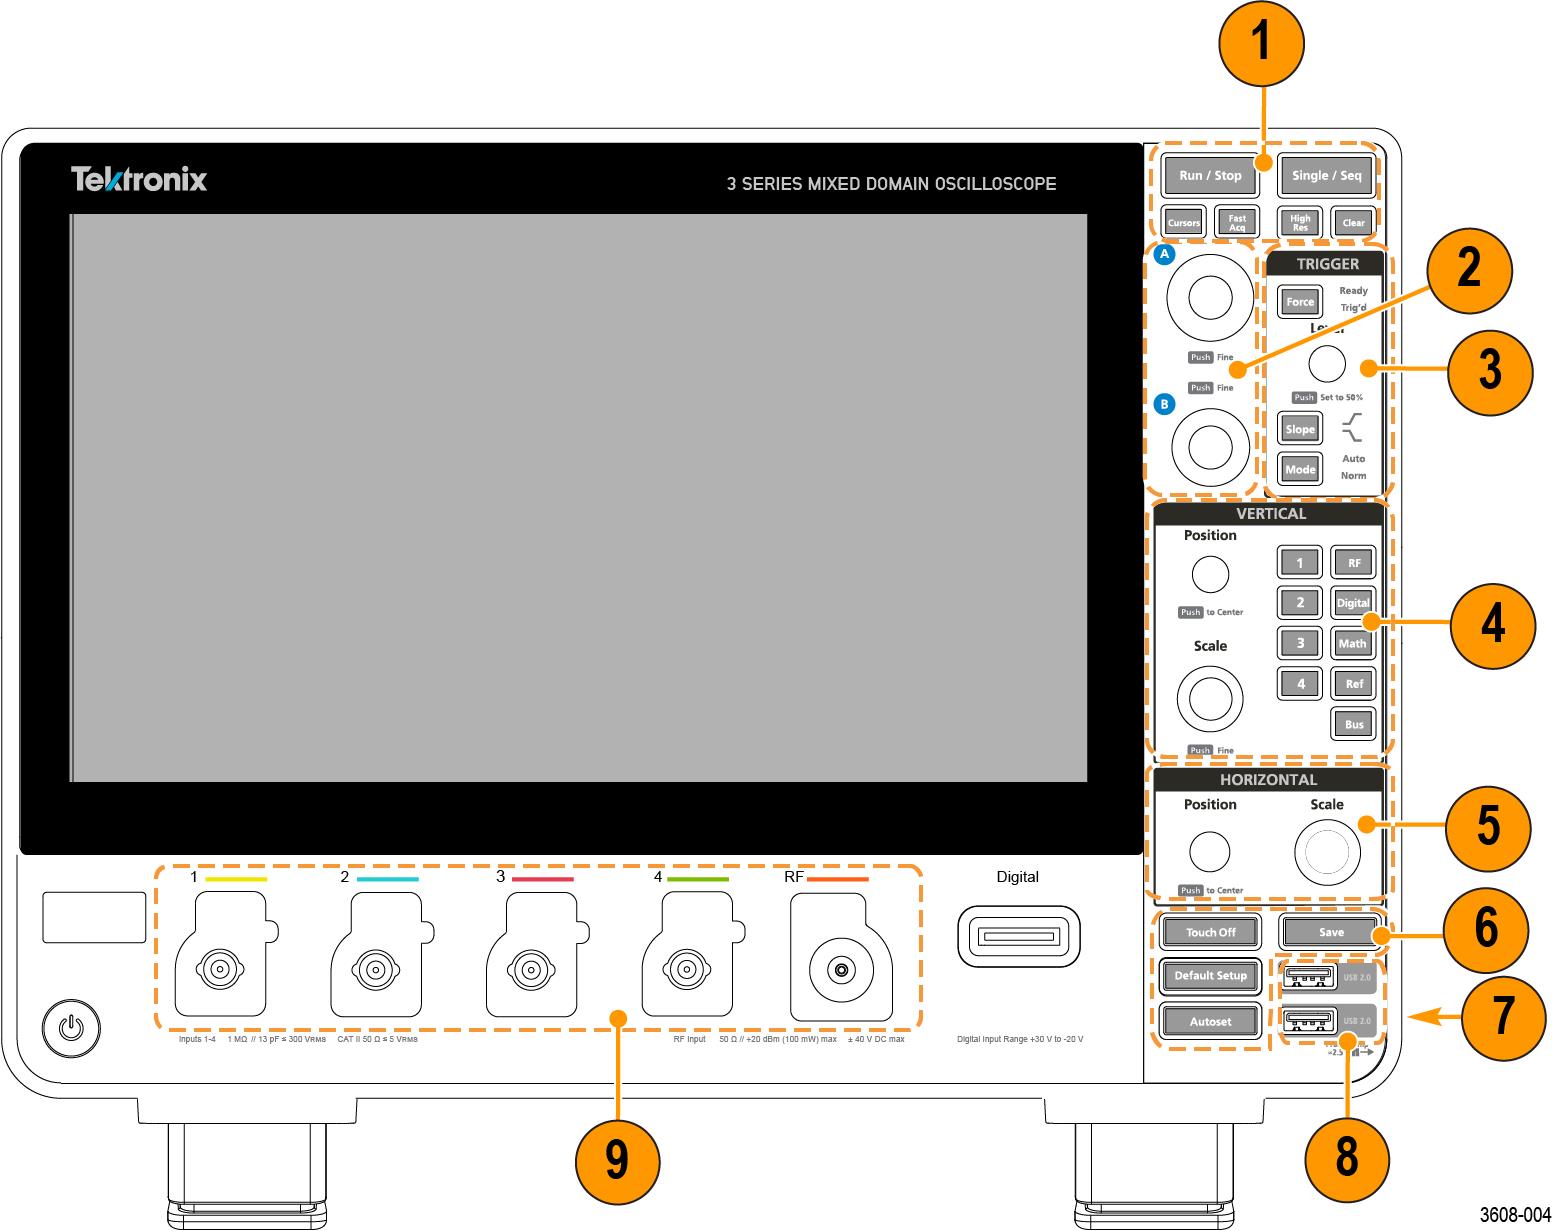
- Use the Acquisition and Cursors controls to start and stop waveform acquisition, turn cursors on or off, enable or disable the fast acquisition mode, enable making a single waveform acquisition, calculate the average of all the samples for each acquisition interval, and delete the current acquisitions and measurement values from memory.
- Use the Multipurpose Knobs (A, B) to move cursors, adjust the zoom, and set parameter values in configuration menu input fields.
- Use the Trigger controls to force a trigger event at a random point in the waveform and captures the acquisition, set the amplitude level that the signal must pass through to be considered a valid transition, set the signal transition direction to detect for a trigger, and set how the instrument behaves in the absence or presence of a trigger event.
- Use the Vertical controls to move the selected waveform up or down on the screen, set the amplitude units per vertical graticule division of the selected waveform, turn on (display) or select channels, and add or select a math, reference (saved), bus, RF, and digital waveform on the Waveform view.
- Use the Horizontal controls to move the waveform from side to side on the screen, and set the time per major horizontal graticule division and samples/second parameters for the oscilloscope.
- Use the Miscellaneous controls to turn touchscreen capability off, restore the oscilloscope settings to the default settings, automatically display a stable waveform, and save files or settings (using the current File > Save As settings).
- Use Ground and probe compensation connectors to provide a ground connector to help reduce electrostatic damage (ESD) and adjust the high-frequency response of a passive probe. The Ground and Probe Compensation connectors are located at the lower right side of the instrument, near the front panel.
- USB ports are located at the lower right corner of the front panel and on the rear panel. Connect USB flash drives to which you can save or recall data (such as instrument software updates, waveforms, settings, and screen captures) or connect peripheral devices such as a mouse or keyboard.
- Use the Probe connectors to connect TekVPI+ and TekVPI measurement probes, BNC passive probes, the P6316 Logic Probe, and BNC cables.
Rear panel connections
The rear panel connections supply power to the oscilloscope and provide connectors for network, USB devices, video, reference signals, and the AFG output.
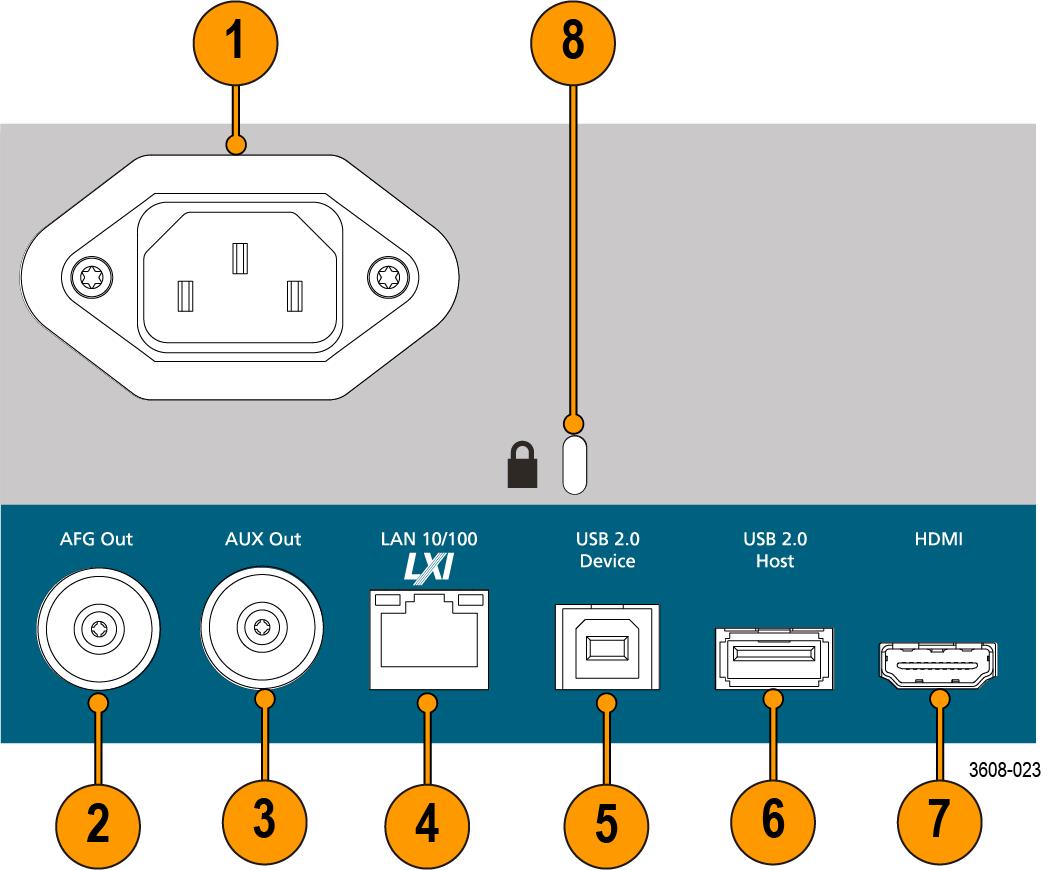
- Power cord connector. Use only the power cord specified for this product and certified for the country of use.
- AFG Out is the signal output for the optional Arbitrary Function Generator (AFG) feature.
- AUX Out generates a signal transition on a trigger event or outputs a synchronization signal from the AFG.
- LAN connector (RJ-45) connects the oscilloscope to a 10/100 Base-T local area network.
- USB Device port lets you connect to a PC to remotely control the oscilloscope using the USBTMC protocol.
- USB Host port lets you connect a USB memory device, keyboard, or mouse.
- HDMI output lets you connect an external monitor or projector to show the oscilloscope screen.
- Security lock connector lets you use a standard PC/laptop lock cable to secure the oscilloscope to a work bench or other location.
User interface
The touchscreen user interface contains waveforms, measurement readouts, and touch-based controls to access all oscilloscope functions.
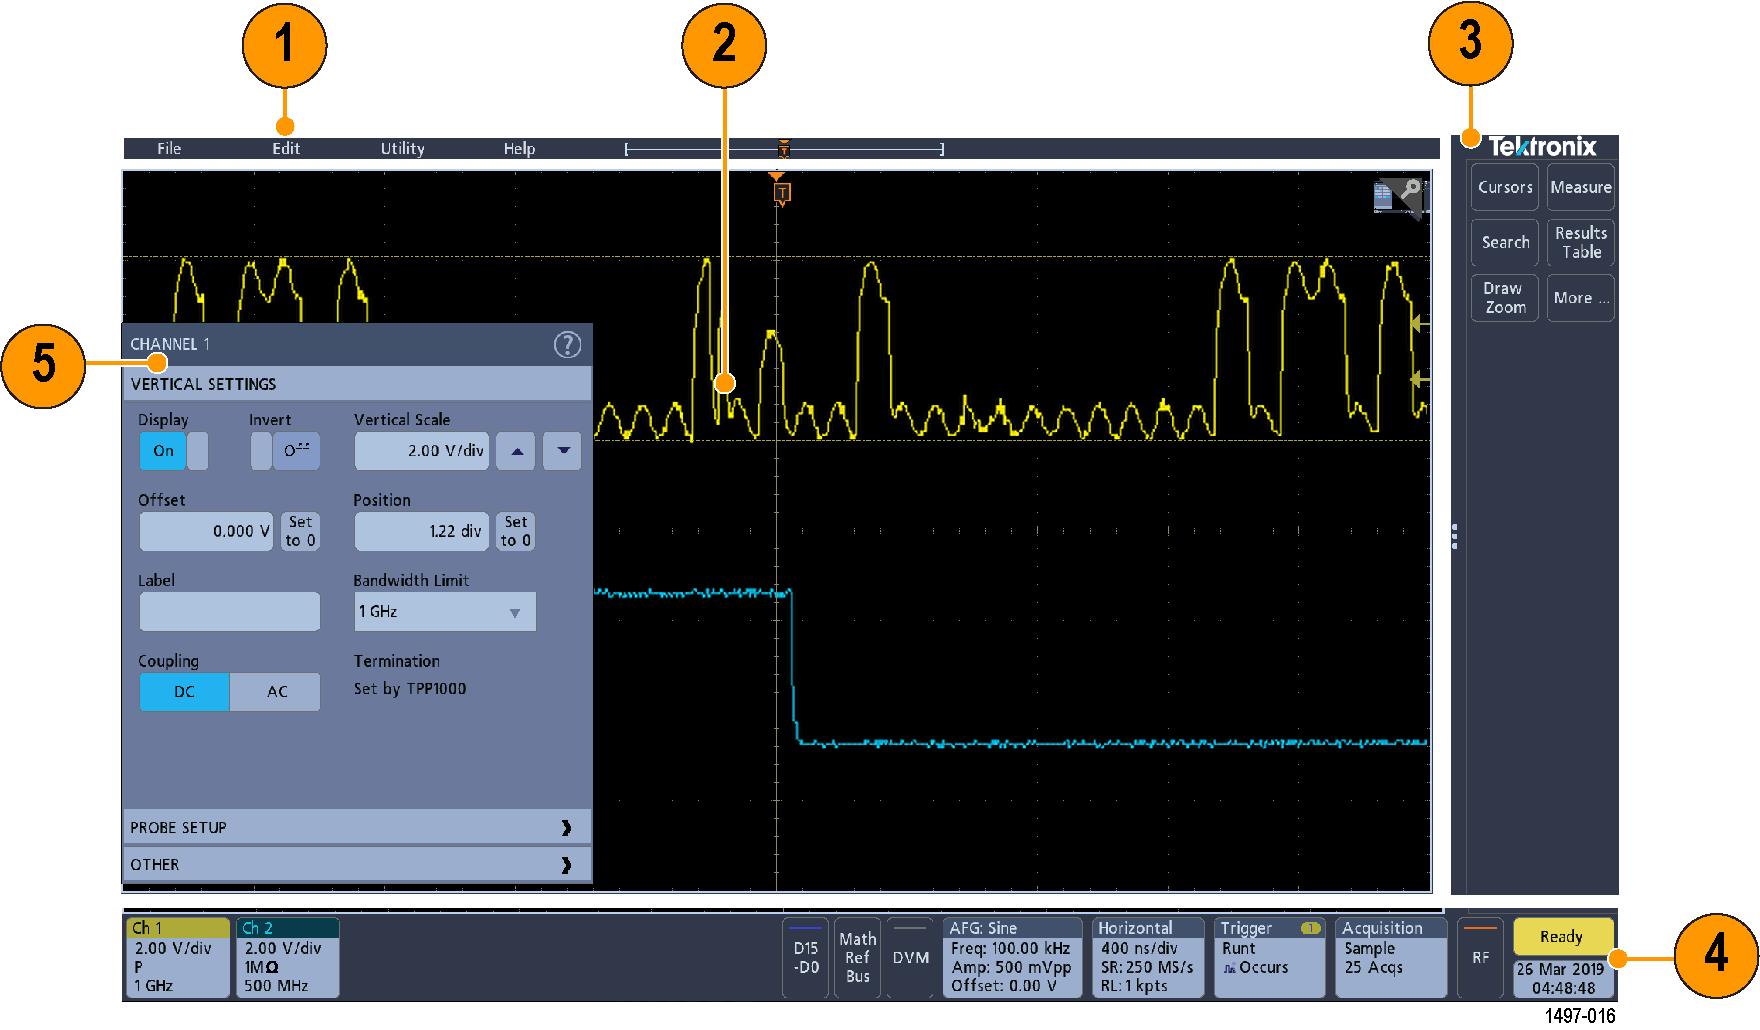
- The Menu bar provides menus for typical operations including:
- Saving, loading, and accessing files
- Undoing or redoing an UI action
- Setting oscilloscope display and measurement preferences
- Configuring network access
- Running self tests
- Erasing measurement and settings memory (TekSecure™)
- Loading option licenses
- Opening a Help viewer
- The Waveform View area displays analog, digital, math, reference, and bus waveforms. The waveforms include waveform handles (identifiers), trigger position, and level(s) indicators. See Identifying items in the time domain display.
- The Results Bar contains controls for displaying cursors, adding result tables to the screen, and adding measurements to the Results bar. The controls are:
- The Cursors button displays on-screen cursors. Touch and drag or use the Multipurpose knobs to move the cursors. Double-tap on a cursor or on the cursor readouts to open a configuration menu to set cursor types and related functions.
- The Measure button opens a configuration menu from which to select and add up to four measurements to the Results bar. Each measurement you add has a separate badge. Double-tap a measurement badge to open its configuration menu.
- The Search button lets you detect and mark a waveform where specified events occur. Tap Search to open a Search configuration menu and set the search conditions for analog and digital channels. Search badges are added to the Results Bar.
- The Results Table button adds a Measurement, Bus, Search, and Harmonics results table to the screen. The Measure tab displays all measurements present in the Results bar. The Bus tab displays bus decode information for displayed bus waveforms. The Search tab displays search event information. The Harmonics tab displays harmonic measurement results.
- The More... button on the Results Bar allows you to select Zoom or Mask.
- The Draw Zoom/Mask button lets you to draw a mask or zoom. This button reflects the function selected in DRAW A BOX menu.
- The Measurement and Search badges show measurement and search results and are displayed in the Results Bar.
- The Settings Bar contains System badges for setting Horizontal, Trigger, Acquisition, and Date/Time parameters; Inactive Channel buttons to turn on channels; Math/Ref/Bus button to add math, reference, and bus waveforms to the display; and Channel and Waveform badges that let you configure the individual waveform parameters. Tap a channel or waveform button to add it to the screen and display a badge. Double-tap a badge to open its configuration menu.
- Configuration Menus let you quickly change the parameters of the selected user interface item. You can open configuration menus by double-tapping on badges, screen objects, or screen areas.
Identifying items in the time domain display
Each area of the user interface has a specific function that helps manage information or controls. This topic shows and describes the key user interface elements.
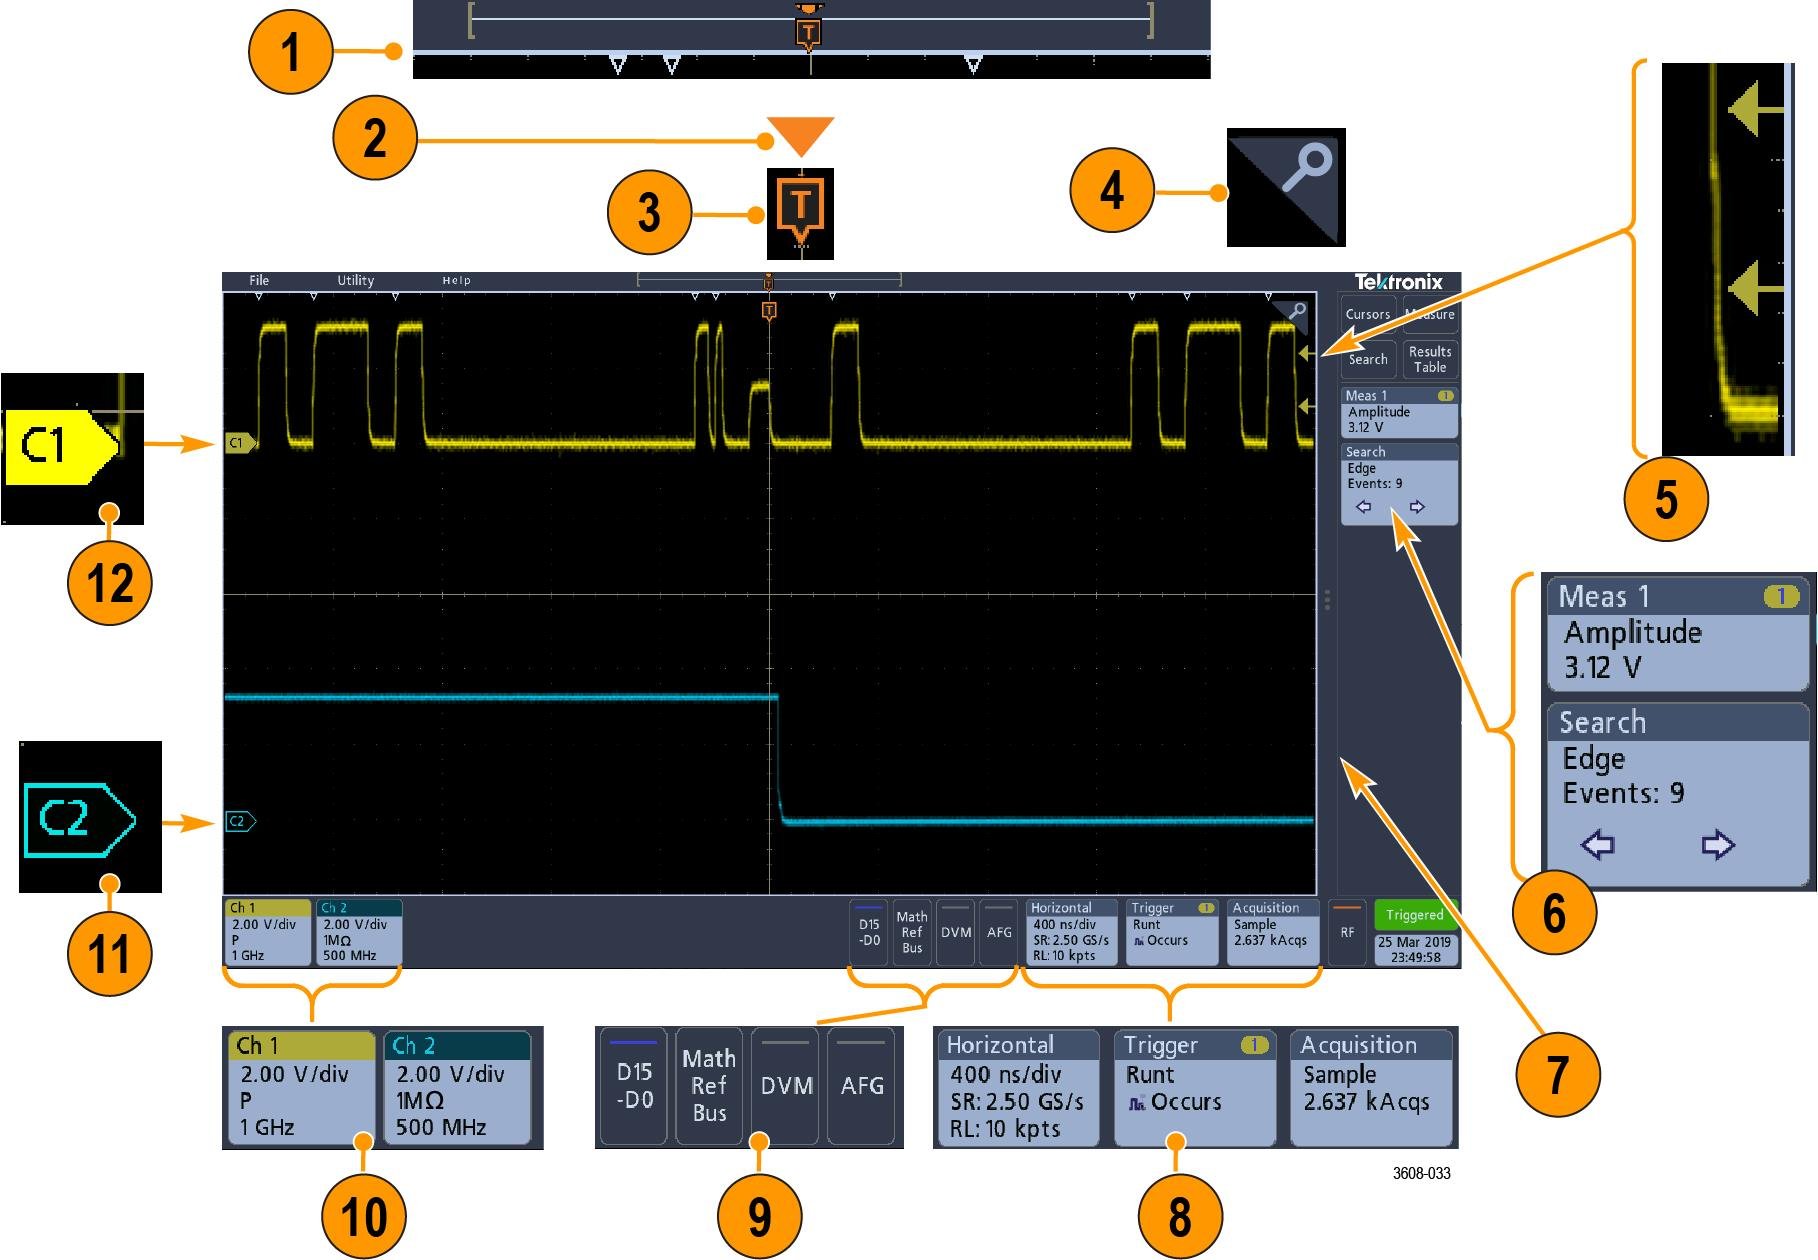
- The Waveform Record View is a graphical high-level view of the overall acquisition, how much of the acquisition is on the screen (shown in brackets), the location of key time events including the trigger event, and the current position of waveforms cursors.
If you are changing the horizontal time scale while the oscilloscope acquisition is stopped, the brackets change position to show the part of the waveform record that is being viewed relative to the current acquisition total record length.
If cursors are active on a waveform, the Waveform Record View shows the relative cursor positions as small vertical dashed lines.
When in Zoom mode, the Waveform Record View is replaced with the Zoom Overview. See Zoom user interface.
- The Expansion Point icon on the waveform view shows the center point around which the waveform expands and compresses when changing horizontal settings.
- The Trigger Position Indicator shows where the trigger event occurred in the waveform record.
- The Zoom icon (in upper right corner of Waveform and Plot views) toggles zoom on and off.
- The Trigger Level Indicator icon(s) shows the trigger level(s) on the trigger source waveform. Some trigger types require two trigger levels.
- Measurement and Search badges show measurement and search results. See Badges.
- The Results Bar Handle opens or closes the Results bar to maximize waveform screen viewing when needed. To reopen the Results bar, either tap the handle icon or swipe left from the right side of the display.
- The System badges show global instrument settings (Horizontal, Trigger, Acquisition, Run/Stop status, and Date/Time). See Badges.
- The Inactive Channel buttons add channel waveforms to the Waveform view and add an associated Channel badge to the Settings bar.
The Add Math Ref Bus button expands allowing you to add a math, reference, or bus waveform to the Waveform view and add an associated Waveform badge to the Settings bar.
The RF button activates the frequency domain display and adds an RF badge. Double-tap the badge to open the RF configuration menu to configure the RF input. This button is only active if one of the RF options is enabled.
The AFG button opens the AFG configuration menu to set and enable the AFG output. This button is only present if the AFG option is installed.
The DVM button lets you use an analog probe to take DC, AC RMS, or DC+AC RMS voltage measurements on your DUT. Tap the button to add a DVM badge to the Results Bar and open a configuration menu. The DVM option also enables a trigger frequency counter, accessible from the Mode & Holdoff panel in the Trigger badge menu. This button is only present if the DVM option is installed.
- Double-tap a badge to open its associated configuration menu. See
Badges. See
Configuration menus.
If you add more Channel or Waveform badges than can fit in the waveform badge display area, tap the scroll buttons at each end of the waveform badge area to scroll and display hidden badges.
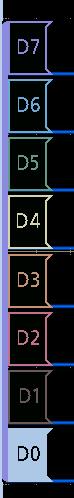
- The Waveform Handles on each waveform identify the source of that waveform (Cx for channels, M for Math, Rx for Reference waveforms, Bx for bus waveforms). The waveform handles are at the zero-volt level of the waveform by default. The currently selected waveform handle is a solid color; unselected waveform handles are outlined.
Double-tapping a waveform handle opens the configuration menu for that waveform.
For digital channels, the waveform handle shows the channel number, with each individual digital signal labeled D0–D15 and displayed with a different color.
Double-tapping a digital waveform handle opens the digital channel configuration menu.
Dragging a digital signal handle over another handle swaps location of the signals in the waveform view. Dragging a digital signal handle out of the group, creates a new group. A selected digital group or signal handle can be moved using the Vertical Position control.


Identifying items in the frequency domain display
To activate the frequency domain display, press the front panel RF button or tap the RF button in the display. Each area of the user interface has a specific function that helps manage information or controls.
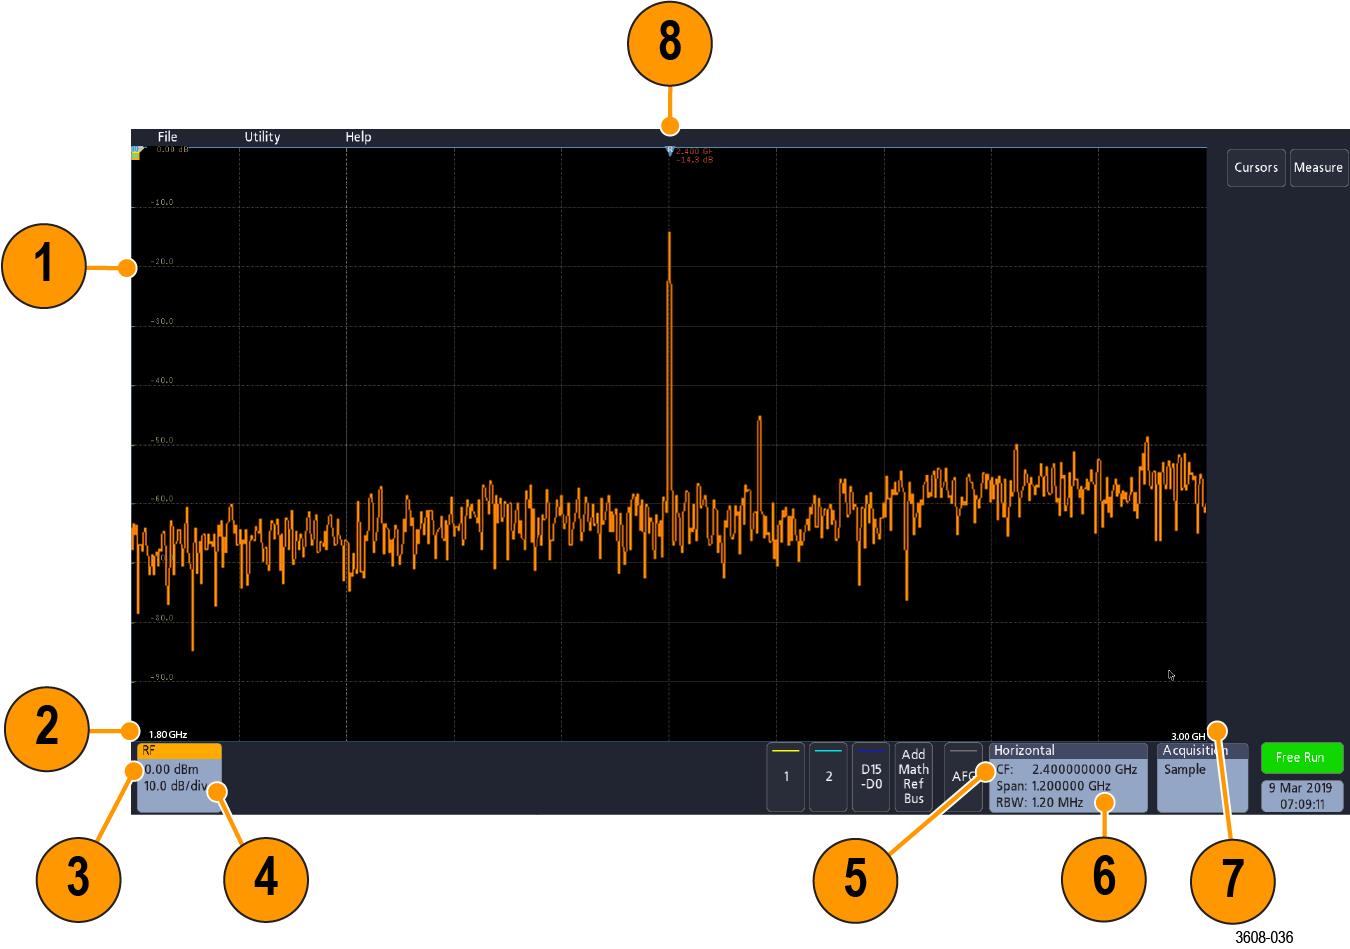
- Vertical graticule labels
- Start frequency
- Reference level
- Vertical scale
- Center frequency
- Span and resolution bandwidth
- Stop frequency
- Reference marker
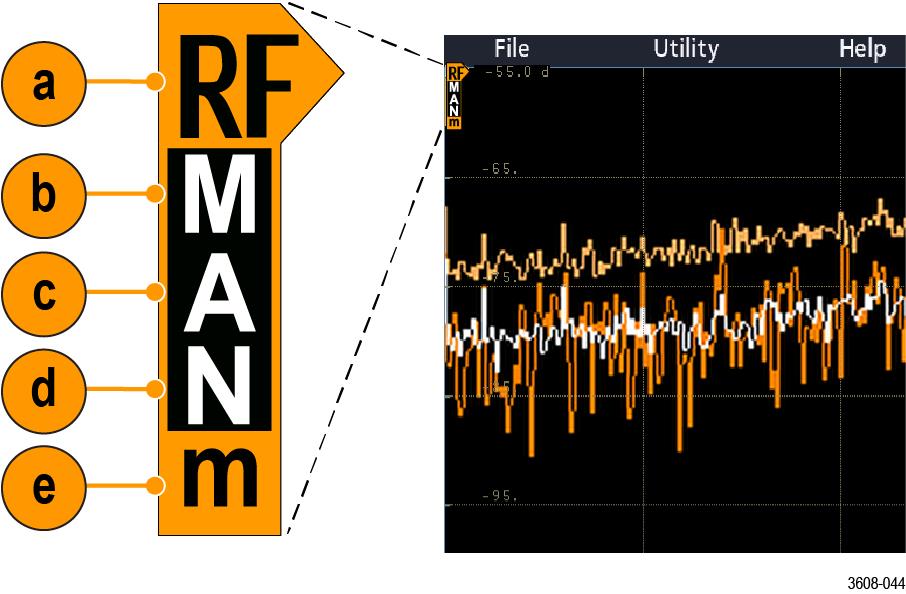
- Displayed trace indicators
- An RF trace indicator is placed at the Reference Level.
- A capital M appears if the maximum trace is turned on.
- A capital A appears if the average trace is turned on.
- A capital N appears if the normal trace is turned on.
- The small m appears if the minimum trace is turned on.
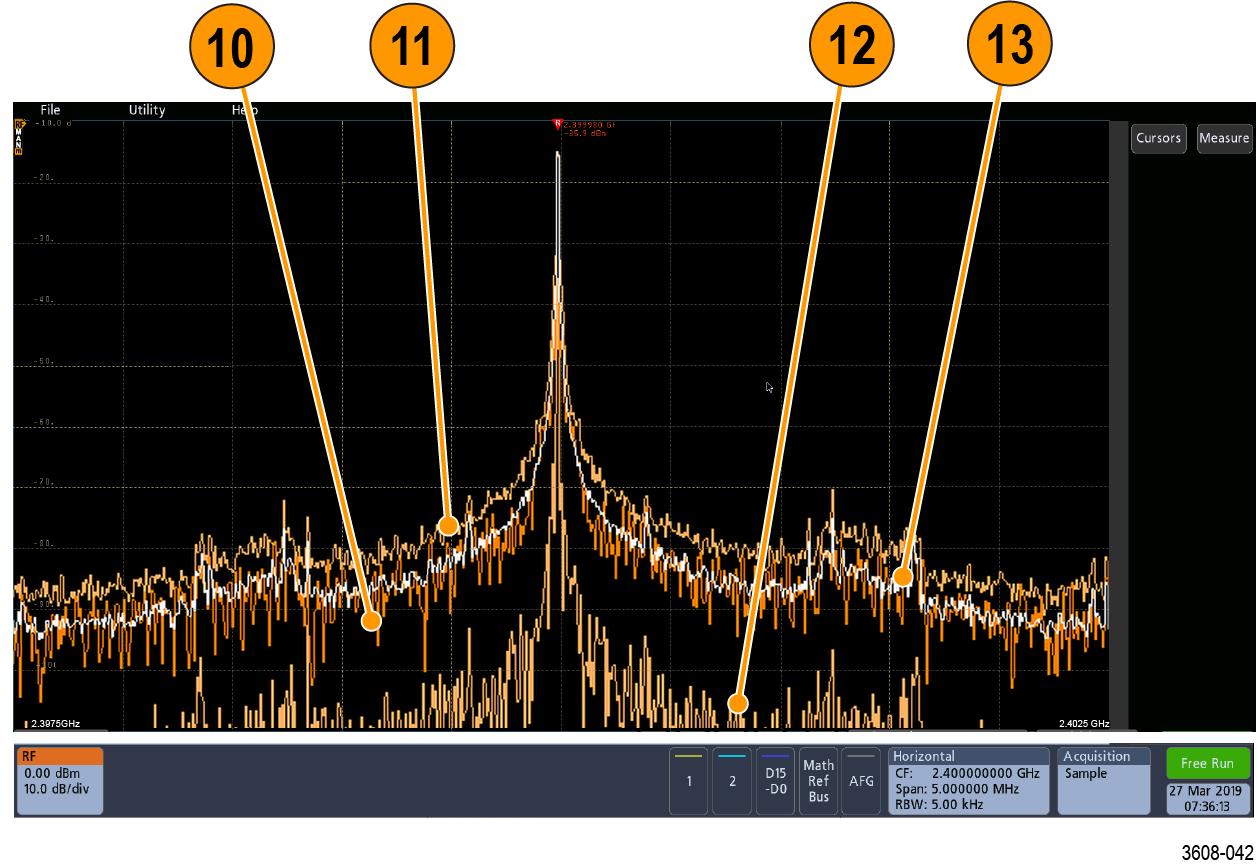
Orange highlighting indicates the currently selected trace. In the figures the small m, which stands for the minimum trace, is highlighted. This indicates that the minimum trace is currently selected.
- Normal trace: Each acquisition is discarded as new data is acquired.
- Max hold trace: The maximum data values are accumulated over multiple acquisitions of the Normal trace.
- Min hold trace: The minimum data values are accumulated over multiple acquisitions of the Normal trace.
- Average trace: Data from the Normal trace is averaged over multiple acquisitions. This is true power averaging, which occurs before the log conversion. Each power of 2 averaging reduces the displayed noise by 3 dB.
Badges
Badges are rectangular icons that show waveform, measurement, and instrument settings or readouts. Badges also provide fast access to configuration menus. The badge types are Channel, Waveform, Measurement, Search, and System.
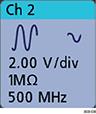
Channel and Waveform badges
Channel and Waveform (Math, Ref, Bus) badges are shown in the Settings Bar, located along the bottom left of the screen. Each waveform has its own badge. The badges show high-level settings for each displayed channel or waveform. Double-tap a badge to open its configuration menu.
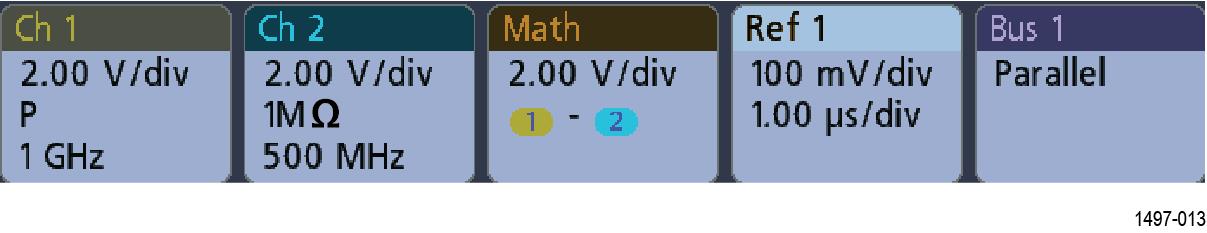
Most Channel and Waveform badges also have Vertical Scale buttons, shown by single-tapping the badge. Use these buttons to increase or decrease the vertical scale setting for that waveform.
You can drag or flick Channel and Waveform badges down off the display to turn them off. Swiping back up from the bottom of the display restores them if they were accidentally deleted.
Channel badges are listed in the channel order. For more information, double-tap the badge to open its configuration menu or search the instrument Help.
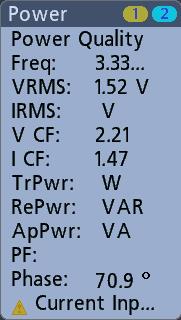
Measurement badges
Result badges are located in the Results Bar. They show measurement or search results. The badge title also shows the measurement source or sources. To add a Measurement badge, tap the Measure button, select a measurement, and tap Add.
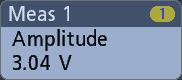
Double-tap a Measurement badge to open its configuration menu to change or refine settings.
To add statistical readouts to individual measurement badges, double-tap a measurement badge to open its configuration menu and select Show Statistics in Badge.
You can drag or flick Measurement badges off to the right of the display to delete them. You can bring the badge back by swiping in from the right.
Mask Test Badge
The mask test results and measurement statistics are displayed in the Mask Test badge in the Results bar. The badge is created when the first segment of a mask is defined.
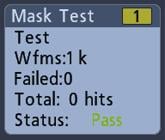
| Badge readout | Description |
|---|---|
| Label | A label defined in the badge configuration menu. |
| Wfms | The total number of waveforms tested against the mask. |
| Failed | The number of waveforms that contained one or more samples that violated the mask. |
| Hits (optional readout) | A row is created for each segment that makes up the mask. The number displayed is the number of times that segment has been hit. |
| Total | The total number of hits on all segments. |
| Status | The status of the mask test. Either Pass (green) or Fail (red) is displayed. |
Double-tap a Mask Test badge to open its configuration menu to change or refine settings.
You can drag the badge to change its position in the Results bar and open the badge right click menu to access a quick-action menu.
- Right-click the badge and turn it off.
- Flick the badge off the right edge of the display to remove it from the Results bar. Flicking left from the right edge of the Results bar recovers the badge. Badge recovery is only possible within 10 seconds of removal.
See for the mask test configuration settings Create a Mask for more information masks and Mask Test badge configuration menu.
Search badges
Search badges are also shown in the Results Bar, below the Measurement badges. A search badge lists the search source, search type, and the number of search event occurrences in the current acquisition. The instrument marks the waveform where those events occur with small down-pointing triangles along the top of the waveform graticule. Double-tap a search badge to open its configuration menu to change or refine search settings.
Search badges are created by tapping the Search button. Use the displayed configuration menu to set the search criteria.
Search badges have < (Previous) and > (Next) Navigation buttons that open the Zoom mode and center the waveform in the display at the position of the previous or next search mark in the waveform record. Search badge Navigation buttons are only usable when acquisitions are stopped.

You can drag or flick a Search badge to the right, off the display, to delete it. You can bring the badge back by swiping in from the right.
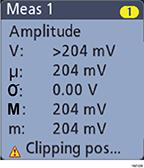
Signal clipping and badges
Clipping causes inaccurate amplitude-related measurement results. Clipping also causes inaccurate amplitude values in saved waveform files. If a math waveform is clipped, it will not affect amplitude measurements on that math waveform.
| WARNING:Clipping is caused by excessive or dangerous voltages at the probe tip and/or a vertical scale setting that is not adequate to display the entire vertical range of the waveform. Excessive voltage at the probe tip can injure the operator and cause damage to the probe and/or instrument. |
This instrument shows a warning triangle symbol and the word Clipping in a Channel badge when a vertical clipping condition exists. Any measurement badges associated with that channel also indicate a clipping condition.
To close the clipping message, change the vertical scale to show the entire waveform, disconnect the probe tip from the excessive voltage source, and check that you are probing the correct signal using the correct probe.
Error messages and badges
This instrument shows a warning triangle symbol and an error message abbreviation in a Channel badge when an error occurs.
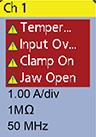
To remove the message from the badge, clear the error.
System badges
System badges (in the Settings bar) display the main Horizontal, Trigger, and Acquisition settings. You cannot delete System badges.
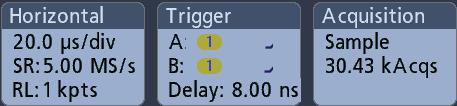
Double-tap a System badge to open its configuration menu.
The Horizontal badge also has Scale buttons, shown by single-tapping the badge. Use the Horizontal Scale buttons to increase or decrease the horizontal time/div setting.
Common badge actions
| Action | Result | Example |
|---|---|---|
| Single tap | Immediate access controls (Scale, Navigation). |
|
| Double tap | Configuration menu with access to all settings for the badge. |
 |
| Touch and hold | Right-click menu with single tap access to common actions. Typical actions include turning off a channel and deleting a measurement or search badge. |
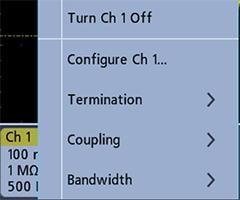 |
Configuration menus
Configuration menus let you quickly set the parameters for channels, system settings (Horizontal, Trigger, Acquisition), measurements, cursor readouts, Waveform view, and so on.
Double-tap an item (badge, Waveform View, cursor readouts, and so on) to open its configuration menu. For example, double-tap a Channel badge in the Settings Bar to open its configuration menu.
Selections or values that you enter take effect immediately. Menu contents are dynamic and can change depending on your selections, instrument options, or attached probes.
Related settings are grouped into 'panels.' Tap the panel name to show those settings. Changes to panel settings can change the values and/or fields shown in that panel and other panels.
Tap anywhere outside a configuration menu to close it.
To open Help content for a configuration menu, tap the question mark icon in the upper right corner of the menu.
Zoom user interface
Use the zoom tools to magnify waveforms to view signal details.
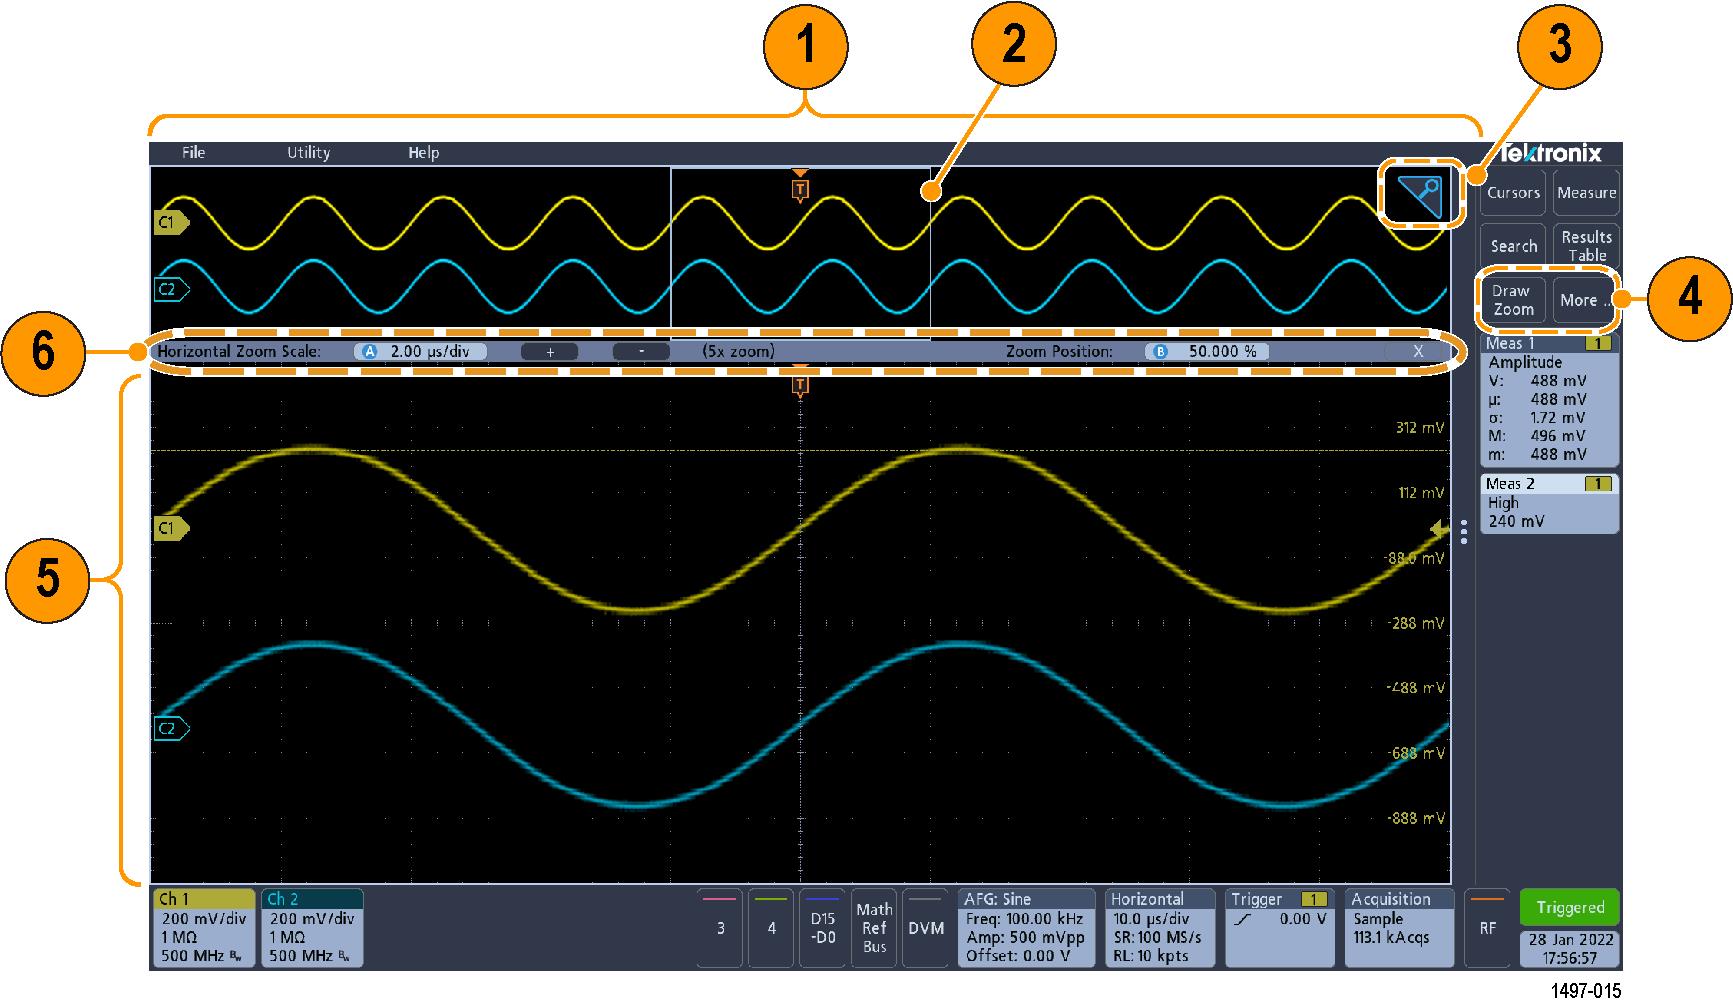
- The Zoom Overview shows the entire waveform record. Use pinch and expand gestures on the Zoom Overview waveforms to change the horizontal time base settings.
- The Zoom Box shows the area of the Zoom Overview to display in the Zoom View (see 5). You can touch and drag the box to move the area to view. Moving the Zoom Box or changing its position does not change the horizontal time base settings.
- The Zoom icon (in the upper right corner of the Waveform View) switches zoom mode on and off.
- The DRAW A BOX menu has an option to toggle between drawing a zoom box (default mode) and drawing segments for Mask Testing.
A zoom box lets you quickly draw a box around an area of interest in the Waveform or Zoom Overview. Drawing a box immediately puts the oscilloscope into zoom mode. To draw a zoom box, tap the Draw Zoom button while in Zoom mode in the DRAW A BOX menu, then touch and drag on the waveform to draw a box waveform. You can continue to draw zoom boxes until you single tap anywhere on the screen or open a menu.
To toggle between Zoom mode and Mask mode, tap the More button and select one of the two options in the DRAW A BOX menu.
- The Zoom View shows the zoomed waveforms as marked by the Zoom Box. Use pinch and/or drag options in the zoom view to change the zoomed area of interest. Pinch, expand, and drag gestures in the Zoom View only change zoom magnification settings and Zoom Box position.
- Use the Zoom Title Bar controls to adjust the horizontal size and the position of the zoom area. Click or tap the + or - buttons or use the A and B multipurpose knobs. Double tap the zoom scale and position fields to enter a value using a numerical keypad. Touch the Zoom Position or Horizontal Zoom Scale fields before using the multipurpose knobs to adjust the zoom.
Using the touchscreen interface for common tasks
Use standard touchscreen actions, similar to those found on smart phones and tablets, to interact with most screen objects. You can also use a mouse to interact with the UI. The equivalent mouse operation is shown for each touch operation.
| Task | Touchscreen UI action | Mouse action |
|---|---|---|
| Add a channel, math, reference, or bus waveform to the screen. | Tap an inactive channel button or the Add Math Ref Bus button and select a math, reference, or bus. | Click an inactive channel button or the Add Math Ref Bus button and select a math, reference, or bus. |
| Select a channel, math, reference, or bus waveform to make it active. | Tap the Channel or Waveform badge or waveform handle. | Click the Channel or Waveform badge or waveform handle. |
| Display scale or navigation buttons on a badge (waveform, measurement , search, horizontal). | Tap the badge. | Click the badge. |
| Open a configuration menu on any item (all badges, views, cursor readouts, labels, and so on). | Double-tap the badge, view, or other object. | Double-click the badge, view, or other object. |
| Open a right-click menu (badges, views). | Touch and hold on the badge, Waveform View, or other screen item until a menu opens. | Right-click the object. |
| Close a configuration menu . | Tap anywhere outside the menu or dialog. | Click anywhere outside the menu or dialog. |
| Move a menu. | Touch and hold the menu title bar or a blank area in the menu, then drag the menu to new position. | Click and hold the left mouse button on title or blank area and then drag to new position. |
| Change horizontal or vertical settings directly on a waveform. Vertical changes only apply to the selected channel or waveform; horizontal changes apply to all channels and waveforms. | Tap a badge and use the Scale buttons. Or, use pinch/expand gestures. | Click a channel, waveform, or Horizontal badge and click on the Scale buttons. |
| Increase or decrease the zoom area (while in Zoom mode). | Touch and hold two fingertips on the waveform view, move them together or apart vertically or horizontally, lift from screen, and repeat. | Click and drag the zoom area. Click the + or - buttons on the Zoom Title bar. |
| Adjust the zoom position (while in Zoom mode). | Touch and drag in the zoom area to adjust the position of the zoom. | Click and drag in the zoom area to adjust the position of the zoom. |
| Quickly scroll or pan a waveform. | Touch and drag in the waveform. | Click and drag in the waveform or list. |
| Close or open the Results Bar to increase the Waveform View area. | Tap on the Results Bar Handle or anywhere in the border between the Waveform View and the Results Bar. | Click the Results Bar Handle or anywhere in the border between the Waveform View and the Results Bar. Click and drag the Results Bar divider. |
Configure the instrument
Configurations to help operate your instrument efficiently. Refer to the instrument help for additional configuration information.
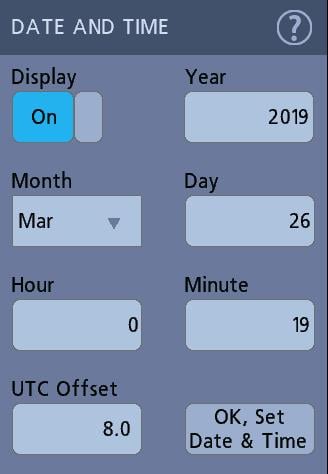
Set the date and time
Set the date and time so that saved files are marked with the correct date and time information.
Procedure
- Double-tap the
Date/Time badge (bottom-right of screen) to open the configuration menu.
Download and install the latest firmware
Installing the latest firmware helps ensure that your instrument is equipped with all of the best available measurement and analysis improvements.
Before you begin
Determine the current version of firmware installed on the oscilloscope. The version number is found in the About window under the Help menu on most instruments.
Procedure
- Open up a Web browser on a PC and go to www.tek.com/product-support.
- Enter the oscilloscope model number in the search field and click Go.
- Scroll down the screen and click the Software tab.
- If the listed available firmware version is newer than what is on your oscilloscope, select and download that file to your PC.
- Copy the firmware install file to a USB drive.
- Follow the instructions that are provided with the firmware to create the install files.
- Insert the USB flash drive into any USB Host port on your instrument. The instrument automatically recognizes the firmware file and starts the installation process.
- Follow on-screen instructions. The instrument will take a few minutes to install the new firmware. Do not remove the USB flash drive or power off the instrument during this time.
- After the upgrade is complete, power off the instrument and remove the USB flash drive.
- Power on the instrument.
- To confirm the firmware update, locate the version number found in the About window under the Help.
- Confirm that the instrument firmware version number matches the firmware version number that you just installed.
Run Signal Path Compensation (SPC)
Run SPC at regular intervals for best measurement accuracy. You should run SPC whenever the ambient (room) temperature has changed by more than 5 °C (9 °F) or once a week if you use vertical scale settings of 5 mV/div or less.
About this task
Failure to run SPC on a regular basis may result in the oscilloscope not meeting warranted performance levels at low volts per division settings.
Before you begin
Procedure
- Power on and warm up the oscilloscope for at least 20 minutes.
- Tap Utility > Calibration.
- Tap Run SPC. The SPC Status readout shows Running while SPC is running. SPC can take several minutes per channel to run, so wait until the SPC Status message changes to Pass before reconnecting probes and using the oscilloscope.
- Close the Calibration configuration dialog when SPC has completed.
- If SPC fails, write down any error message text. Make sure that all probes and cables are disconnected and run SPC again. If SPC still fails, contact Tektronix Customer Support.
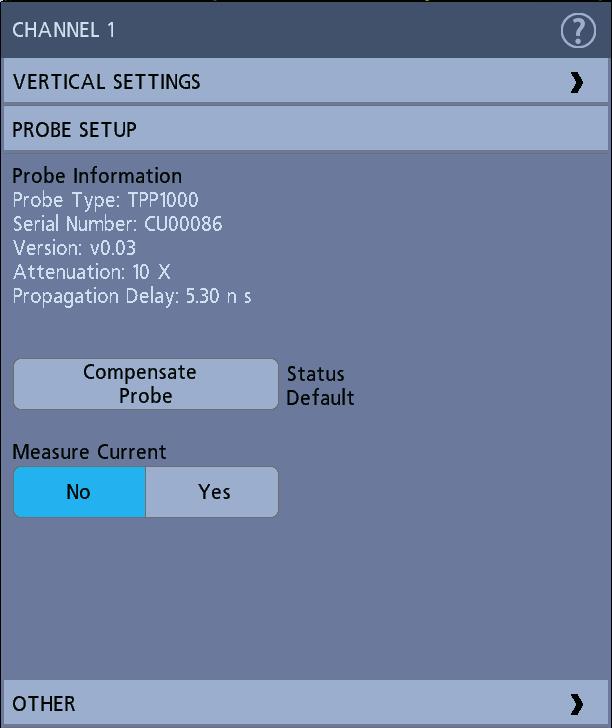
Compensate TPP0250, TPP0500B, or TPP1000 probes
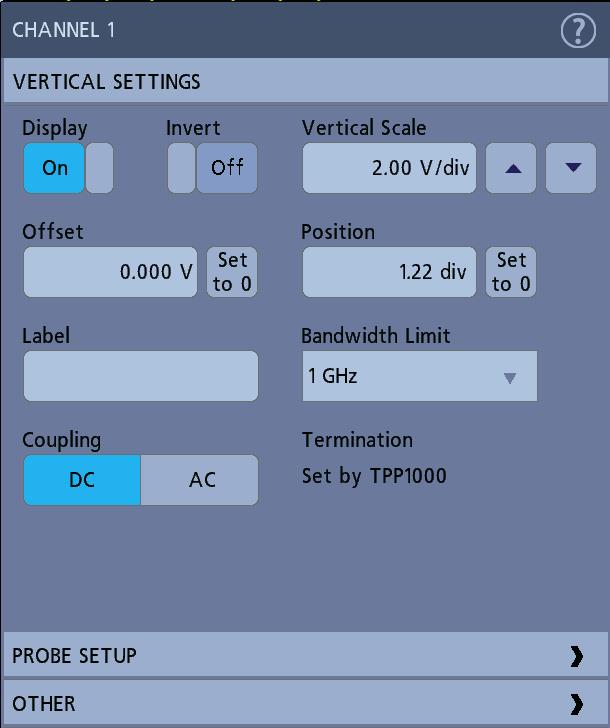
Probe compensation adjusts the high frequency response of a probe for best waveform capture and measurement accuracy. The oscilloscope can automatically test and store compensation values for TPP0250, TPP0500B and TPP1000 probes.
About this task
- If the Probe Compensation Status field displays Pass, the probe is compensated and ready for use.
- If the Probe Compensation Status field displays Default, the attached probe has not been compensated and needs to have this probe compensation procedure run.
- If the Probe Compensation Status field displays Fail, the attached probe has failed the probe compensation procedure. Reconnect the probe and run probe compensation again.
- If there is no probe compensation status field shown in the panel, the oscilloscope cannot store compensation values for that probe. See the oscilloscope Help for how to manually compensate passive probes not supported by the probe compensation function.
- Each compensation generates values for a specific probe and channel combination. If you want to use the probe on another channel and desire to compensate the new probe-channel pair, you must run a new set of compensation steps.
- Each channel can store compensation values for 10 individual probes. If you try to compensate an 11th probe on a channel, the oscilloscope will delete the values for the least recently used probe and add the values for the new probe.
Use this procedure to compensate a TPP0250, TPP0500B, TPP1000, or other supported TPP-family probe that shows a Default status when connected to the oscilloscope.
| Note: A Default Setup does not delete probe compensation values. A factory calibration deletes all stored probe compensation values. |
Before you begin
Procedure
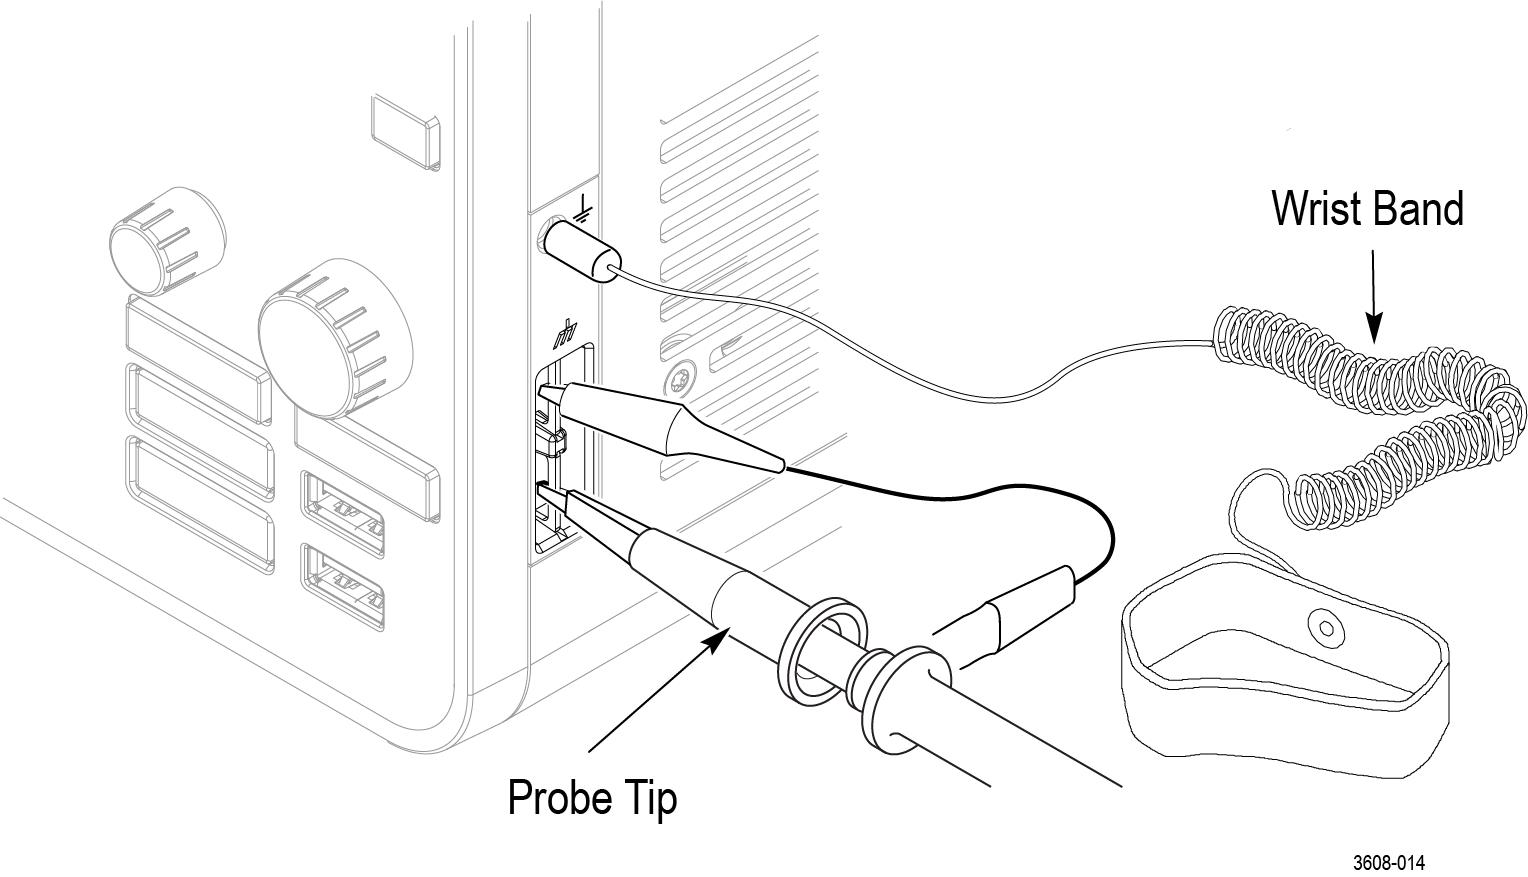
- Connect the probe tip and ground lead of the probe to the PROBE COMP terminals on the lower right of the oscilloscope (see following image).
Figure 1. Probe Comp connections. Connect the probe tip to the 1 kHz source and the ground clip to the ground. For best results, remove any probe tip accessories and hold the probe tip directly onto the 1 kHz connector.
Note:Connect only one probe at a time to the PROBE COMP terminals. - Repeat these steps to compensate supported probes on other channels of the oscilloscope.
Note:For most accurate measurements, open the Probe Setup panel and verify the Probe Compensation Status is Pass whenever you attach a probe to a channel.Note:A probe compensation failure is most likely due to intermittent connection of the probe tip or ground connection during the probe compensation operation. If a failure occurs, the oscilloscope will re-use the old probe compensation values if they existed prior to the failed probe compensation operation.
Connect to a network (LAN)
Connecting to a network allows you to remotely access the instrument.
Before you begin
Procedure
Help us improve our technical documentation. Provide feedback on our TekTalk documentation forum.